Market Overview
| Study Period | 2017 - 2030 |
|---|---|
| Base Year For Estimation | 2024 |
| Forecast Data Period | 2025 - 2030 |
| Market Size (2025) | USD 11.85 Billion |
| Market Size (2030) | USD 16.41 Billion |
| Growth Rate (2025 - 2030) | 6.74% CAGR |
| Market Concentration | Low |
Major Players*Disclaimer: Major Players sorted in no particular order Image © Mordor Intelligence. Reuse requires attribution under CC BY 4.0. |
|

Russia Fertilizers Market Analysis by Mordor Intelligence
The Russia Fertilizers Market size is estimated at 11.85 billion USD in 2025, and is expected to reach 16.41 billion USD by 2030, growing at a CAGR of 6.74% during the forecast period (2025-2030).
Russia's fertilizer industry is undergoing significant transformation driven by technological advancements and sustainability initiatives. In 2023, major industry players like Yara International and Lantmännen entered a commercial agreement to introduce environmentally friendly fertilizers produced using renewable energy sources, marking a pivotal shift towards sustainable agricultural practices. This transition is particularly significant as conventional fertilizers currently dominate the market with a 92.7% share, indicating substantial potential for growth in sustainable alternatives. The industry's evolution is further exemplified by companies like PhosAgro, which has expanded its portfolio to include innovative products like APAVIVA, a comprehensive fertilizer line providing both macroelements and plant nutrients.
The agricultural landscape in Russia continues to shape fertilizer demand patterns, with field crops maintaining dominance at 95% of market value share in 2022. Agricultural lands, covering 13% of Russia's vast territory, primarily support the cultivation of staple crops including wheat, sugar beet, and various cereals. The industry has witnessed substantial infrastructure development, exemplified by KuibyshevAzot's recent inauguration of a state-of-the-art facility dedicated to producing complex mineral fertilizer ammonium sulfate nitrate, significantly enhancing the country's agricultural inputs production capabilities through advanced technologies.
Application methods and delivery systems play a crucial role in the market's development, with soil application maintaining its position as the preferred method, accounting for 91.4% of market value in 2022. This dominance reflects the method's versatility across diverse crops, soil types, and environmental conditions. The industry is experiencing a gradual shift towards precision agriculture, with manufacturers developing specialized products for specific crop needs and soil conditions, leading to improved nutrient utilization efficiency and reduced environmental impact.
The horticultural sector is emerging as a significant growth driver, with projections indicating an 11.8% expansion in crop acreage through 2023-2030. This growth is driven by increasing domestic and export demand, coupled with rising private investment in greenhouse cultivation. The trend is particularly noteworthy in the specialty fertilizer segment, where manufacturers are developing products specifically designed for precision nutrient delivery in controlled environments. This shift is complemented by rising consumer affluence, which has spurred increased interest in ornamental plants and home gardening, creating new market opportunities for specialized organic fertilizer products.
Russia Fertilizers Market Trends and Insights
Russia is focusing on increasing field crop production to meet the domestic demand and ensure food security
- Field crops dominate Russia's agricultural landscape, covering 96.5% of its cultivated land. Among these, wheat, corn, soybean, and rye take center stage. Notably, in 2022, Russia witnessed a 7% expansion in its total cultivated area.
- Wheat holds a prominent position in Russia's agricultural sector, occupying 45.4% of the field crop area. Key wheat-growing regions span the North Caucasus, Black Earth, Volga, Ural, and West Siberia. The country observes two wheat-growing seasons: winter and spring. Projections for the marketing year 2022/23 indicate a record-breaking wheat production of 92.0 million metric tons (MMT), marking a 22% surge from the previous year and an 18% leap from the 5-year average. This estimate comprises 68.0 MMT of winter wheat and 24.0 MMT of spring wheat. Furthermore, the projected wheat yield stands at a record 3.17 tons per hectare (t/ha), reflecting a 17% increase from the prior year and a 12% rise from the 5-year average.
- For the marketing year 2022/23, corn production in Russia is anticipated to reach 15.8 million metric tons, marking a 13% increase from the previous month and a 4% rise from the prior year. The projected corn yield stands at a record 6.00 tons per hectare (t/ha), showcasing a 7% increase from the previous month and a 14% surge from the prior year. Russia boasts vast untapped agricultural land, and concerted efforts are underway to cultivate more of it. This push to expand arable land not only amplifies the acreage dedicated to field crops but also underscores the Russian government's commitment to bolstering agricultural production. Through measures like subsidies, grants, and favorable lending conditions, the government incentivizes farmers to expand their crop cultivation.

Understand The Key Trends Shaping This Market
Download PDF
Nitrogen is a prominent nutrient required for field crops, which is mostly consumed by rapeseed crops in the country
- Nitrogen, phosphorous, and potassium are the primary nutrients crucial for plant growth. Nitrogen and phosphorous are integral to proteins and nucleic acids, key components of plant tissues. Potassium plays a pivotal role in enhancing the quality of harvested plant products. In 2022, the average application of primary nutrients in field crops stood at 169.6 kg/hectare. Notably, Russia's major field crops encompass wheat, rapeseed, rye, soybean, and corn. The average application rates for nitrogen, phosphorous, and potassium in these crops were 227.7 kg/hectare, 125.5 kg/hectare, and 155.6 kg/hectare, respectively.
- Out of the primary nutrients, nitrogen takes the lead, with an average application rate of 227.7 kg/hectare in field crops. Nitrogenous fertilizers, when used judiciously, bolster grain quality, expedite shoot growth, and promote robust flower bud formation. Early-stage nitrogen fertilization stimulates tillering and boosts crop yields. Moreover, applying nitrogen during panicle initiation or early booting stages leads to higher grain production and weight per panicle. Rapeseed, known for its oil and protein content, exhibits a pronounced appetite for nitrogen, surpassing other field crops. In Russia, rapeseed is predominantly cultivated for vegetable oil production.
- In 2022, Russia's nutrient consumption was dominated by primary nutrients, accounting for a staggering 91.5% share, translating to a volume consumption of 7.0 million metric tons. This high consumption is attributed to the vast expanse of field crops, covering approximately 90% of the agricultural land, and their substantial nutrient demands. Consequently, the country's focus on bolstering self-sufficiency and reducing import reliance in the field crop sector may fuel the growth of the market.

Understand The Key Trends Shaping This Market
Download PDF
OTHER KEY INDUSTRY TRENDS COVERED IN THE REPORT
- Russia is aiming to reduce imports and achieve 60.0% self-sufficiency in fruits and vegetables, pushing for more cultivation
- Lower crop yield due to insufficient micronutrient levels in the agricultural soils
- Calcium is the most needed secondary nutrient, which is predominantly consumed by cotton crops
- Russia occupied a major share of the European irrigation area with 21.5% in 2023
- Zinc is the most consumed micronutrient by field crops in Russia at 33.7%
- The majorly required primary nutrient by vegetable crops in the country is nitrogen (386.2 kg/hectare)
- Magnesium is the dominant secondary nutrient in vegetable crops, majorly used by onion crops (64.4 kg/ha)
Segment Analysis: Type
Straight Fertilizers Segment in Russian Fertilizers Market
Straight fertilizers maintain their dominance in the Russian fertilizers market, commanding approximately 77% of the total market share in 2024. This segment's prominence can be attributed to its effectiveness in addressing specific nutrient deficiencies without compromising other nutrients. The segment's strong position is further reinforced by its cost advantage, with straight fertilizers being priced at around USD 654 per metric ton compared to compound fertilizers. Within the straight fertilizers category, nitrogenous fertilizers emerge as the leading sub-segment, accounting for nearly 78% of the straight fertilizers market volume, followed by phosphatic and potassic fertilizers. The segment's success is primarily driven by its widespread availability across the country and the flexibility it offers farmers in customizing nutrient applications based on specific crop requirements and soil conditions.
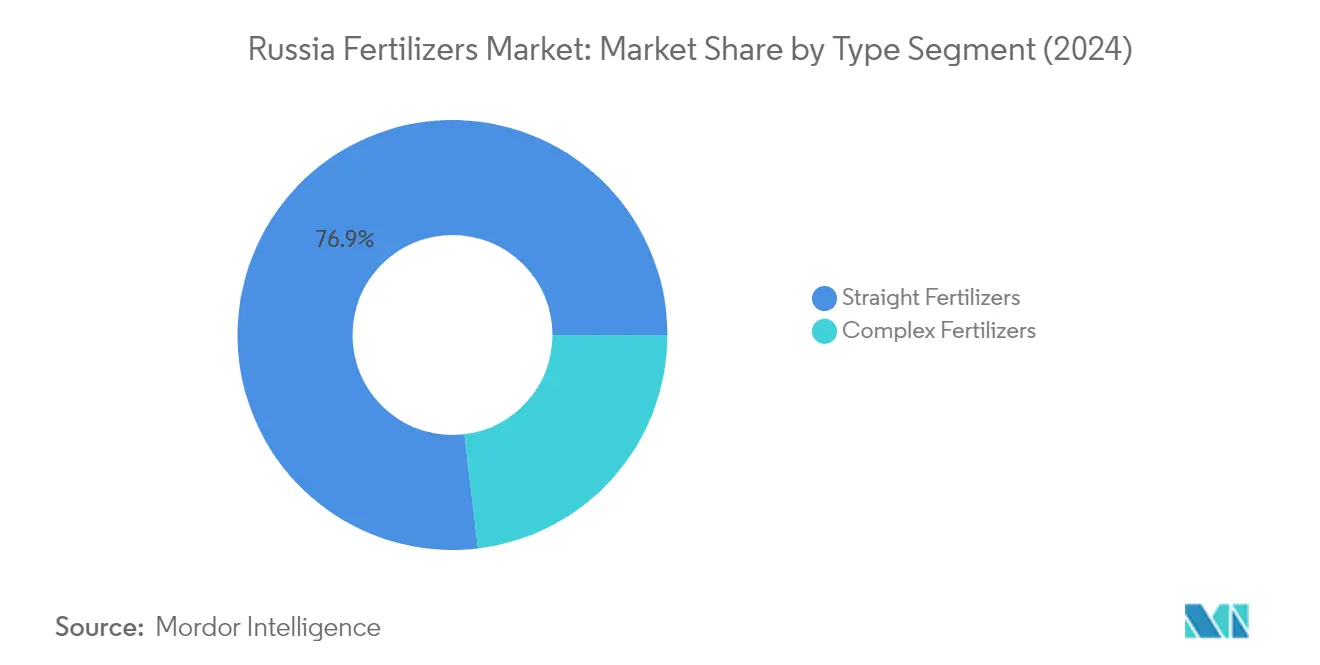
Complex Fertilizers Segment in Russian Fertilizers Market
Complex fertilizers are experiencing robust growth in the Russian fertilizers market, with an expected growth rate of approximately 5% during 2024-2029. This accelerated growth is driven by the segment's ability to provide balanced nutrient supply for diverse crops in a single application. Despite having higher production costs than straight fertilizers, complex fertilizers prove more economical in terms of delivery, storage, and application, with overall application costs approximately 10% lower than straight fertilizers when factoring in production expenses. The segment's growth is further propelled by the rising demand for primary nutrients in major crops and the effectiveness of complex fertilizers in maintaining soil fertility balance. The conventional application method dominates the complex fertilizer segment, particularly due to its enhanced nutrient availability to the root system and the uniform distribution of multiple nutrients in a single granule on the soil surface.
Segment Analysis: Form
Conventional Segment in Russian Fertilizers Market
The conventional fertilizers segment maintains its dominant position in the Russian fertilizers market, commanding approximately 89% market share in 2024. This substantial market presence can be attributed to several factors, including their lower cost structure and widespread availability across the country. The segment's strength is particularly evident in field crops, which represent the largest application area. Conventional fertilizers are preferred by farmers due to their cost-effectiveness, with average prices significantly lower than specialty alternatives. The segment's dominance is further reinforced by Russia's extensive agricultural landscape and the established distribution networks that facilitate easy access to these products for farmers across the nation.
Specialty Segment in Russian Fertilizers Market
The specialty fertilizers segment is emerging as the fastest-growing category in the Russian fertilizers market, projected to grow at approximately 7% during 2024-2029. This accelerated growth is driven by increasing adoption of precision agriculture techniques and growing awareness about environmental sustainability. The segment's expansion is particularly notable in high-value crops and protected cultivation, where the need for precise nutrient management is crucial. Water-soluble fertilizers and controlled-release products are gaining significant traction, especially in regions with advanced irrigation infrastructure. The growth is further supported by rising demand for enhanced efficiency fertilizers that minimize nutrient losses and optimize crop yields.
Segment Analysis: Application Mode
Soil Application Segment in Russia Fertilizers Market
Soil application continues to be the predominant method of fertilizer application in Russia, commanding approximately 91% of the market value in 2024. This dominance stems from its versatility across diverse crops, soil types, and environmental conditions. The method's widespread adoption is driven by its effectiveness in delivering nutrients directly to the root zone, ensuring optimal nutrient uptake by plants. Soil application encompasses various techniques including broadcasting, placement, and localized application, making it adaptable to different farming scenarios. The segment's strength is further reinforced by its compatibility with both conventional and specialty fertilizers, along with its cost-effectiveness and ease of implementation across large agricultural operations. Russian farmers particularly favor this method for field crops, which constitute the majority of the country's agricultural production.
Fertigation Segment in Russia Fertilizers Market
The fertigation segment is emerging as the most dynamic sector in the Russian fertilizers market, demonstrating robust growth potential. This method's rising popularity can be attributed to its superior efficiency in nutrient delivery, as it combines irrigation and fertilization into a single operation. Fertigation allows for precise control over nutrient distribution, significantly reducing chemical fertilizer wastage while ensuring optimal nutrient availability to crops. The method is particularly gaining traction in modern agricultural operations, especially in greenhouse cultivation and high-value crop production. The adoption of micro-irrigation systems across Russia has been a key driver, with over 36% of irrigated land now equipped with these advanced systems. Farmers are increasingly recognizing fertigation's benefits in terms of water conservation, reduced labor costs, and improved nutrient use efficiency.
Remaining Segments in Application Mode
The foliar application method represents another significant segment in the Russian fertilizers market, offering unique advantages in specific agricultural scenarios. This method is particularly valued for its ability to address immediate nutrient deficiencies and provide rapid nutrient absorption through plant leaves. Foliar application is especially beneficial for micronutrient delivery and during critical growth stages when quick nutrient uptake is essential. The method has gained particular importance in horticultural crops and high-value agricultural production, where precise nutrient management is crucial for crop quality and yield. Its effectiveness in delivering specialty fertilizers and its role in integrated nutrient management strategies continue to make it an important component of modern agricultural practices in Russia.
Competitive Landscape
Top Companies in Russia Fertilizers Market
The Russian fertilizers market is led by established players, including PhosAgro Group, EuroChem Group, KuibyshevAzot PJSC, MINUDOBRENIYA JSC, and Yara International ASA. The industry has witnessed significant product innovation trends, particularly in developing environmentally friendly fertilizers and specialty nutrient solutions. Companies are increasingly focusing on technological advancements in controlled-release formulations and water-soluble products to meet evolving farmer needs. Operational agility has become paramount, with manufacturers investing in modernizing production facilities and optimizing supply chain networks. Strategic moves in the sector predominantly revolve around vertical integration, from raw material sourcing to distribution networks. Market leaders are expanding their presence through new production facilities, distribution centers, and strategic partnerships, while simultaneously investing in research and development to maintain competitive advantages.
Market Dominated by Integrated Domestic Players
The Russian fertilizers market exhibits a relatively concentrated structure, with domestic manufacturers holding dominant positions. These local players benefit from access to abundant raw materials, established distribution networks, and a deep understanding of regional agricultural needs. The market is characterized by vertically integrated companies that control the entire value chain from mining operations to end-product distribution. This integration allows major players to maintain cost advantages and ensure reliable supply to customers. The competitive landscape is further shaped by strong government support for domestic producers, creating high entry barriers for international players.
The industry has experienced limited merger and acquisition activity, with companies instead focusing on organic growth and capacity expansion. Major players have established themselves as specialists in specific nutrient categories while maintaining diversified product portfolios. The market structure favors large-scale operators who can leverage economies of scale, maintain extensive distribution networks, and invest in research and development. Competition primarily revolves around product quality, price competitiveness, and the ability to provide comprehensive agronomic solutions to farmers.
Innovation and Sustainability Drive Future Success
Success in the Russian fertilizers market increasingly depends on companies' ability to innovate and adapt to changing agricultural practices. Market leaders are investing heavily in developing specialty fertilizer products, improving nutrient efficiency, and reducing environmental impact. The ability to provide customized solutions for different crop types and soil conditions has become a crucial differentiator. Companies are also focusing on digital solutions and precision agriculture technologies to enhance their value proposition. Building strong relationships with agricultural enterprises and providing comprehensive agronomic support services has become essential for maintaining market position.
For new entrants and smaller players, success lies in identifying and serving niche market segments with specialized products. Companies must navigate regulatory requirements related to environmental protection and sustainable agriculture practices. The development of strong distribution networks and technical support capabilities is crucial for market expansion. Future growth opportunities exist in developing bio-based fertilizers and products that improve nutrient use efficiency. Companies must also consider potential shifts in agricultural practices, climate change impacts, and evolving farmer preferences while formulating their long-term strategies.
Russia Fertilizers Industry Leaders
-
EuroChem Group
-
KuibyshevAzot PJSC
-
MINUDOBRENIYA JSC
-
PhosAgro Group of Companies
-
Yara International ASA
- *Disclaimer: Major Players sorted in no particular order

Need More Details on Market Players and Competitors?
Download PDF
Recent Industry Developments
- January 2023: ICL has entered into a strategic partnership agreement with General Mills, in which it will be the supplier of strategic specialty phosphate solutions to General Mills. The long-term agreement will also focus on international expansion.
- May 2022: ICL has launched three new NPK formulations of Solinure, a product with increased trace elements to optimise yields
- May 2022: ICL signed an agreement with customers in India and China to supply 600,000 and 700,000 metric tons of potash, respectively, in 2022 at USD 590 per ton.
Russia Fertilizers Market Report Scope
Complex, Straight are covered as segments by Type. Conventional, Speciality are covered as segments by Form. Fertigation, Foliar, Soil are covered as segments by Application Mode. Field Crops, Horticultural Crops, Turf & Ornamental are covered as segments by Crop Type.
Type
| Complex | ||
| Straight | Micronutrients | Boron |
| Copper | ||
| Iron | ||
| Manganese | ||
| Molybdenum | ||
| Zinc | ||
| Others | ||
| Nitrogenous | Ammonium Nitrate | |
| Urea | ||
| Others | ||
| Phosphatic | DAP | |
| MAP | ||
| Others | ||
| Potassic | MoP | |
| SoP | ||
| Others | ||
| Secondary Macronutrients | Calcium | |
| Magnesium | ||
| Sulfur | ||
Form
| Conventional | |
| Specialty | CRF |
| Liquid Fertilizer | |
| SRF | |
| Water Soluble |
Application Mode
| Fertigation |
| Foliar |
| Soil |
Crop Type
| Field Crops |
| Horticultural Crops |
| Turf & Ornamental |
| Type | Complex | ||
| Straight | Micronutrients | Boron | |
| Copper | |||
| Iron | |||
| Manganese | |||
| Molybdenum | |||
| Zinc | |||
| Others | |||
| Nitrogenous | Ammonium Nitrate | ||
| Urea | |||
| Others | |||
| Phosphatic | DAP | ||
| MAP | |||
| Others | |||
| Potassic | MoP | ||
| SoP | |||
| Others | |||
| Secondary Macronutrients | Calcium | ||
| Magnesium | |||
| Sulfur | |||
| Form | Conventional | ||
| Specialty | CRF | ||
| Liquid Fertilizer | |||
| SRF | |||
| Water Soluble | |||
| Application Mode | Fertigation | ||
| Foliar | |||
| Soil | |||
| Crop Type | Field Crops | ||
| Horticultural Crops | |||
| Turf & Ornamental | |||
Need A Different Region or Segment?
Customize Now
Market Definition
- MARKET ESTIMATION LEVEL - Market Estimations for various types of fertilizers has been done at the product-level and not at the nutrient-level.
- NUTRIENT TYPES COVERED - Primary Nutrients: N, P and K, Secondary Macronutrients: Ca, Mg and S, Micronutients: Zn, Mn, Cu, Fe, Mo, B, and Others
- AVERAGE NUTRIENT APPLICATION RATE - This refers to the average volume of nutrient consumed per hectare of farmland in each country.
- CROP TYPES COVERED - Field Crops: Cereals, Pulses, Oilseeds, and Fiber Crops Horticulture: Fruits, Vegetables, Plantation Crops and Spices, Turf Grass and Ornamentals
| Keyword | Definition |
|---|---|
| Fertilizer | Chemical substance applied to crops to ensure nutritional requirements, available in various forms such as granules, powders, liquid, water soluble, etc. |
| Specialty Fertilizer | Used for enhanced efficiency and nutrient availability applied through soil, foliar, and fertigation. Includes CRF, SRF, liquid fertilizer, and water soluble fertilizers. |
| Controlled-Release Fertilizers (CRF) | Coated with materials such as polymer, polymer-sulfur, and other materials such as resins to ensure nutrient availability to the crop for its entire life cycle. |
| Slow-Release Fertilizers (SRF) | Coated with materials such as sulfur, neem, etc., to ensure nutrient availability to the crop for a longer period. |
| Foliar Fertilizers | Consist of both liquid and water soluble fertilizers applied through foliar application. |
| Water-Soluble Fertilizers | Available in various forms including liquid, powder, etc., used in foliar and fertigation mode of fertilizer application. |
| Fertigation | Fertilizers applied through different irrigation systems such as drip irrigation, micro irrigation, sprinkler irrigation, etc. |
| Anhydrous Ammonia | Used as fertilizer, directly injected into the soil, available in gaseous liquid form. |
| Single Super Phosphate (SSP) | Phosphorus fertilizer containing only phosphorus which has lesser than or equal to 35%. |
| Triple Super Phosphate (TSP) | Phosphorus fertilizer containing only phosphorus greater than 35%. |
| Enhanced Efficiency Fertilizers | Fertilizers coated or treated with additional layers of various ingredients to make it more efficient compared to other fertilizers. |
| Conventional Fertilizer | Fertilizers applied to crops through traditional methods including broadcasting, row placement, ploughing soil placement, etc. |
| Chelated Micronutrients | Micronutrient fertilizers coated with chelating agents such as EDTA, EDDHA, DTPA, HEDTA, etc. |
| Liquid Fertilizers | Available in liquid form, majorly used for application of fertilizers to crops through foliar and fertigation. |
Need More Details on Market Definition?
Ask a Question
Research Methodology
Mordor Intelligence follows a four-step methodology in all our reports.
- Step-1: IDENTIFY KEY VARIABLES: In order to build a robust forecasting methodology, the variables and factors identified in Step-1 are tested against available historical market numbers. Through an iterative process, the variables required for market forecast are set and the model is built on the basis of these variables.
- Step-2: Build a Market Model: Market-size estimations for the forecast years are in nominal terms. Inflation is not a part of the pricing, and the average selling price (ASP) is kept constant throughout the forecast period for each country.
- Step-3: Validate and Finalize: In this important step, all market numbers, variables and analyst calls are validated through an extensive network of primary research experts from the market studied. The respondents are selected across levels and functions to generate a holistic picture of the market studied.
- Step-4: Research Outputs: Syndicated Reports, Custom Consulting Assignments, Databases & Subscription Platforms

Get More Details On Research Methodology
Download PDF


