
Market Overview
| Study Period | 2020 - 2031 |
|---|---|
| Forecast Data Period | 2026 - 2031 |
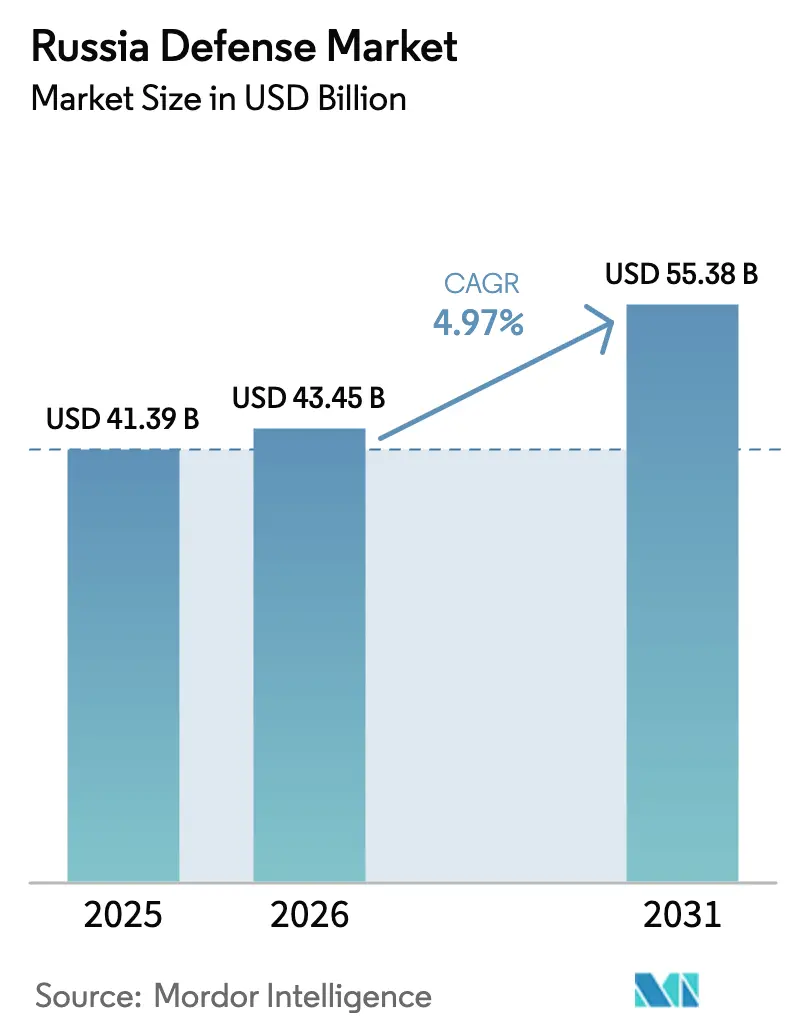
| Base Year Market Size (2025) | USD 41.39 Billion |
| Market Size (2026) | USD 43.45 Billion |
| Market Size (2031) | USD 55.38 Billion |
| Growth Rate (2026 - 2031) | 4.97 % |
| Market Concentration | High |
Major Players *Disclaimer: Major Players sorted in no particular order Image © Mordor Intelligence. Reuse requires attribution under CC BY 4.0. | |
Russia Defense Market Analysis by Mordor Intelligence
The Russia defense market size was valued at USD 41.39 billion in 2025 and estimated to grow from USD 43.45 billion in 2026 to reach USD 55.38 billion by 2031, at a CAGR of 4.97% during the forecast period (2026-2031). Combat losses in Ukraine, Western sanctions, and an ambitious 13.5 trillion ruble defense budget for 2025 (USD 145 billion) combine to drive a mobilization economy that prioritizes output volume over platform novelty. Ammunition production targets have tripled, air-defense deployments now ring core industrial zones, and state conglomerates redirect resources from exports to domestic re-armament. Simultaneously, a 300,000-person labor gap, double-digit inflation, and restricted access to advanced semiconductors erode purchasing power and slow innovation. Strategic opportunities nevertheless exist in unmanned combat systems, counter-drone technologies, and modular armor kits as commanders seek affordable precision effects at scale.
Key Report Takeaways
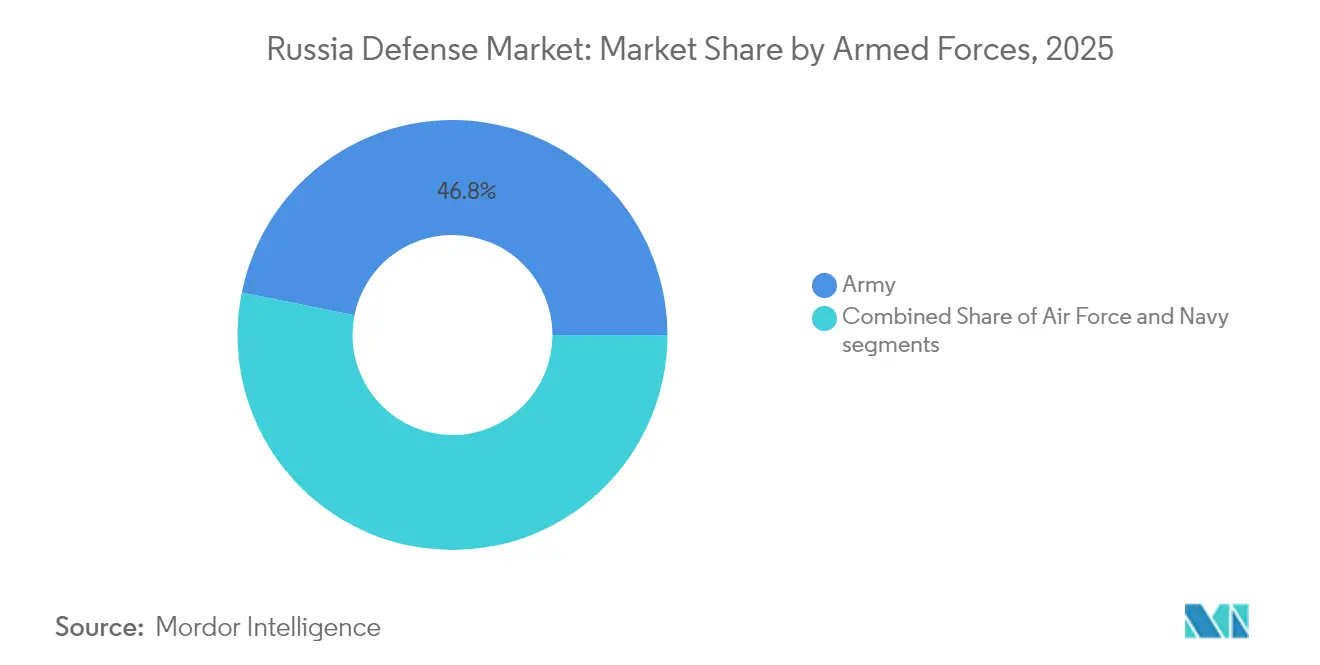
- By armed forces, the Army captured 46.83% of Russia defense market share in 2025, while the air force segment is advancing at a 6.49% CAGR through 2031.
- By type, weapons and ammunition led with 29.85% share of the Russia defense market size in 2025, while the unmanned systems segment is projected to expand at a 7.18% CAGR to 2031.
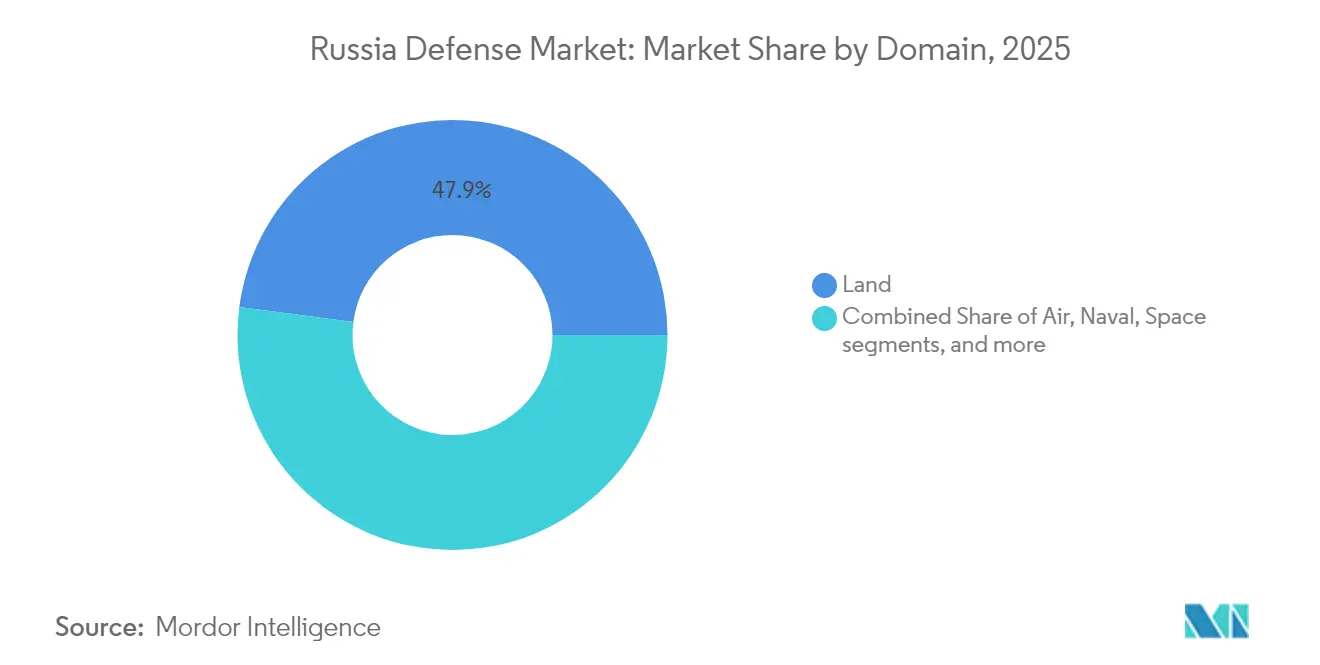
- By domain, the land segment accounted for 47.92% of Russia defense market size in 2025, and the air domain is growing fastest at a 6.02% CAGR.
- By procurement nature, indigenous production dominated the Russia defense market with a 78.15% share in 2025 and is forecasted to grow at a 5.66% CAGR.
Note: Market size and forecast figures in this report are generated using Mordor Intelligence’s proprietary estimation framework, updated with the latest available data and insights as of 2026.
Russia Defense Market Trends and Insights
Drivers Impact Analysis*
| Driver | (~) % Impact on CAGR Forecast | Geographic Relevance | Impact Timeline |
|---|---|---|---|
| Accelerated ammunition and munitions replenishment requirements | +1.8% | Urals industrial belt (Sverdlovsk, Chelyabinsk, Perm oblasts) | Short term (≤ 2 years) |
| Rising investment in integrated air and missile defense systems | +1.2% | Moscow, St. Petersburg, Crimea, Kaliningrad | Medium term (2-4 years) |
| Rapid recapitalization of ground combat platforms | +1.0% | Nizhny Tagil, Omsk, Kurgan armored-vehicle plants | Short term (≤ 2 years) |
| State-led defense industrial mobilization and capacity expansion | +1.5% | Tatarstan, Nizhny Novgorod, Rostov-on-Don | Medium term (2-4 years) |
| Import substitution and domesticization of critical defense components | +0.8% | Moscow, St. Petersburg design bureaus, Urals facilities | Long term (≥ 4 years) |
| Increased adoption of cost-effective unmanned and loitering munition systems | +0.9% | Donbas and southern Ukraine operational zones | Short term (≤ 2 years) |
| Source: Mordor Intelligence | |||
Accelerated Ammunition and Munitions Replenishment Requirements
Artillery-centric combat has driven shell demand from an estimated 10 million rounds fired in 2022–2023 to annual production goals nearing 4 million rounds by 2026. Factories in Sverdlovsk and Chelyabinsk now run three shifts and reactivated Soviet-era lines to supply Grad rockets, mortar bombs, and anti-tank guided missiles (ATGMs). Quality control cycles are shorter, resulting in higher dud rates, yet commanders accept this trade-off to maintain volume. Tactical Missiles Corporation boosts Kalibr cruise-missile output despite turbofan shortages, while Urals plants focus on 152-millimeter shells. The ammunition surge remains central to offensive doctrine, underpinning the Russia defense market’s near-term growth trajectory.
Rising Investment In Integrated Air and Missile Defense Systems
UAV strikes on refineries and airbases more than 1,000 kilometers from the front have elevated domestic air defense to an existential priority. Almaz-Antey fielded the first S-500 batteries around Moscow in 2024, complementing 60 operational S-400 battalions. Resources originally earmarked for exports are redirected to reinforce St. Petersburg, Crimea, and Kaliningrad. Electronic-warfare (EW) assets such as Murmansk-BN and Krasukha-4 form outer layers that jam communications and airborne radars.[1] Counter-drone procurement lags, however, leaving gaps filled by improvised RF jammers and shotgun teams. Together, these programs fuel the Russia defense market as air-space security becomes a budget imperative.
State-Led Defense Industrial Mobilization and Capacity Expansion
The Kremlin condensed a decade of modernization into two years by mandating wartime operating tempos across strategic plants. Uralvagonzavod increased T-90M tank production to over 200 units in 2024 by utilizing simplified assembly lines. United Shipbuilding Corporation launched the Yasen-M submarine Perm in March 2025, maintaining a pace of one boat every 18 months despite sanctions on precision machinery. Russian Helicopters sustained Ka-52M and Mi-28NM deliveries by cannibalizing export lots. Second-tier suppliers, such as Shvabe, scaled thermal sights, and RTI Systems, doubled the production of radar components. This surge redirects engineers from civil programs, yet it anchors the Russia defense market over the medium term.
Increased Adoption Of Cost-Effective Unmanned And Loitering Munition Systems
Low-cost precision platforms now deliver effects once reserved for manned aviation. Zala Aero’s Lancet loitering munition costs about USD 35,000 yet neutralizes howitzers worth millions. Geran-2 one-way attack drones, reverse-engineered from Iranian designs, achieve a monthly production rate of over 1,000 units. Kronstadt’s Orion MALE UAV entered full-rate output in 2024, offering persistent ISR without pilot risk. Early operator training deficits led to high attrition in 2022; however, dedicated UAV battalions and encrypted data links have since improved sortie rates. These developments expand the Russia defense market by combining affordability with sustained lethality.
Restraints Impact Analysis*
| Restraint | (~) % Impact on CAGR Forecast | Geographic Relevance | Impact Timeline |
|---|---|---|---|
| Skilled labor and engineering talent constraints in defense manufacturing | -0.7% | Moscow, St. Petersburg design bureaus, Urals plants | Medium term (2-4 years) |
| Supply chain disruptions in advanced electronics and micro-components | -0.9% | Nationwide dependence on Chinese imports | Long term (≥ 4 years) |
| Fiscal pressures affecting long-term defense capital expenditure | -0.6% | National budget-allocation tensions | Medium term (2-4 years) |
| Modernization limitations linked to legacy platform dependence | -0.5% | Urals tank plants, Severodvinsk shipyards, legacy aircraft works | Long term (≥ 4 years) |
| Source: Mordor Intelligence | |||
Skilled Labor and Engineering Talent Constraints In Defense Manufacturing
Defense firms advertised more than 300,000 vacancies by mid-2024, covering CNC machinists, avionics technicians, and software engineers. Mobilization drafted many specialists, leaving design bureaus operating at 60-70% capacity. Salary hikes of 30% merely reshuffled scarce talent regionally. Vocational schools require up to three years to produce competent technicians, which is often misaligned with near-term production spikes. The emigration of IT professionals further drains expertise, while older Soviet-trained staff stay beyond retirement, creating knowledge-transfer bottlenecks that cap Russia's defense market efficiency.
Supply Chain Disruptions In Advanced Electronics and Micro-Components
Export controls eliminated Western semiconductors and precision machine tools, pushing Russian firms toward Chinese parts that add cost and uncertainty.[2] Domestic foundries cannot produce chips below 28 nanometers, limiting the performance of fire-control computers and avionics. Thermal imagers once sourced from Thales are now relying on lower-resolution domestic alternatives, while gaps in machine tools slow down turbine blade fabrication. Programs such as Zircon and Su-57 face recurring delays and design compromises. These shortages impose a structural drag on the Russia defense market outlook beyond 2028.
*Our forecasts treat driver/restraint impacts as directional, not additive. The impact forecasts reflect baseline growth, mix effects, and variable interactions.
Segment Analysis
By Armed Forces: Army Dominance Masks Air Force Acceleration
The Army retained 46.83% of 2025 spending within the Russia defense market and continues to absorb the bulk of ammunition, armor, and field-repair budgets. Air Force allocations, although smaller, are increasing at a 6.49% CAGR as helicopter losses spur the procurement of Ka-52M and Mi-28NM, and Su-34M deliveries refresh strike capacity. Naval programs advance more slowly due to complex shipyard cycles and propulsion bottlenecks, despite the Arkhangelsk submarine's entry into service in 2024.
Ground forces dominate the Russia defense market in terms of consumables, logistics vehicles, and in-theater electronics. Meanwhile, the Air Force maintains strategic relevance by integrating layered S-500 defenses and sustaining frontline fighter aviation. Navy budgets hinge on Sevmash's ability to maintain a nuclear-submarine production line and Zelenodolsk's frigate output, both of which are sensitive to turbine supplies. Together, these patterns reveal a posture optimized for land warfare yet increasingly aware that air control multiplies ground effectiveness.

By Type: Unmanned Systems Surge Reshapes Procurement Mix
Weapons and ammunition held 29.85% of the Russia defense market share in 2025, buoyed by 1.3 million shells produced and plans to triple capacity. Unmanned systems drive growth at a 7.18% CAGR, as the Lancet and Geran-2 platforms deliver precision at economies of scale unattainable with cruise missiles. Vehicles, notably the T-90M tanks, maintain a steady output of over 200 units per year. C4ISR and electronic-warfare demand rise in parallel; Murmansk-BN systems now create theater-wide denial bubbles, while Krasukha-4 jammers shield key infrastructure.
Persistent shortfalls in night-vision sensors and secure communications underscore the limits of import substitution. Nonetheless, UAV integration at the battalion level, plus Orion MALE UAVs providing theater surveillance, cements unmanned systems as a structural pillar of the Russia defense market.
By Domain: Land Primacy Gives Way To Air Defense Urgency
Land operations consumed 47.92% of the 2025 value, mirroring artillery exchanges and armored thrusts along the 1,000-kilometer front. Air spending outpaces all other domains at a 6.02% CAGR, driven by S-400 redeployments, S-500 rollouts, and rotary-wing fleet renewal. Naval allocations rise modestly as Yasen-M submarines maintain a steady drumbeat, while lower-cost corvette programs encounter engine delays.
Air domain ascendance within the Russia defense market reflects not only the defense of strategic cities but also a broader doctrine favoring standoff strikes that conserve high-value aircraft. Land budgets are pivoting toward counter-battery radars and modular armor, rather than new tank lines, illustrating a shift from massed steel to survivability.
By Procurement Nature: Indigenous Production Dominates Amid Import Substitution
Indigenous production accounted for 78.15% of spending in 2025 and is set to grow at a 5.66% CAGR, reflecting necessity as much as strategy. Import channels for avionics, sensors, and propulsion were collapsed, redirecting billions of dollars to domestic supply chains. Success stories include Shvabe’s thermal sights and United Engine Corporation’s AL-31F turbofans. Yet, 90% of defense electronics still trace back to Chinese intermediaries, underlining future risks.
Foreign procurement remains limited to components that are unavailable domestically, often necessitating longer lead times and higher costs. The Russia defense market thus grows around entrenched verticals, such as armor, artillery, and helicopters, while advanced subsystems remain hostage to external dependencies.
Geography Analysis
Russia consolidates defense production across three Soviet-era corridors. The Urals belt dominates in ammunition and armor: Uralvagonzavod in Nizhny Tagil builds over 200 T-90M tanks annually, and Sverdlovsk plants target 4 million shells annually. The Volga cluster hosts Kazan Aviation Plant, which assembles Tu-160M bombers, and Sokol Aircraft Plant, which overhauls Su-34 fighters.
Northwest yards drive naval power. Sevmash in Severodvinsk launched the Yasen-M submarine Perm in March 2025 and commissioned Arkhangelsk in December 2024. Admiralty Shipyards in St. Petersburg builds Lada-class submarines, while Kaliningrad’s Zelenodolsk yard manages Project 22350 frigates, though propulsion shortages stretch timelines.
Far Eastern Komsomolsk-on-Amur produces Su-35 and Su-57 fighters for Pacific aviation, leveraging its proximity to Asian supply routes. However, the distance from European suppliers raises logistics costs. Rostov-on-Don’s Rostvertol plant completes Mi-28NM helicopters, but labor shortages across Moscow and Saint Petersburg compel overtime and rehiring of retirees. The dispersion safeguards assets from border threats yet complicates supply chain coordination within the Russia defense market.
Regulatory Landscape
Russia's defense procurement and industrial policy are centralized through state mechanisms led by the Military-Industrial Commission (VPK), which coordinates priorities across ministries and state holding companies that dominate the supply base. The state defense order is governed by Federal Law No. 213-FZ, which sets rules for forming, allocating, and financing procurement. The State Armament Programme (GPV) remains the primary multi-year planning vehicle, with a new cycle referenced for 2025-2034.
Industrial participation is managed through licensing and supervision. The Ministry of Industry and Trade of the Russian Federation serves as the key licensing body for the development, production, testing, repair, and disposal of arms and military equipment. In practice, these frameworks reinforce a mobilization procurement model in which domestic capacity expansion, repair throughput, and import-substitution compliance take priority over competitive tendering, aligning funding and production decisions across entities such as United Aircraft Corporation, United Shipbuilding Corporation, and Almaz-Antey.
Value Chain Analysis
Russia's defense value chain is structured around state-directed prime contractors (for example, United Aircraft Corporation, United Shipbuilding Corporation, Almaz-Antey, and Russian Helicopters), supported by dense and geographically distributed tiers of component and materials suppliers. Mapping of the military-industrial complex highlights 692 geographic clusters, with 113 clusters concentrating the bulk of activity (82% of cargo flows and 92% of procurement contracts). This concentration points to the role of inter-regional logistics in maintaining execution continuity despite disruption risk.
Upstream inputs span metals, energetics, propulsion materials, and electronics, while midstream activities focus on assembly, integration, and modernization at Soviet-era plant corridors (Urals for armor and ammunition, Northwest for shipbuilding, and aviation centers in European Russia and the Far East). Logistics and transshipment nodes such as Elektrougli support high-volume container handling between rail and road, which helps move subassemblies and finished goods to integration sites and depots. Downstream, the state defense order drives delivery schedules and sustainment workloads (repair, overhaul, and refurbishment). At the same time, sanctions and constrained access to advanced semiconductors have increased reliance on non-Western sourcing for select electronic components, alongside ongoing import-substitution and industrial digitalization initiatives, including within ship equipment supply chains.
Competitive Landscape
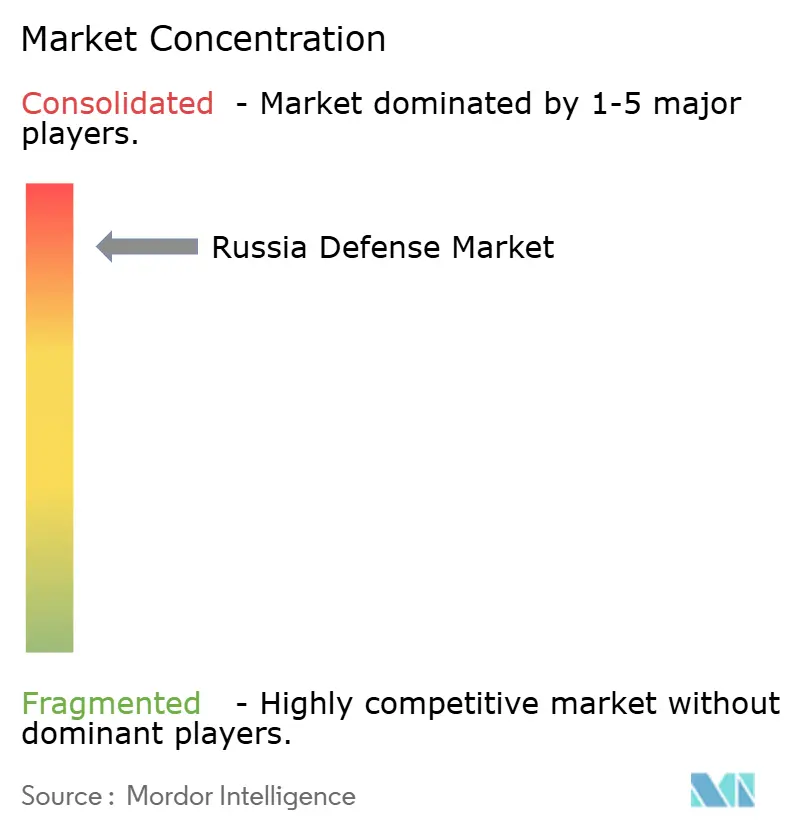
Almaz-Antey Air and Space Defence Corporation, United Aircraft Corporation, United Shipbuilding Corporation, 'Russian Helicopters' JSC, and Kalashnikov Concern JSC control a significant share of production, confirming a highly concentrated Russian defense market. United Shipbuilding Corporation monopolizes naval construction, and United Engine Corporation anchors propulsion.
Strategic emphasis favors proven designs over R&D: Uralvagonzavod scales T-90M throughput instead of fielding the T-14 Armata; Tactical Missiles Corporation extends Kalibr serial runs rather than fast-tracking next-gen hypersonics. Niche firms such as Kronstadt Group thrive by supplying Orion and Sirius UAVs free of foreign intellectual property, while Shvabe accelerates domestic optics to replace sanctioned imports.
Patent filings and lab budgets declined after 2022 as resources channeled into volume production. Testing cycles are shortened, risking quality lapses, yet Kremlin oversight ensures funding continuity. The Russia defense industry thus functions less as a competitive arena and more as a mobilization enterprise that prizes scale, vertical integration, and resilience to sanctions.
Russia Defense Industry Leaders
-
Almaz-Antey Air and Space Defence Corporation
-
United Aircraft Corporation
-
United Shipbuilding Corporation
-
Kalashnikov Concern JSC
-
'Russian Helicopters' JSC
- *Disclaimer: Major Players sorted in no particular order
Market Opportunities and Future Outlook
Near-term opportunity areas inside Russia's defense procurement mix concentrate on scaling production and sustainment in segments where operational demand and industrial mobilization are already visible, including air and missile defense, aircraft modernization, unmanned systems, and repair-and-overhaul capacity. This focus is supported by ongoing 2026 state procurement deliveries by United Aircraft Corporation (Su-30SM2, Su-34, and Su-35S) and product-push activity around naval air defense. Almaz-Antey, for example, has been marketing shipborne systems such as Resurs, Rif-M, and Shtil-1 at the Fleet 2026 naval show (June 2026). With the market’s high indigenous production share of 78.15% in 2025, domestic suppliers have room to support the supply base with subcomponents, test equipment, and integration services that fit import-substituted architectures.
Shipbuilding and fleet sustainment also follow a program-backed modernization pathway through yard upgrades and production-system investments. United Shipbuilding Corporation’s role as the dominant naval prime contractor, along with its publicly cited shipyard modernization actions, including the full rebuilding of Severnaya Verf (as of June 2026), supports opportunities around ship equipment localization, industrial tooling, and production digitalization that can improve throughput and reduce schedule slippage under sanctions constraints. Across the supply network, the most bankable whitespace remains in components and subsystems that address bottlenecks already highlighted in the market narrative, such as electronics packaging, rugged communications, night-vision and thermal-imaging supply, and high-tempo depot maintenance that keeps legacy platforms combat-ready while primes prioritize volume output.
Recent Industry Developments
- June 2026: United Shipbuilding Corporation delivered approximately 50 ships in 2025, meeting state defense order requirements, including four submarines and the combat icebreaker Ivan Papanin. The launch strengthens domestic shipbuilding capacity and reinforces the mobilization oriented defense supply chain. The milestone signals greater execution scale within Russia's naval production ecosystem.
- June 2026: United Aircraft Corporation announced on June 4 that it contracted 11 import-substituted Tu-214 aircraft for commercial operators. The deal expands domestic aviation capacity and reduces dependence on foreign designs for civilian operators. It underscores a broader shift toward localization in Russia's civil aircraft sector.
- June 2026: United Aircraft Corporation announced that CEO Vadim Badekha stated on June 2 that a contract for the supply of Il-114-300 regional jets for Aurora airline is in final preparation and expected to be concluded in the coming months. The potential agreement accelerates regional connectivity and supports domestic fleet renewal in the civil aviation market. The development reflects ongoing efforts to diversify Russia's regional air transport capabilities.
Research Methodology Framework and Report Scope
Market Definition and Coverage
This market covers Russia's spending and procurement value for defense equipment and related programs that support the armed forces, captured as annual revenue value in USD across the country.
Scope exclusions: Civil aerospace and non-military security spending (such as policing and general public safety) are excluded from this market sizing.
Segmentation Overview
- By Armed Forces
- Air Force
- Army
- Navy
- By Type
- Personnel Training and Protection
- C4ISR and Electronic Warfare (EW)
- Vehicles
- Weapons and Ammunition
- Unmanned Systems
- Space and Cyber Systems
- By Domain
- Land
- Air
- Naval
- Space
- Cyber and Electromagnetic Spectrum
- By Procurement Nature
- Indigenous Production
- Foreign Procurement
Data Sources, Market Sizing, and Validation
Desk Research
Desk work starts with the most traceable public records that explain Russia's defense demand pool and budget signals over time. We relied on sources such as SIPRI (Stockholm International Peace Research Institute) for military expenditure trends, Russian federal budget releases and explanatory notes published through official portals, and macro series from multilateral bodies such as the World Bank that affect affordability (inflation, FX, and GDP trends).
To connect spending intent with procurement reality, we also reviewed official defense ministry and state procurement communications where available, trade and customs summaries for relevant defense-linked materials, and patent databases that help track activity in priority technology areas. Company filings, bond disclosures, and investor materials were used when they added program-level context, followed by reputable press reporting that clarifies timelines and delivery emphasis. Some data points were cross-checked using paid subscriptions focused on company financials and intelligence, news and financials, patent lookups, and global contracts and tenders. These examples are not exhaustive, and many other sources were consulted for data collection, validation, and clarification.
Primary Interviews and Surveys
Interviews and surveys with procurement, production, engineering, and finance specialists in Russia clarify order timing, equipment replacement, local output, and imported content. Their input helps assess gaps in classified data and test whether desk-based assumptions align with procurement and production conditions inside Russia before sign-off.
Distribution of primary research fieldwork respondents
| Company type | Respondent position |
|---|---|
| Top tier: 30% | CXOs: 15% |
| Mid tier: 45% | Functional/Unit leaders: 30% |
| Smaller Players: 25% | Managers: 55% |
Market-Sizing & Forecasting
Sizing begins with a top-down build where defense budget intent and procurement allocations are reconstructed into an addressable equipment and program value pool, then mapped to the armed forces demand areas covered in the study. Where the public record is incomplete, the missing pieces are filled through interview-led share splits and cross-checks against observable program activity, which is then carried through in a consistent set of assumptions.
To keep the model grounded, we used inputs that can be tracked and refreshed, such as national defense budget levels, procurement share trends, ruble to USD conversion timing, inflation and cost escalation patterns, and indicators of production throughput and delivery pacing for key equipment groups. Platform repair and replacement urgency, sanctions-driven import substitution progress, and the shift toward ammunition and air defense intensity were treated as practical demand signals that shape mix and average pricing.
For forecasting, scenario analysis was used with a base case anchored to expected budget plans and production constraints, then adjusted using expert feedback on execution risk. Bottom-up approximations were used selectively, such as sampled program value checks, volume-by-category logic with indicative unit prices, and supplier and channel checks that help validate whether totals are directionally feasible. When gaps remain, conservative ranges are applied first, followed by a review to avoid double counting across procurement nature and domains.
Data Validation & Update Cycle
Outputs are checked against independent signals before sign-off, including budget-to-procurement ratios, macro affordability measures, and whether category shares align with what interviewees report in current orders and deliveries. Outliers are flagged early, and the assumptions behind FX timing, inflation, and procurement phasing are re-tested until the variance is explainable.
A second analyst review is performed to confirm that definitions, inclusions, and conversion logic are applied consistently across years, and that the forecast does not break basic constraints such as plausible procurement capacity. Reports are refreshed annually, and interim updates are triggered when material events occur, such as budget revisions or major program reprioritization. Before delivery, we do a final pass so clients receive the latest updated view.
Mordor Intelligence's Russia Defense Market Size Compared With Other Published Estimates
Published market values for Russia's defense sector can look far apart because each publisher counts a different basket of spending, then applies different currency timing and price escalation logic. The mix of procurement, operations, and broader security outlays also varies by source, so the final number is sensitive to definitions even before forecasting starts.
Internal security spending and general public safety budgets sit outside Mordor Intelligence's scope here, and that single exclusion alone can create a noticeable spread versus estimates that group defense and wider security under one headline. Differences also show up when some studies report planned budget totals instead of procurement-related value, or when they apply aggressive ruble-to-USD conversions without matching the exchange rate to the spending period, which can overstate or understate the market in a given year.
Benchmark comparison
| Source | Market Size | Gaps in Research Methodology |
|---|---|---|
| Mordor Intelligence | USD 41.39 B (2025) | |
| Industry Portal A | USD 31.40 B (2025) | This estimate appears closer to a narrower equipment or missile-led slice, and it likely leaves out broader procurement categories and supporting programs, which compresses the total value reported for the same year. |
| Policy Institute B | USD 160.00 B (2025) | This figure reflects planned military spending in the federal budget converted to USD, and it can include pay, operations, and other lines that are not treated as market revenue in procurement-focused models. FX volatility and the chosen average exchange rate year also drive large swings. |
Reading the table together, the lower number is mostly explained by a narrower category scope, while the higher number is mainly a budget-total view with currency sensitivity. By keeping the model tied to a defined procurement and program value pool, then validating shares and pacing with expert checks, the result stays easier to track and repeat across updates.
Key Questions Answered in the Report
How large is the Russia defense market in 2026?
The Russia defense market size stands at USD 43.45 billion in 2026.
What is the expected growth rate for Russian defense spending through 2031?
Spending is projected to grow at a 4.97% CAGR, lifting total value to USD 55.38 billion by 2031.
Which segment is expanding fastest within Russian defense procurement?
Unmanned Systems lead with a 7.18% CAGR driven by Lancet and Geran-2 drone production.
Which armed service receives the largest share of Russia’s defense budget?
The Army holds 46.83% of total outlays, reflecting ground combat’s centrality.
What is the role of indigenous production in Russia’s defense supply chain?
Indigenous production accounts for 78.15% of procurement and is expanding as import options dwindle.