
Technology, Media and Telecom
5th MayPricing Strategy for Semiconductor Components
3 Min Read
The Runtime Application Self Protection Market is Segmented Component (Solutions [Web Application Protection, and More], Services [Professional Services, and More]), Deployment Mode (Cloud [Public Cloud, and More], On-Premises), End-User Enterprise Size (Large Enterprises, and More), End User Industry (IT and Telecommunications, BFSI, and More), and Geography. The Market Forecasts are Provided in Terms of Value (USD).
Market Overview
| Study Period | 2020 - 2031 |
|---|---|
| Market Size (2026) | USD 2.59 Billion |
| Market Size (2031) | USD 8.88 Billion |
| Growth Rate (2026 - 2031) | 27.96 % CAGR |
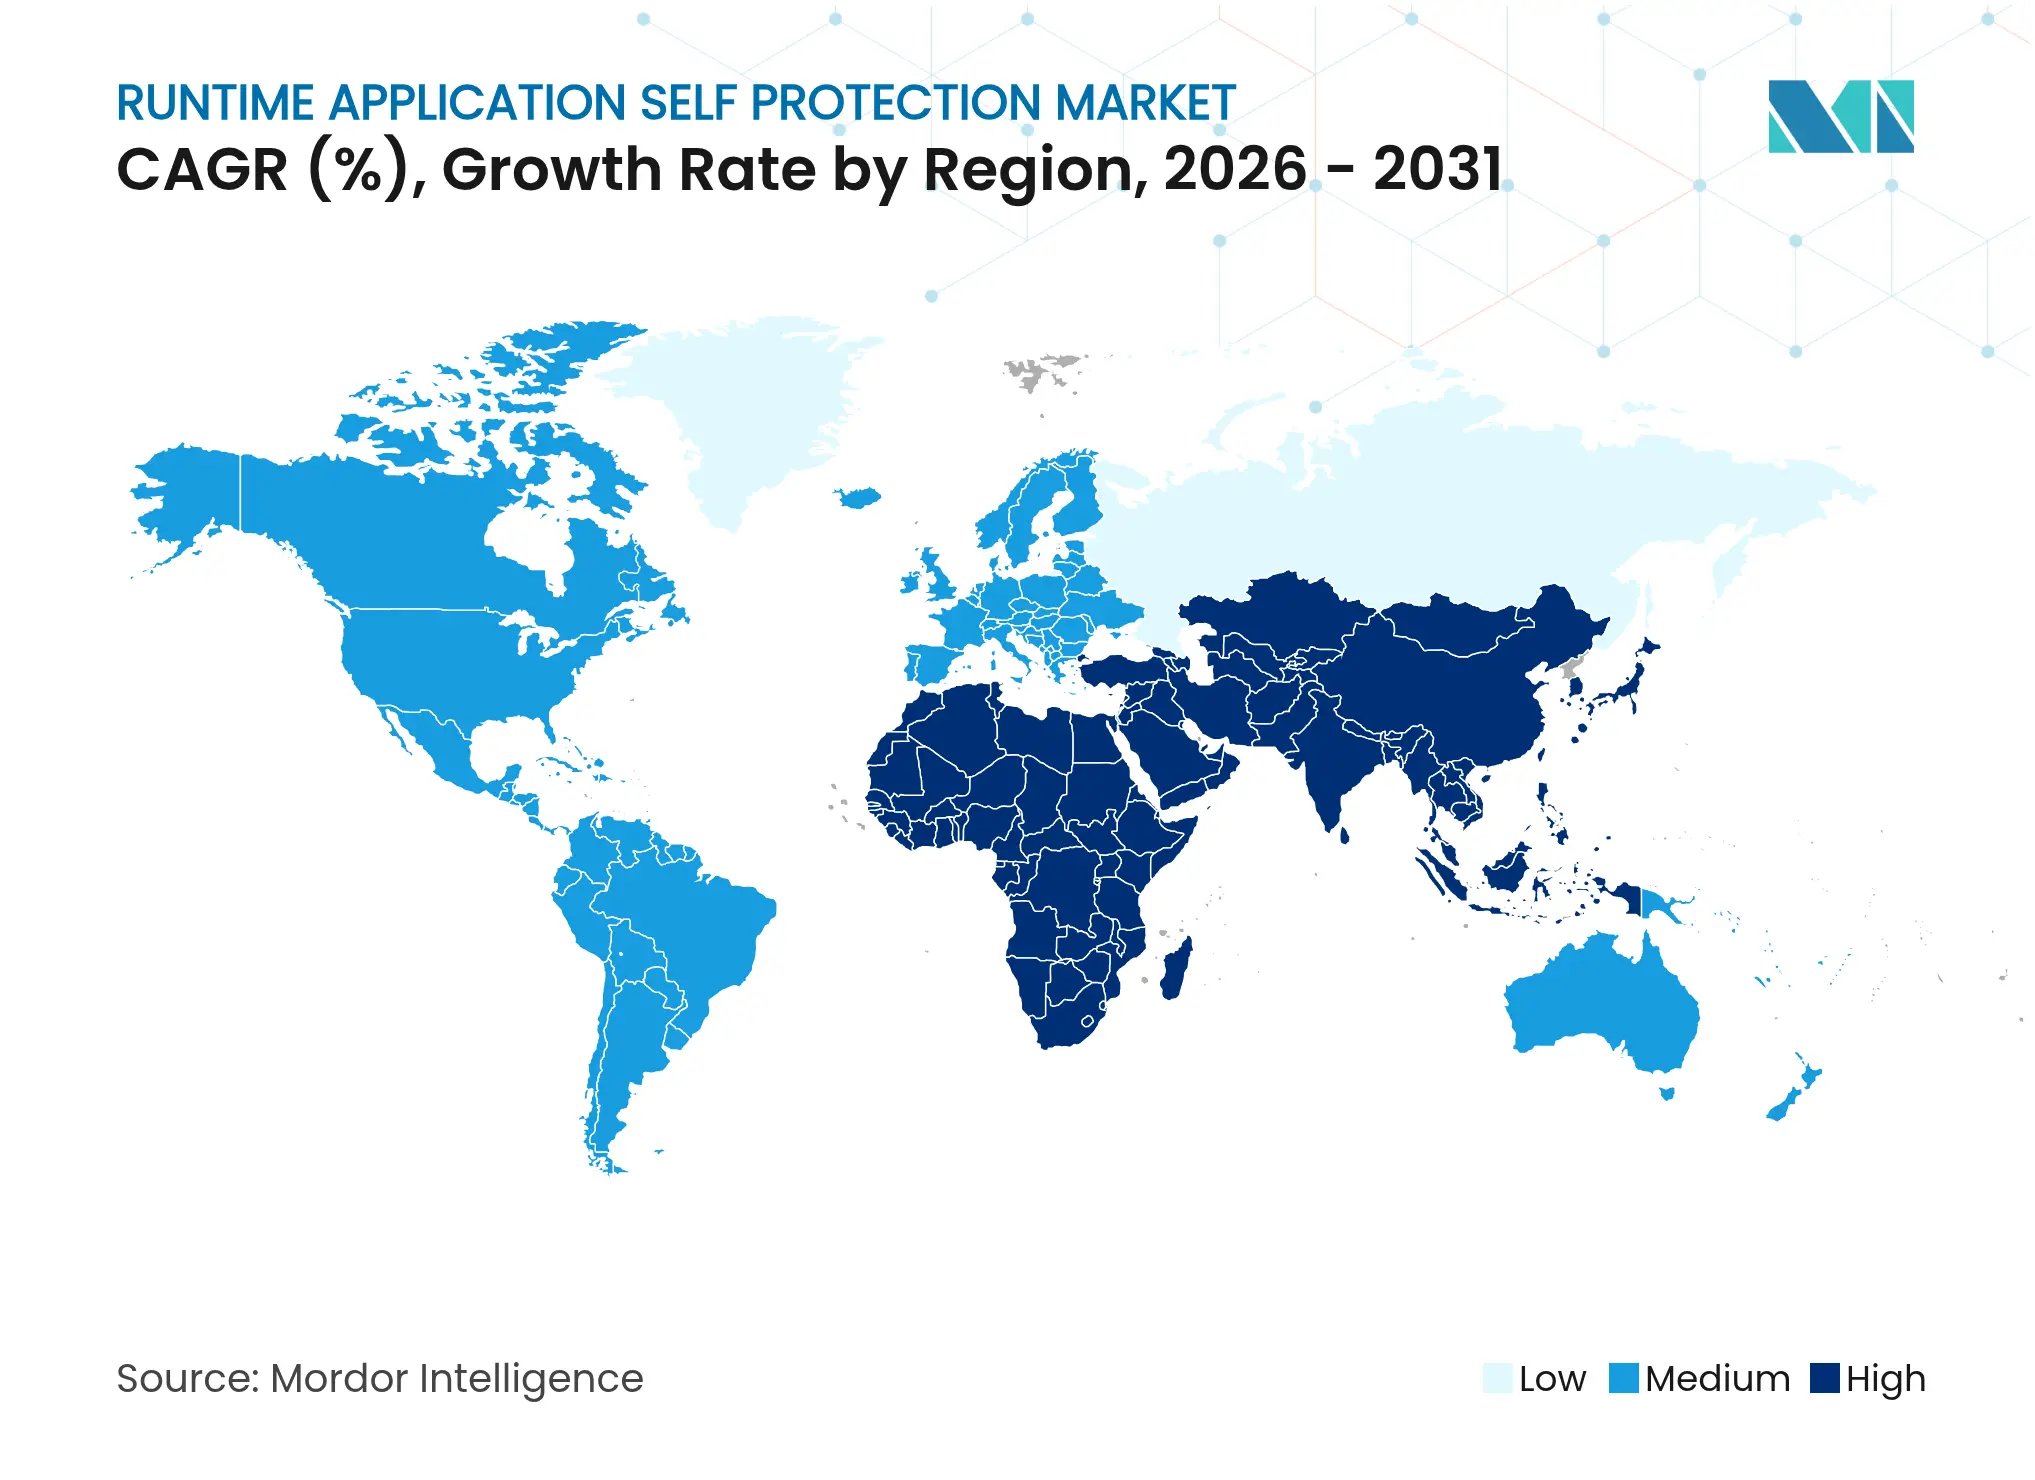
| Fastest Growing Market | Asia Pacific |
| Largest Market | North America |
| Market Concentration | Medium |
Major Players *Disclaimer: Major Players sorted in no particular order. Image © Mordor Intelligence. Reuse requires attribution under CC BY 4.0. |
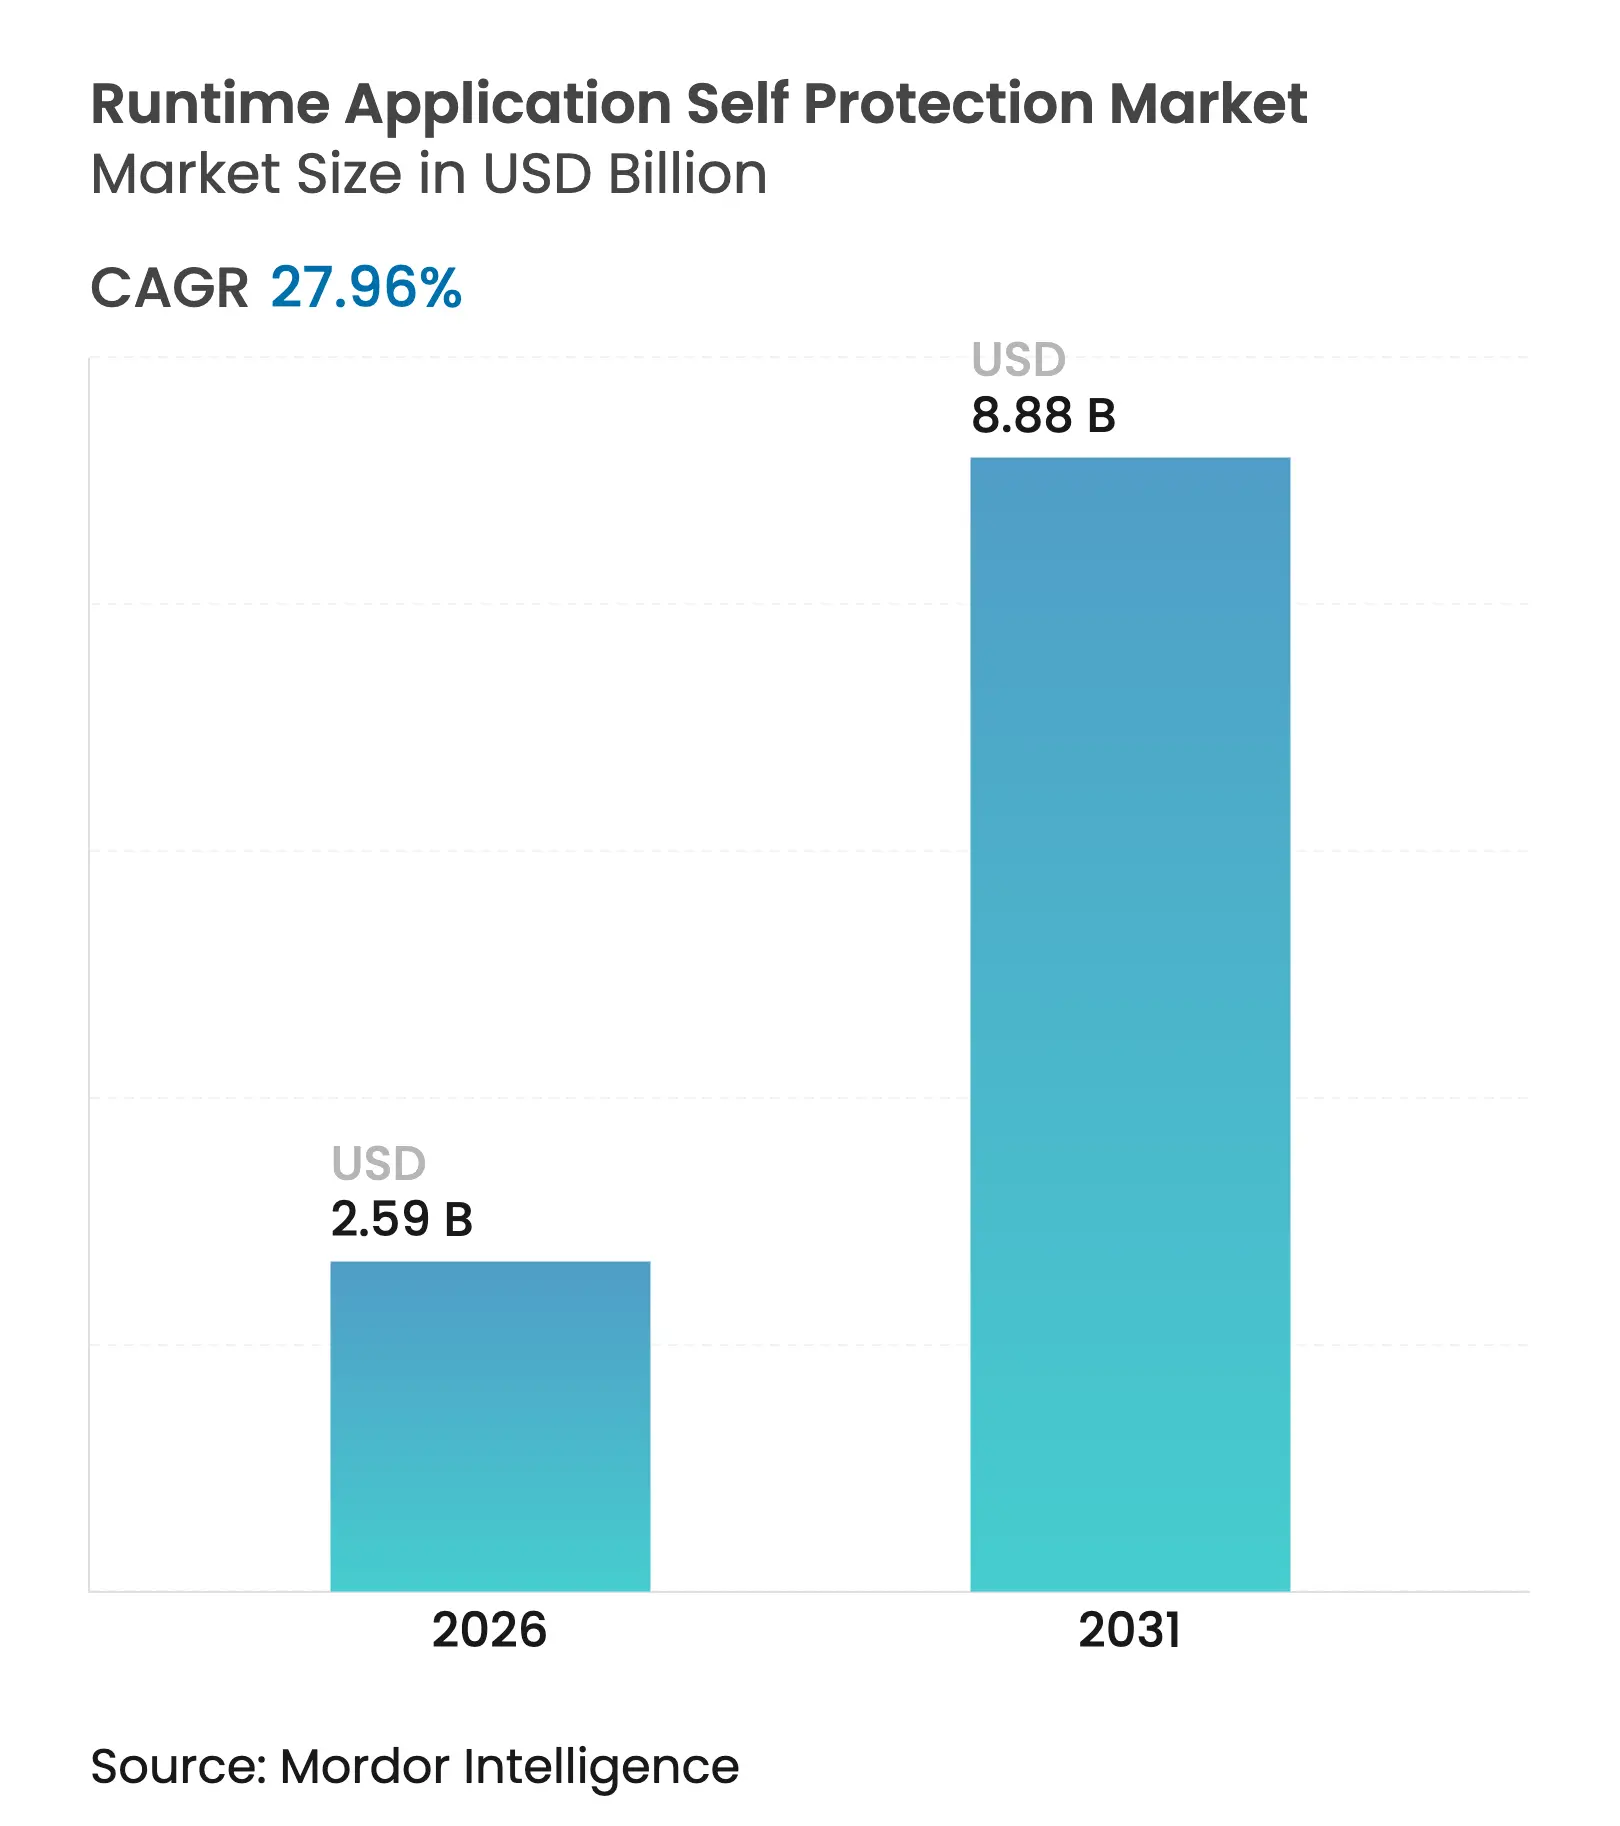
Runtime Application Self Protection market size in 2026 is estimated at USD 2.59 billion, growing from 2025 value of USD 2.02 billion with 2031 projections showing USD 8.88 billion, growing at 27.96% CAGR over 2026-2031. Growth reflects the need to embed security inside running code as perimeter controls struggle against zero-day exploits and API-focused attacks. Regulatory pressure from NIS2 in the European Union and updated CISA directives in the United States is accelerating budget re-allocation toward in-process security controls that deliver immediate threat response. Cloud-native and serverless adoption increases the number of short-lived workloads, which raises demand for agent-level protection that follows the code, not the infrastructure. Vendors are responding with acquisitions that fold runtime protection into broader platform offerings, while early investment in eBPF and Application Detection Response hints at the next wave of competitive differentiation.
Key Report Takeaways
Note: Market size and forecast figures in this report are generated using Mordor Intelligence's proprietary estimation framework, updated with the latest available data and insights as of 2026.
Drivers Impact Analysis
| Driver | (~) % Impact on CAGR Forecast | Geographic Relevance | Impact Timeline | |||
|---|---|---|---|---|---|---|
Surging zero-day and memory-safe exploits
Surging zero-day and memory-safe exploits
| +6.2% | Global, with concentration in North America and EU | Short term (≤ 2 years) |
(~) % Impact on CAGR Forecast
:
+6.2%
|
Geographic Relevance
:
Global, with concentration in North America and EU
|
Impact Timeline
:
Short term (≤ 2 years)
|
Growing prevalence of API-centric architectures
Growing prevalence of API-centric architectures
| +5.8% | Global, led by Asia-Pacific cloud adoption | Medium term (2-4 years) | |||
Rapid shift to cloud-native and serverless runtimes
Rapid shift to cloud-native and serverless runtimes
| +4.9% | North America and EU core, expanding to Asia-Pacific | Medium term (2-4 years) | |||
Heightened compliance for in-process security controls
Heightened compliance for in-process security controls
| +4.1% | EU (NIS2), North America (NIST), expanding globally | Long term (≥ 4 years) | |||
Mandatory in-app runtime protection for critical
infrastructure
Mandatory in-app runtime protection for critical
infrastructure
| +3.7% | EU, North America, with spillover to developed markets | Long term (≥ 4 years) | |||
Expansion of SBOM mandates driving embedded RASP
Expansion of SBOM mandates driving embedded RASP
| +2.9% | North America (FDA), EU, expanding to healthcare globally | Medium term (2-4 years) | |||
| Source: Mordor Intelligence | ||||||
Surging Zero-Day and Memory-Safe Exploits
Zero-day attacks now target logic faults and supply-chain gaps that static scanning ignores, prompting enterprises to place defense inside the code path itself. RASP tools monitor execution context in real time, blocking unknown exploits that bypass signature-based devices. The urgency grew when 27% of 2024 API attacks exploited business-logic flaws that Web Application Firewalls missed [1]Thales Group, “Data Threat Report 2024,” thalesgroup.com. AI-driven tooling further widens the threat window, reinforcing the value of behavior-based runtime inspection.
Growing Prevalence of API-Centric Architectures
Microservices and serverless patterns multiply API endpoints, turning each call into a potential breach vector. Forty-six percent of 2024 account-takeover attempts struck APIs rather than web forms [2]Salt Security, “State of API Security 2024,” salt.security. Embedded runtime protection observes every request flow, flags anomalous parameters, and interrupts illicit calls, protecting against GraphQL injection, parameter pollution, and prompt injection attacks targeting AI modules.
Rapid Shift to Cloud-Native and Serverless Runtimes
Containers spin up for seconds, leaving no window for scheduled scans, while serverless platforms prohibit traditional agents. Runtime Application Self Protection market vendors build lightweight hooks that travel with the application, giving asset-level visibility regardless of host rotation. Adoption gains momentum as customers absorb the cloud shared-responsibility model, acknowledging that application security remains their remit.
Heightened Compliance for In-Process Security Controls
NIST SP 800-53 now cites runtime protection explicitly, mirroring the NIS2 call for “state-of-the-art” application security. Auditors favor RASP because it produces runtime evidence and fine-grained audit logs, simplifying proof of continuous monitoring. Organizations align purchases with compliance calendars, driving consistent demand even in budget-constrained cycles.
Restraints Impact Analysis
| Restraint | (~) % Impact on CAGR Forecast | Geographic Relevance | Impact Timeline | |||
|---|---|---|---|---|---|---|
Persistent performance-latency concerns for high-frequency
apps
Persistent performance-latency concerns for high-frequency
apps
| -3.4% | Global, particularly in financial trading and real-time systems | Short term (≤ 2 years) |
(~) % Impact on CAGR Forecast
:
-3.4%
|
Geographic Relevance
:
Global, particularly in financial trading and real-time
systems
|
Impact Timeline
:
Short term (≤ 2 years)
|
Limited developer skill-set for policy tuning
Limited developer skill-set for policy tuning
| -2.8% | Global, with acute shortages in emerging markets | Medium term (2-4 years) | |||
Fragmented observability and DevSecOps toolchains
Fragmented observability and DevSecOps toolchains
| -2.1% | North America and EU, spreading to Asia-Pacific | Medium term (2-4 years) | |||
Emerging eBPF-based alternatives cannibalising demand
Emerging eBPF-based alternatives cannibalising demand
| -1.9% | Linux-dominant environments, primarily North America and EU | Long term (≥ 4 years) | |||
| Source: Mordor Intelligence | ||||||
Persistent Performance-Latency Concerns for High-Frequency Apps
Algorithmic trading desks reject any component that adds microseconds. Even modern low-overhead RASP injects traces and policy checks that can stretch critical paths. Financial institutions calculate that single-digit millisecond delays erode revenue in volatile markets, so they trial kernel-level eBPF probes that promise lighter touch while retaining insight.
Limited Developer Skill-Set for Policy Tuning
Effective runtime protection demands rules calibrated to each function call. Most developers lack security depth, and most security teams lack code familiarity, producing either liberal settings that allow attacks or strict rules that break functionality. Managed service partners fill the vacuum, but fees and vendor lock-in slow broad adoption, especially among mid-tier enterprises.
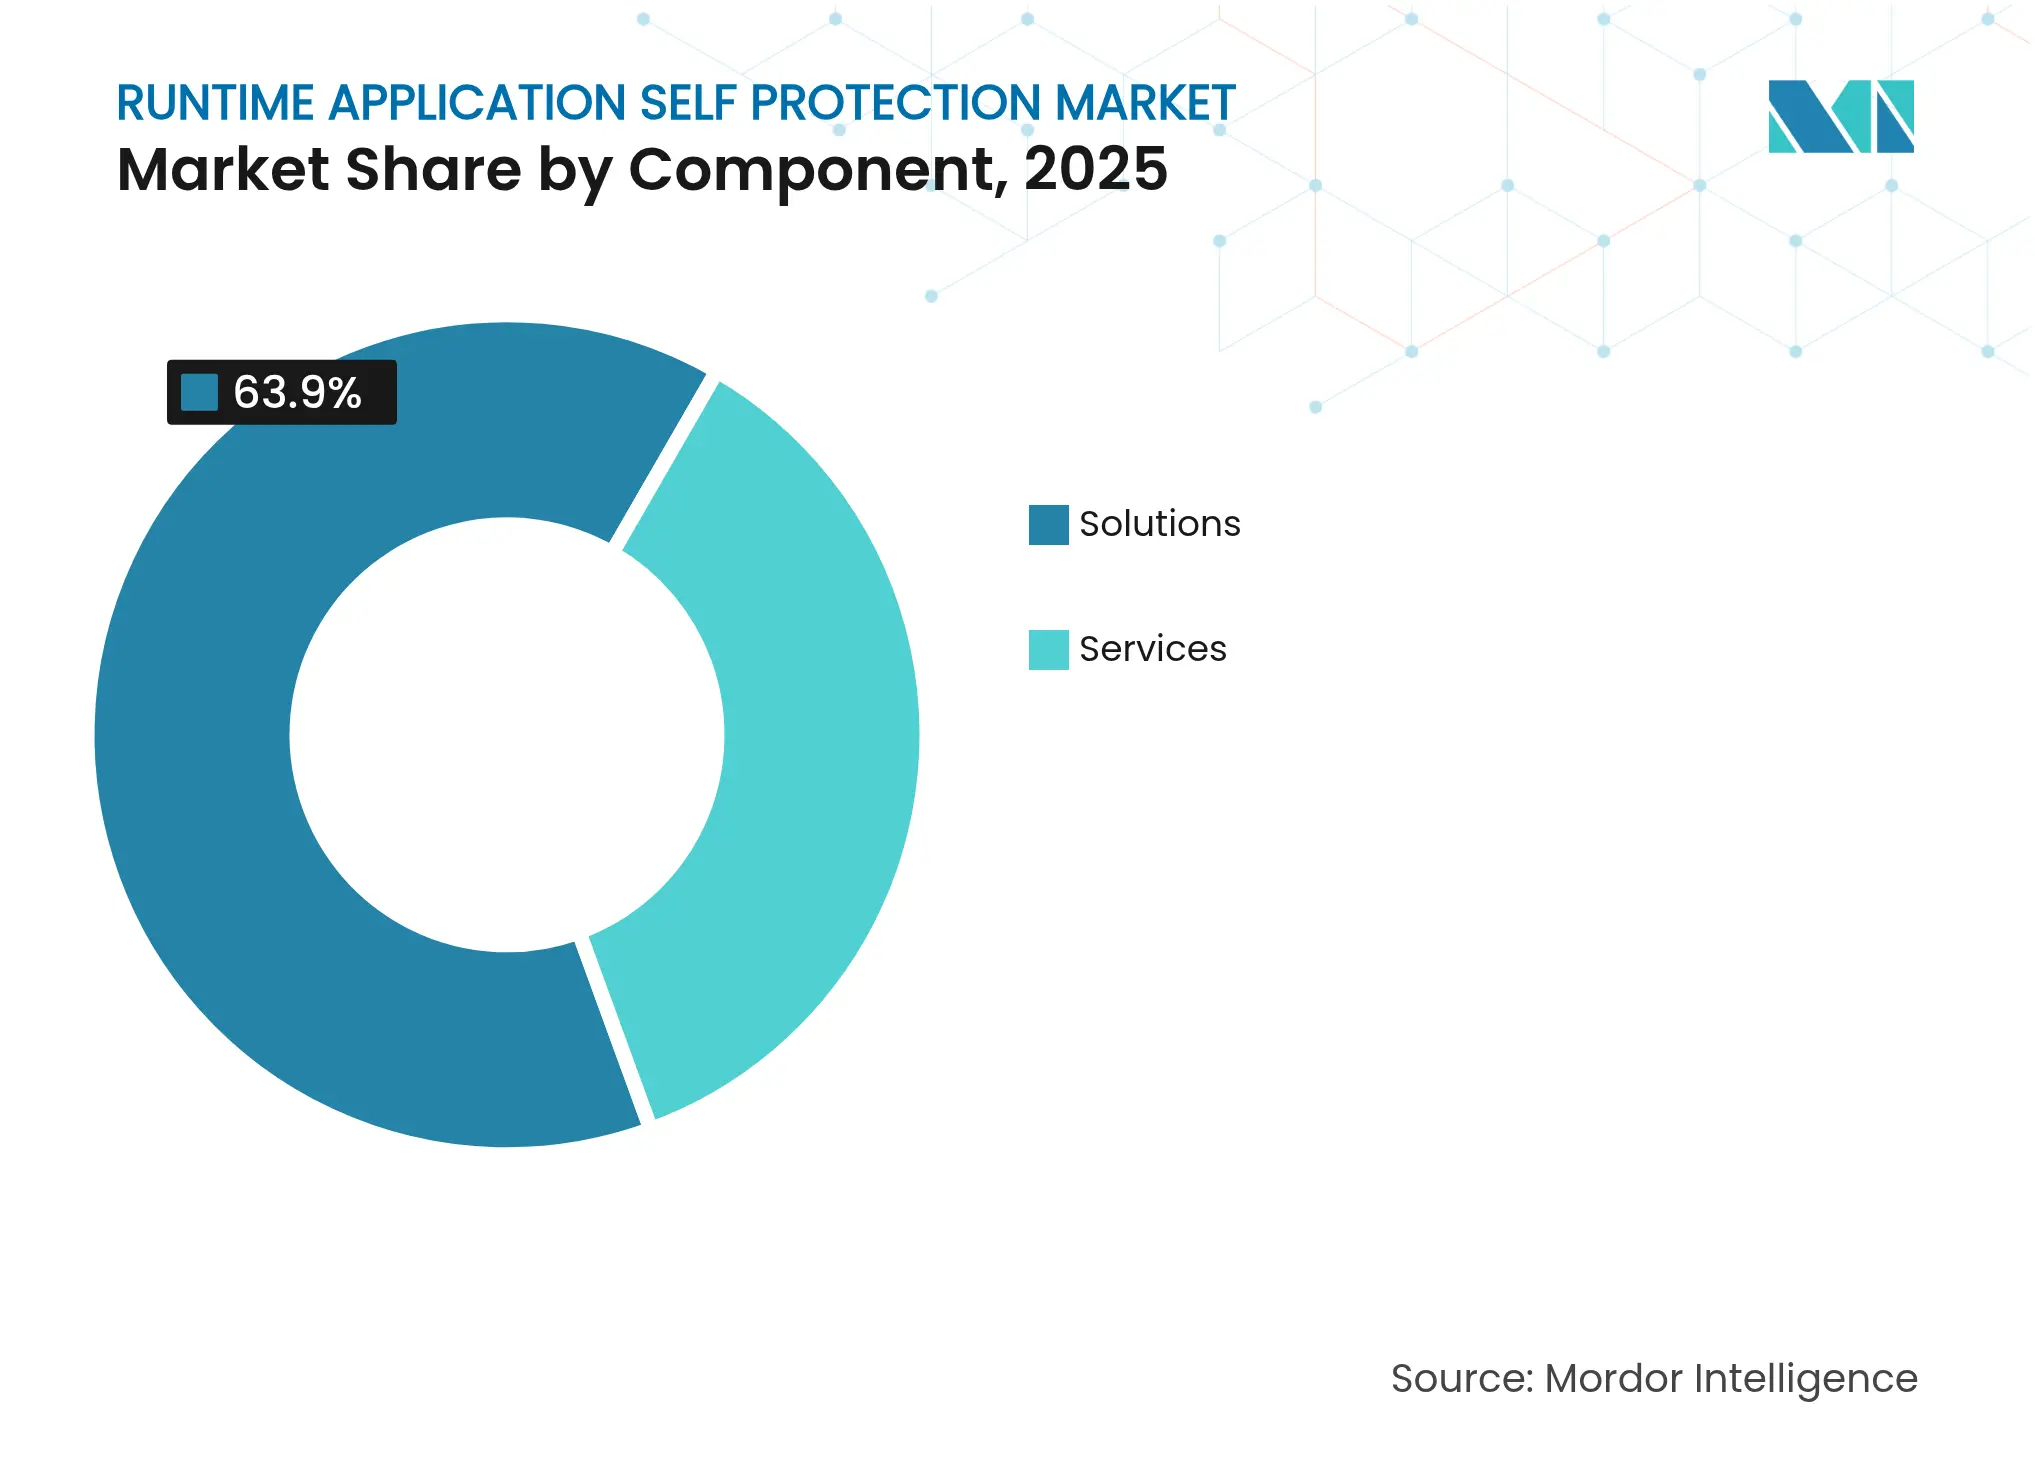
By Component: Solutions Remain Dominant While Services Accelerate
Solutions generated 63.90% of revenue in 2025 led by web, mobile, API, and IoT protection modules. The Runtime Application Self Protection market rewards turnkey capabilities that drop into production pipelines with minimal friction. Web Application Protection earns the largest slice because browser-based transactions underpin digital business. Mobile Application Protection climbs fast as financial and commerce apps face runtime tampering, jailbreak abuse, and overlay malware. API Protection attracts buyers migrating to microservices, while IoT Application Protection gains traction in industrial environments that cannot patch firmware quickly.
Services outpace all other offerings with 16.92% CAGR to 2031. Professional Services guide policy design, code instrumentation, and compliance mapping. Managed Services sustain continuous monitoring, attack forensics, and tuning cycles. As a result, organizations with limited staff outsource ongoing care, even while retaining the core solution on premises or in the cloud. This pattern supports broader penetration of the Runtime Application Self Protection industry across verticals that lack deep security teams.
Note: Segment shares of all individual segments available upon report purchase
By Deployment Mode: Cloud Supremacy Amid Hybrid Complexity
Cloud deployments captured 70.70% of 2025 revenue and will keep an 18.1% CAGR through 2031. Hyperscaler marketplaces simplify procurement, and auto-scaling functions match agent counts to workload bursts. Private cloud persists in regulated zones that deter multitenant infrastructure, yet enterprises still want unified consoles that stitch public, private, and edge nodes. The Runtime Application Self Protection market size tied to public cloud grows as serverless platforms such as AWS Lambda adopt embedded hooks rather than host agents.
On-premises deployments decline in share but remain vital for legacy Java and .NET estates. Hybrid pipelines force vendors to harmonize policy engines so that a rule behaves identically in cloud pods, virtual machines, or on-premises clusters. Edge computing pushes sensors out to factories and retail sites, requiring lightweight footprints and intermittent connectivity management, creating new lanes for specialist vendors.
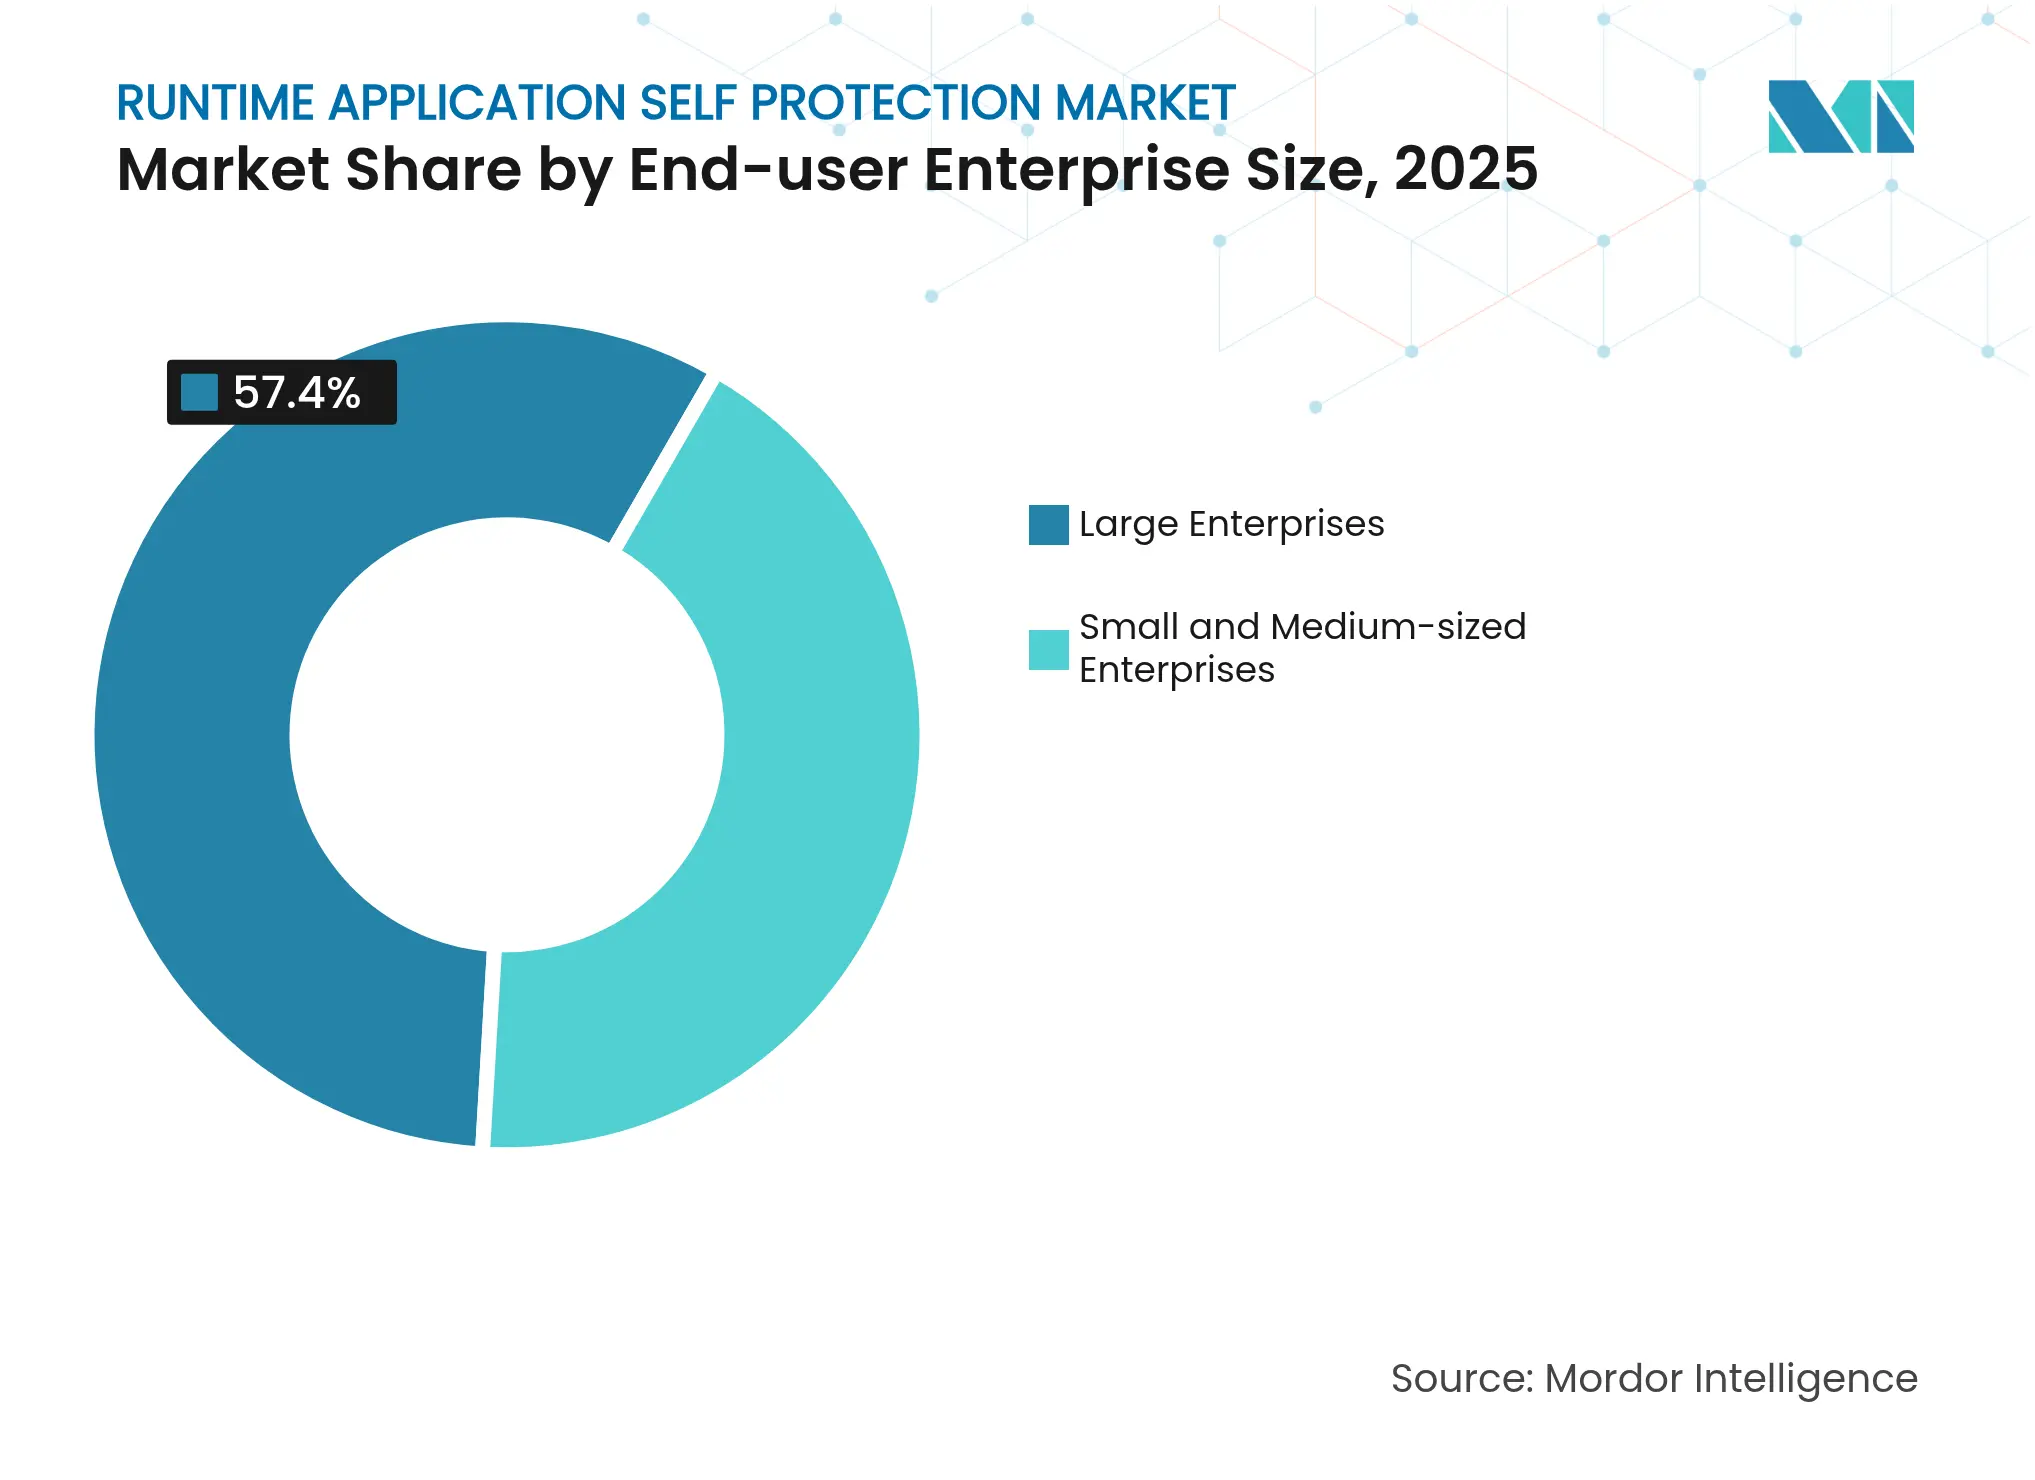
By End-user Enterprise Size: SME Growth Challenges Large Enterprise Dominance
Large enterprises held 57.40% of 2025 revenue. They deploy layered protection spanning build, deploy, and run stages and integrate runtime findings into SIEM and SOAR workflows. Custom policy libraries protect proprietary logic, and budgets support continuous penetration testing and red-teaming.
SMEs expand at 16.2% CAGR as SaaS delivery reduces entry barriers. Subscription pricing aligns with smaller budgets and removes capex. Cloud orchestration supplies auto-instrumentation, and managed service providers cover skill gaps. This democratization enlarges the Runtime Application Self Protection market and spreads risk-aware culture into supply chains that feed bigger firms.
Note: Segment shares of all individual segments available upon report purchase
By End-User Industry: Healthcare Surge Amid BFSI Leadership
The BFSI sector generated 22.40% of 2025 revenue because account fraud, open-banking APIs, and real-time settlement systems demand airtight runtime controls. Regulatory compulsion from PCI-DSS and regional open-banking rules replaces best-effort measures with mandated mitigation steps.
Healthcare grows at 19.0% CAGR to 2031, lifted by FDA medical-device cybersecurity rulings that prescribe Software Bills of Materials and continuous vulnerability mitigation. Electronic health record platforms and telemedicine apps add API surfaces that require deep behavioral monitoring. Manufacturing, energy, and government also invest steadily to protect industrial IoT and critical infrastructure.
North America held 40.30% revenue in 2025, supported by NIST directives, strong DevSecOps culture, and proximity to leading cloud providers. United States agencies place runtime protection in federal acquisition guidelines, igniting demand across civilian and defense programs. Canada scales adoption in banking and utilities, while Mexico favors cloud-delivered solutions for fintech and e-commerce.
Asia-Pacific posts the fastest 17.8% CAGR. Singapore’s revised Cyber Security Act compels critical sectors to adopt application-layer defenses. China and India add volume through explosive e-commerce and fintech ecosystems that move rapidly to microservices. Japan and South Korea push innovation in automotive and smart-factory use cases, accelerating runtime protection for robotic process lines. Australia and New Zealand enforce stringent obligations in public services and banking that echo European norms.
Europe expands steadily on the back of the NIS2 Directive, though cross-border harmonization lags. United Kingdom banks integrate runtime controls to satisfy Prudential Regulation Authority demands, while Germany and France focus on manufacturing 4.0 and energy grids. The Middle East and Africa join the adoption curve later, led by Gulf energy firms that secure drilling-rig automation and African mobile-money operators that defend transaction APIs.
Market Concentration
Competition remains moderate and fragmented. No vendor exceeds a tenth of global revenue, leaving room for disruptors. Imperva, Contrast Security, and Dynatrace bundle RASP into full-stack observability, gaining mindshare with buyers that prefer platform breadth. The Runtime Application Self Protection market rewards firms that fuse code analysis, runtime detection, and threat intel under one license.
Acquisition momentum reshapes the field. Thales purchased Imperva for USD 3.6 billion in 2023 to extend data-centric security into application runtime. In 2025, Fortinet acquired Lacework to integrate cloud-native application protection into its firewall and SD-WAN portfolio. Similar roll-ups aim to shorten customer toolchains and simplify procurement.
Emerging challengers push eBPF and Application Detection Response. Oligo Security instruments the Linux kernel to watch memory and syscalls with microsecond overhead, appealing to latency-sensitive workloads [3]Oligo Security, “Kernel-Level Runtime Protection Whitepaper,” oligosecurity.com. Vendors that link runtime alerts with code-fix guidance gain preference as DevSecOps teams demand faster mean-time-to-remediation. Edge and IoT niches remain open for specialists that can harden ARM-based devices with limited storage and compute.

*Disclaimer: Major Players sorted in no particular order
1. INTRODUCTION
2. RESEARCH METHODOLOGY
3. EXECUTIVE SUMMARY
4. MARKET LANDSCAPE
5. MARKET SIZE AND GROWTH FORECASTS (VALUE)
6. COMPETITIVE LANDSCAPE
7. MARKET OPPORTUNITIES AND FUTURE TRENDS
Market Definitions and Key Coverage
Our study defines the runtime application self-protection (RASP) market as all commercial software and managed code wrappers that sit inside an application or its runtime engine to detect, block, and log malicious behavior in real time while the application is executing in production environments. Solutions delivered as embedded agents, cloud-native services, or container sidecars are in scope, provided they intervene within the application context rather than at the network or host layer.
Scope Exclusions: Pure web-application firewalls, host intrusion systems, and professional services sold without a RASP license are excluded.
Segmentation Overview
Detailed Research Methodology and Data Validation
Primary Research
To seal data gaps, we interviewed CISOs, DevSecOps architects, and regional channel partners across North America, Europe, and Asia Pacific. Conversations confirmed average protected-application counts by industry, typical subscription terms, and saturation thresholds in midsize enterprises. Follow-up surveys with security vendors and MSSPs tested preliminary volume and pricing assumptions before model lock-in.
Desk Research
Analysts started with publicly available cyber-security statistics from sources such as NIST's National Vulnerability Database, ENISA threat reports, and CERT coordination centers, which clarified exploit frequencies that shape adoption curves. We layered in deployment counts from cloud provider transparency portals, application workload metrics published by CNCF, and annual disclosures from large enterprises that cite spend on application security in their 10-K filings. Shipment values were validated against import-export traces available through Volza and patent momentum extracted via Questel, helping us size emerging API-centric use cases. Company presentations, association whitepapers, and press releases then rounded out pricing benchmarks and competitive moves. The examples above are illustrative; many additional references informed data gathering and triangulation.
Market-Sizing & Forecasting
The model begins with a top-down install-base build that maps active enterprise and cloud-native application workloads, multiplies them by observed RASP penetration rates, and applies median annual spend per protected workload. Select bottom-up checks, supplier revenue roll-ups, and sampled average-selling-price times volume validate totals and highlight anomalies. Variable drivers include published software vulnerability tallies, migration share of workloads from on-premises to cloud, regulatory mandates (GDPR, PCI DSS), average price erosion for subscription security software, and regional GDP growth for IT outlay. Forecasts use a multivariate regression that links these drivers to historical RASP uptake and incorporates scenario bounds shared by interviewees. Where bottom-up estimates lag local currency shifts or gray-market discounts, adjustments are performed to align with macro signals.
Data Validation & Update Cycle
Every iteration passes two analyst reviews that compare outputs with peer security spend ratios and vendor earnings calls. Deviations beyond preset thresholds trigger re-contacts with sources. Reports refresh annually, with interim updates after material events such as high-severity exploit waves, so clients receive the latest calibrated view.
Why Mordor's Runtime Application Self Protection Market Baseline Earns Trust
Benchmark comparison
Published estimates differ because firms adopt unique scopes, currency bases, and refresh cadences. Some fold adjacent in-app firewalls into totals, while others ignore consumption pricing tied to serverless functions.
Key gap drivers we observe are inconsistent treatment of managed services revenue, uneven currency conversions, one-off vendor surveys without workload cross-checks, and infrequent model refreshes. Mordor Intelligence applies a disciplined scope, relies on repeatable workload counts, and revisits the model whenever regulation or deployment architecture shifts, giving decision-makers a dependable anchor.
| Market Size | Anonymized source | Primary gap driver | ||
|---|---|---|---|---|
USD 2.02 B (2025) | Mordor Intelligence | Anonymized source:Mordor Intelligence | Primary gap driver: | |
USD 3.08 B (2024) | Global Consultancy A | Includes adjacent in-app firewalls and bundles maintenance revenue | ||
USD 0.74 B (2025) | Trade Journal B | Counts software licenses only, omits cloud consumption fees | ||
USD 4.54 B (2024) | Industry Association C | Relies on vendor surveys without currency harmonization or regional checks |
Pricing Strategy for Semiconductor Components
3 Min Read
Accelerating Additive Manufacturing Adoption in India
3 Min Read
When decisions matter, industry leaders turn to our analysts. Let’s talk.