
Rubber Conveyor Belt Market Size and Share
Market Overview
| Study Period | 2020 - 2031 |
|---|---|
| Market Size (2026) | USD 4.68 Billion |
| Market Size (2031) | USD 5.71 Billion |
| Growth Rate (2026 - 2031) | 4.05 % |
| Fastest Growing Market | Asia Pacific |
| Largest Market | South America |
| Market Concentration | Medium |
Major Players *Disclaimer: Major Players sorted in no particular order Image © Mordor Intelligence. Reuse requires attribution under CC BY 4.0. | |
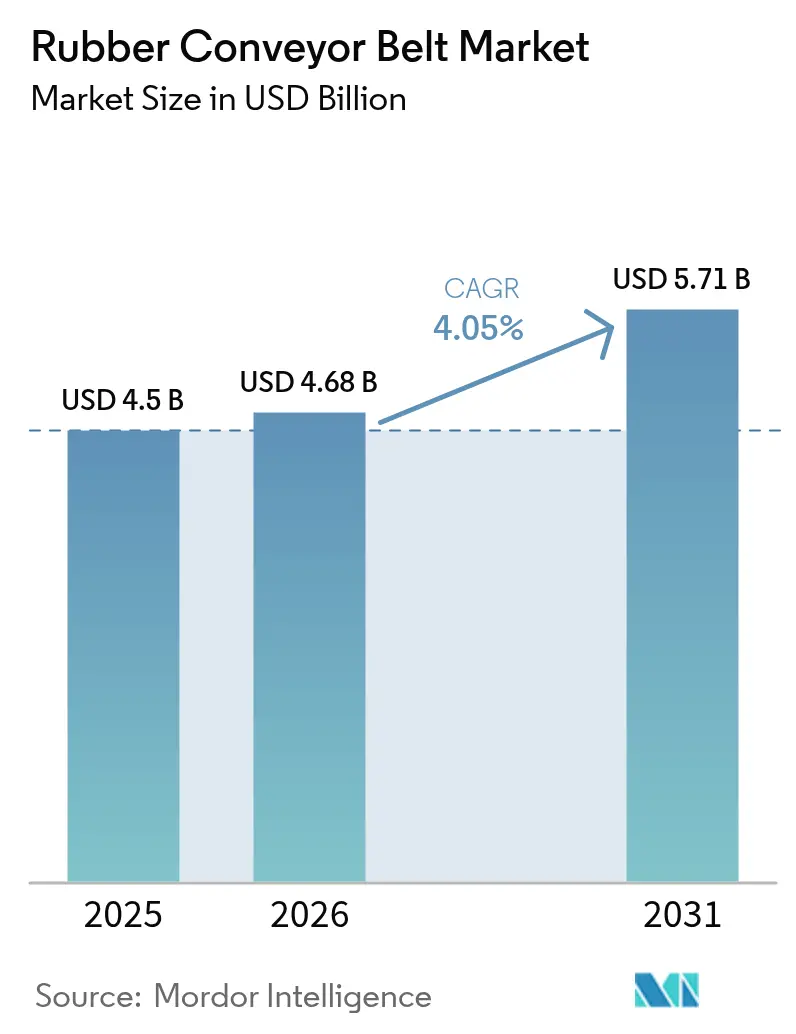
Rubber Conveyor Belt Market Analysis by Mordor Intelligence
Rubber conveyor belt market size in 2026 is estimated at USD 4.68 billion, growing from 2025 value of USD 4.5 billion with 2031 projections showing USD 5.71 billion, growing at 4.05% CAGR over 2026-2031. Demand is expanding because operators in mining, logistics, recycling, and process industries are modernizing bulk-material‐handling systems and specifying heat-, fire-, and oil-resistant belts that last longer and run at higher speeds. Three structural forces are at work: stricter safety rules, accelerating automation, and rapid growth in energy-transition minerals. End-users now treat premium belts as productivity levers rather than consumables, a perception that is lengthening service contracts and smoothing revenue for suppliers. Concurrently, lingering raw-material volatility—especially in butadiene and carbon black—has pushed manufacturers to secure multi-year supply agreements and trial bio-based fillers, an early sign that cost risk is being actively managed.
Key Report Takeaways
- Heat-resistant belts held 28.65% of the rubber conveyor belt market share in 2025, and fire-resistant variants are on course for a 5.65% CAGR through 2031.
- Medium-weight belts contributed 44.35% of the rubber conveyor belt market size in 2025; heavy-weight belts are projected to expand at a 5.32% CAGR as mines lengthen overland routes.
- Textile carcass reinforcement commanded 51.55% market share in 2025, while steel-cord belts are forecast to post a 6.05% CAGR through 2031.
- Logistics and warehousing retained a 21.60% revenue share in 2025; mining and quarrying represent the fastest-growing end-user segment with a 5.87% CAGR to 2031.
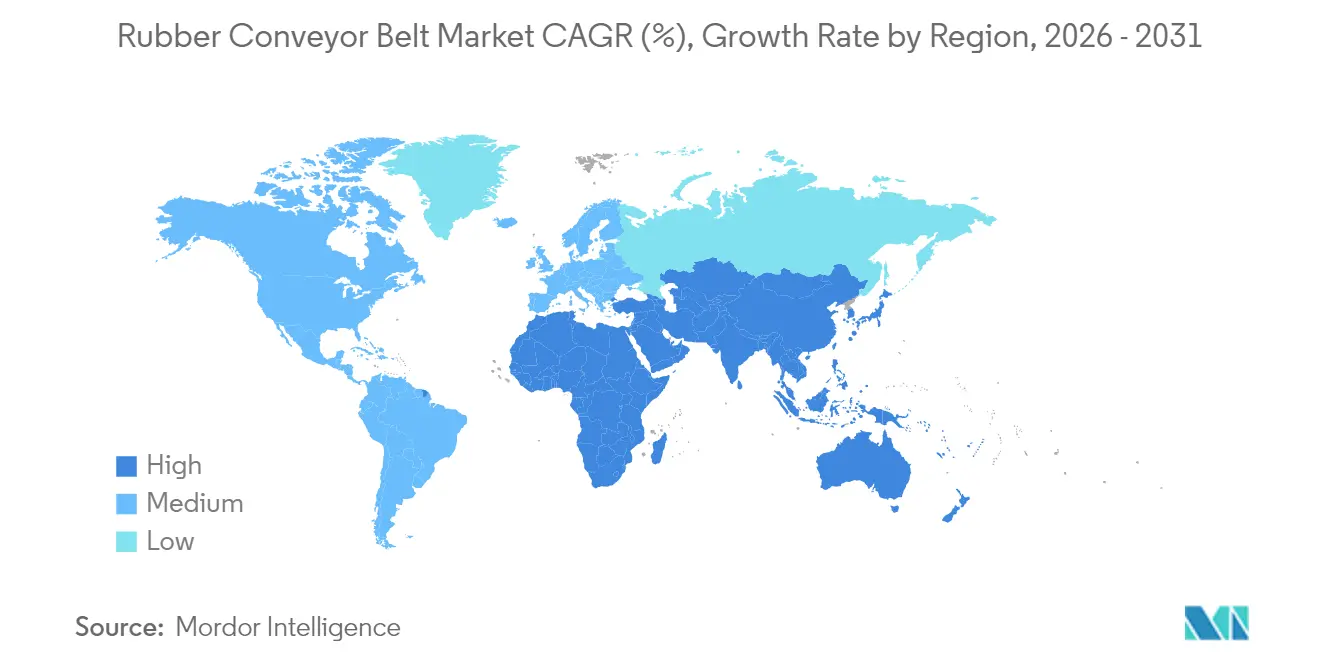
- Asia led with 33.55% of 2025 revenue, yet Latin America is expected to be the quickest-growing region at a 6.07% CAGR, buoyed by large copper and iron ore investments.
Note: Market size and forecast figures in this report are generated using Mordor Intelligence’s proprietary estimation framework, updated with the latest available data and insights as of 2026.
Market Trends and Insights
Drivers Impact Analysis of Rubber Conveyor Belt Market*
| Drivers | (~) % Impact on CAGR | Geographic Relevance | Peak Impact |
|---|---|---|---|
| Surge in High-Temperature Battery-Metals Processing in Asia Boosting Heat-Resistant Belts | +1.2% | Asia, with spillover to North America | Medium term (~ 3-4 yrs) |
| Automated Micro-Fulfillment Warehouses in North America Driving Lightweight Belt Demand | +0.8% | North America, Europe | Short term (≤ 2 yrs) |
| "Pit-to-Plant" Conveyor Retrofits in South American Copper Mines Elevating Replacement Cycle | +1.0% | Latin America, particularly Chile and Brazil | Medium term (~ 3-4 yrs) |
| EU 2023/1115 Mandating Flame-Retardant Belts in Recycling Plants | +0.7% | European Union | Short term (≤ 2 yrs) |
| Expansion of Solar-PV Manufacturing Clusters in India Requiring Oil-Resistant Belts | +0.6% | Asia, particularly India | Medium term (~ 3-4 yrs) |
| IoT-Enabled Condition-Monitoring Unlocking Pay-Per-Ton Service Contracts | +0.9% | Global, with early adoption in North America and Europe | Long term (≥ 5 yrs) |
| Source: Mordor Intelligence | |||
Surge in High-Temperature Battery-Metals Processing in Asia Boosting Heat-Resistant Belts
Cathode and precursor plants across China, Korea, and Indonesia increasingly operate reactors above 200°C, driving rapid uptake of graphene-nanotube-enhanced belts that combine thermal stability with static dissipation. These belts allow processors to raise throughput without adding cooling capacity, and the resulting productivity gain is convincing vertically integrated miners to lock in multi-year supply agreements. A fresh inference is that early certification of high-heat compounds now serves as a proxy for project schedule reliability.
Automated Micro-Fulfilment Warehouses in North America Driving Lightweight Belt Demand
Urban micro-fulfilment centers occupy footprints under 10,000 sq ft and rely on compact lightweight belts that twist, climb, and stop within millimetres. Operators switching from multi-ply to single-ply constructions report energy savings exceeding 20%, highlighting how belt mass influences total operating cost. Because labour shortages persist, gains in picking accuracy linked to low-stretch fabrics directly elevate revenue per square foot, placing materials science at the heart of warehouse economics.
“Pit-to-Plant” Conveyor Retrofits in South American Copper Mines Elevating Replacement Cycle
Chile and Peru are converting haul-trucks to continuous pit-to-plant belts that move more than 10 000 t/h while trimming diesel use by two-thirds. Higher dynamic tensions accelerate belt wear, so replacement cycles shorten even as tonnage rises, ensuring steady aftermarket demand. Mines therefore prioritise vendors with fast splice-service teams, signalling that logistics support can be as decisive as tensile rating when tenders are evaluated.
EU 2023/1115 Mandating Flame-Retardant Belts in Recycling Plants
The regulation obliges European recycling facilities to use belts that self-extinguish within strict time limits, propelling orders for certified fire-resistant grades. Fenner Dunlop invested EUR 2.4 million (USD 2.81 million) in a new mixing line to produce low-halogen compounds, turning compliance expenditure into a marketing asset. Smaller fabricators lacking certification capacity are exiting, a shift that quietly consolidates market share among well-capitalised suppliers.
Restraints Impact Analysis of Rubber Conveyor Belt Market*
| Restraints | (~) % Impact on CAGR | Geographic Relevance | Peak Impact |
|---|---|---|---|
| Volatility in Butadiene and Carbon Black Prices Compressing Margins | -0.9% | Global, with highest impact in Asia | Short term (≤ 2 yrs) |
| PVC and Modular Belt Substitution in European Food Processing | -0.7% | Europe | Medium term (~ 3-4 yrs) |
| Certification Lead-Times for UL/CSA Flame Tests in North America | -0.4% | North America | Short term (≤ 2 yrs) |
| EU Scrutiny of Nitrosamine Exposure During Vulcanization | -0.5% | European Union | Medium term (~ 3-4 yrs) |
| Source: Mordor Intelligence | |||
Expansion of Solar-PV Manufacturing Clusters in India Requiring Oil-Resistant Belts
A planned 6 GW solar-module plant in Odisha will employ oil-resistant belts to handle plasticisers and encapsulants that degrade conventional covers. Pairing nitrile blends with abrasion-resistant carcasses prevents delamination, cutting unplanned downtime. This linkage between specialty chemistry and renewable-energy rollout underscores how national industrial policy can redirect rubber conveyor belt market size toward premium variants.
IoT-Enabled Condition-Monitoring Unlocking Pay-Per-Ton Service Contracts
Continental’s Conti+ 2.0 embeds wireless strain and vibration sensors that alert users to splice fatigue days in advance. Quarries adopting the platform have negotiated pay-per-ton service contracts that shift availability risk to the belt maker in return for higher unit pricing. Ownership of performance data thus transforms belts from one-off purchases into recurring-revenue assets, subtly changing valuation models for manufacturers.
*Our forecasts treat driver/restraint impacts as directional, not additive. The impact forecasts reflect baseline growth, mix effects, and variable interactions.
Rubber Conveyor Belt Market Segment Analysis
Belt Type:
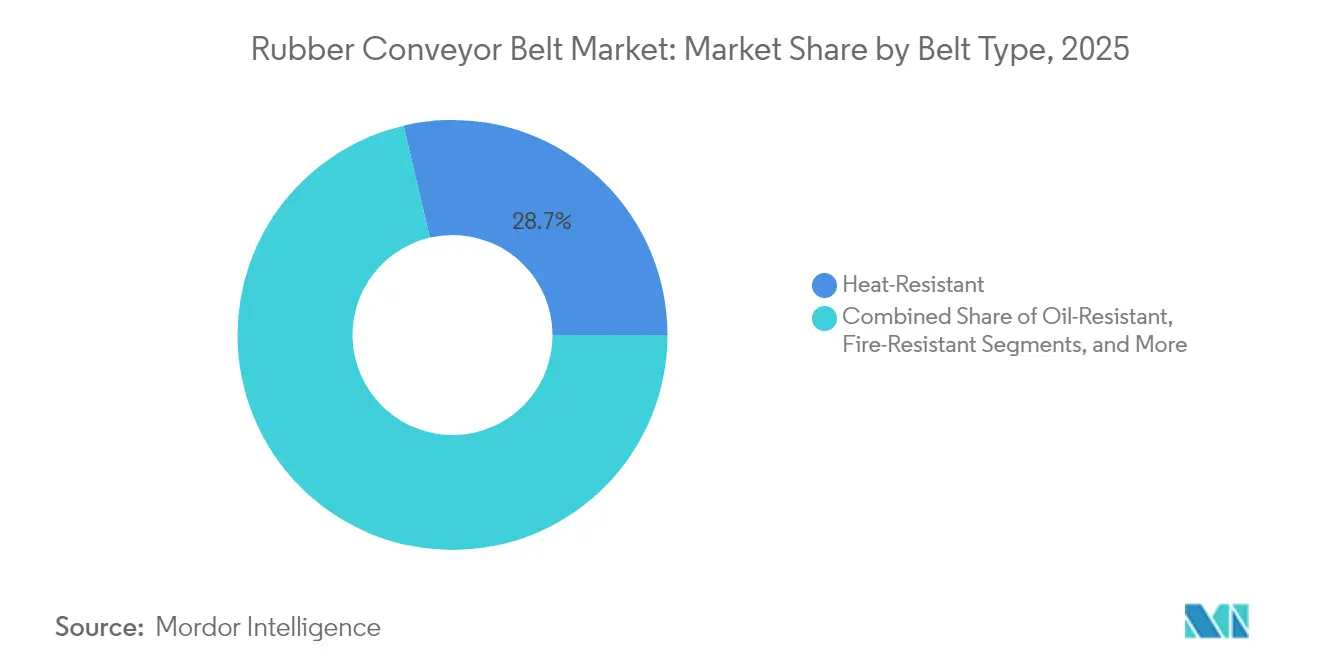
Heat-Resistant Dominates While Fire-Resistant AcceleratesHeat-resistant belts held 28.65% of the rubber conveyor belt market share in 2025. Advances in silica-rich compounds let these belts run continuously above 200 °C, enabling kiln operators to raise furnace set-points and unlock throughput gains. Fewer thermal cracks mean shorter maintenance shutdowns, an outcome that expands effective plant availability. Fire-resistant variants are forecast to grow at a 5.65% CAGR between 2026-2031, fuelled by underground-mine safety codes and EU recycling mandates. Belts achieving Type A or B certification under CAN/CSA-M422 command premiums, and many sites now specify only these grades, elevating barriers for non-certified competitors.

Belt Weight:
Medium-Weight Versatility Meets Heavy-Weight GrowthMedium-weight belts provided 44.35% of the rubber conveyor belt market size in 2025. Polyester-nylon carcasses balance strength and flexibility, letting parcel hubs extend belt life without upgrading drives. The resulting energy savings and lower structural-steel requirements reinforce payback, especially where electricity tariffs are high. Heavy-weight belts are projected to post a 5.32% CAGR as mines adopt longer overland conveyors. Goodyear’s extra-stiff polyester/nylon designs minimise stretch on multi-kilometre flights, keeping sag within design limits. Lower elongation allows single-flight layouts that reduce the number of transfer points, cutting dust emissions and maintenance hours.
End-User Industry:
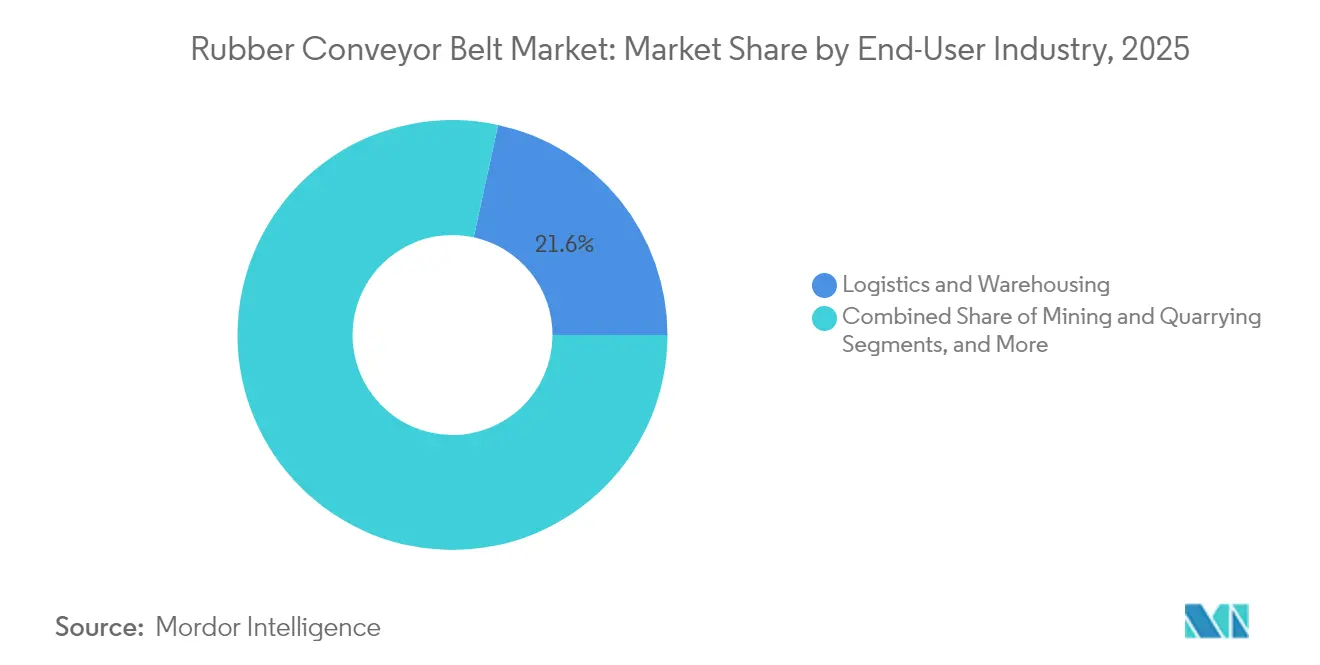
Logistics Leads While Mining AcceleratesLogistics and warehousing held 21.60% of the rubber conveyor belt market size in 2025. Noise-damped covers enable 24/7 operation in urban zones, and operators link quiet belts to higher worker retention. Mining and quarrying are projected to grow at a 5.87% CAGR through 2031. Anglo American’s Quellaveco mine produced 319,000 tons of copper in its first year using high-capacity overland belts. Reduced truck kilometres lower Scope 1 emissions, and energy-efficient belts further improve decarbonisation disclosures, aligning procurement with investor climate expectations.
Reinforcement Material:
Textile Leads While Steel Cord AdvancesTextile carcasses commanded 51.55% market share in 2025, favoured for flexibility in systems with sharp curves. Multi-weft breaker fabrics arrest tear propagation, reducing unscheduled stoppages in parcel sortation centres and saving overtime labour.
Steel-cord belts are expected to grow at a 6.05% CAGR. Continental’s ST10 000 line supports lift heights above 500 m without intermediate drives. Fewer splices lower failure probability, and the combination of high strength and low creep allows mines to phase out costly booster drives, freeing capital for other upgrades.
Geography Analysis
APAC Rubber Conveyor Belt Market
Asia dominated with 33.55% of 2025 revenue, propelled by China’s large manufacturing base and India’s infrastructure push. Access to natural rubber feedstock from Thailand and Malaysia buffers cost shocks, giving regional producers an input advantage. Policy incentives for battery-metal refining and solar-module manufacturing channel belt demand toward heat- and oil-resistant variants, effectively concentrating growth in specialised niches.
South America Rubber Conveyor Belt Market
South America is forecast to record the highest 6.07% CAGR to 2031. Major copper projects in Chile, Peru, and Brazil are replacing haul trucks with overland conveyors, driving large orders for heavy-duty steel-cord belts. Antamina’s USD 2 billion life-extension dedicates substantial capital to new conveyors, and suppliers that offer sidewall or steep-angle designs are capturing premium contracts. The region’s commitment to renewable power for mines further raises interest in low-stretch belts that cut energy draw.
North America and EMEA Rubber Conveyor Belt Market
North America and Europe retain significant shares, but for different reasons. North American warehouses prioritise predictive uptime and thus purchase sensor-equipped belts, while European factories focus on low-nitrosamine formulations to meet health standards. The Middle East and Africa remain nascent yet promising: rail projects and iron-ore mines require belts that withstand high heat and abrasive dust, pushing buyers toward blended synthetic-natural rubbers with UV-stable covers.
Regulatory Landscape
Standards and safety certification remain key purchasing filters for rubber conveyor belts, particularly for fire- and heat-resistant grades. SS-EN ISO 14890:2026 (approved February 26, 2026) updated requirements for rubber or plastics covered textile conveyor belts, which adds a new compliance checkpoint for suppliers selling into Europe and for global OEM specifications that reference ISO-aligned testing.
Chemical and trade compliance also influence sourcing and product formulation. In the EU, REACH (EC) 1907/2006 continues to drive documentation and substitution activity for restricted substances used in compounding, while cross-border shipments track under HS heading 4010, with tariff outcomes influenced by reinforcement type and construction. For example, US CBP ruling N361194 (May 27, 2026) addressed classification of rubber conveyor belts from Thailand under HTSUS 4010.12.5000, highlighting how customs interpretation can shift landed costs and supplier selection.
Value Chain Analysis
The value chain begins with upstream elastomers and reinforcing materials, then moves through compounding, calendering/coating, building, vulcanization, and finishing before supplying OEMs, conveyor integrators, and industrial distributors. Key inputs include natural rubber and synthetic rubbers (such as SBR, EPDM, and neoprene), textile reinforcements (polyester, nylon, aramid) or steel cord, and additives like carbon black and process oils. Volatility in butadiene and carbon black tightens margin management, which also supports producers shifting toward multi-year supply agreements and more deliberate compound optimization.
Midstream manufacturing is capital intensive and increasingly automated to improve consistency for premium heat-, oil-, and fire-resistant belts, including sensor-ready designs used in condition monitoring programs. Downstream, large end users in mining and logistics procure belts alongside splicing standards, onsite support, and performance data requirements, which increases leverage for suppliers that can bundle product with technical service and monitoring platforms. Distributor consolidation can further broaden reach, as shown by Motion Industries agreement to acquire International Conveyor and Rubber (December 2024), adding multiple US sites and expanding local availability for MRO customers.
Competitive Landscape
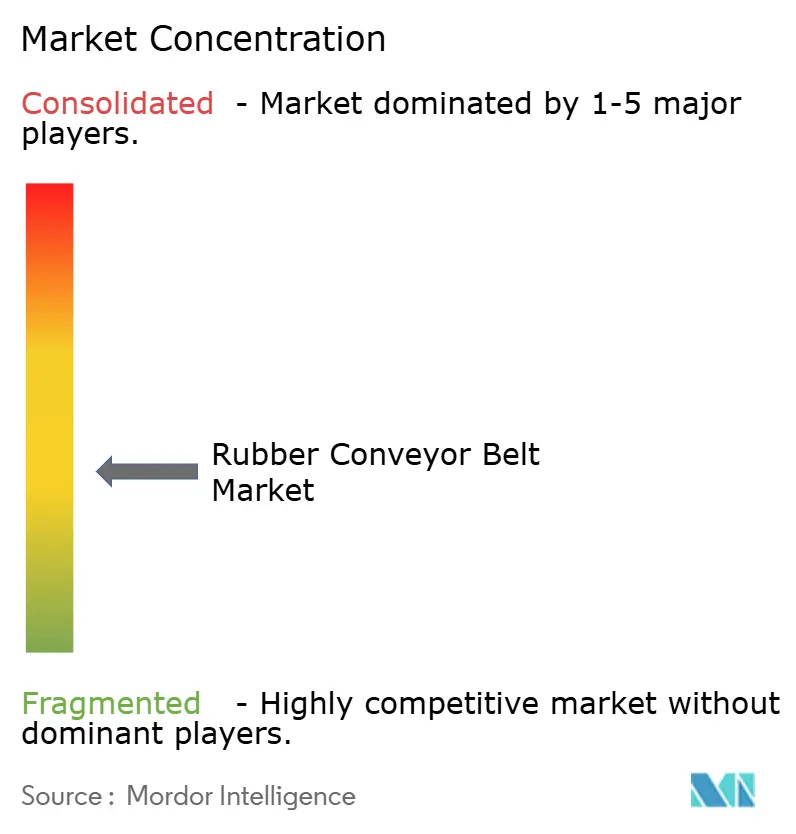
The industry is moderately fragmented; the five largest suppliers account for under one-third of revenue. Bridgestone, Continental, and Yokohama leverage global R and D networks to commercialise high-performance belts quickly. Regional producers in China and India compete on price but are upgrading automation to narrow quality gaps, hinting that cost leadership alone may soon be insufficient.
Strategic consolidation is underway. Yokohama Rubber is negotiating to acquire Goodyear’s Off-the-Road tire business for up to USD1.5 billion, aiming to bundle tires and belts for mining clients and secure raw-material scale advantages. Such mergers promise cross-selling opportunities and could raise entry barriers for smaller rivals.
Digital capability is the emerging differentiator. Continental’s Conti+ 2.0 streams belt-health data to cloud dashboards, enabling service-level agreements that guarantee uptime. Vendors lacking comparable analytics risk commoditisation as buyers increasingly include predictive maintenance in tender criteria. Data ownership also guides replacement timing, shifting bargaining power toward digitally adept manufacturers.
Rubber Conveyor Belt Industry Leaders
-
Bridgestone Corporation
-
Continental AG (ContiTech & Phoenix)
-
Fenner Dunlop Holdings Ltd.
-
The Yokohama Rubber Co. Ltd.
-
Bando Chemical Industries Ltd.
- *Disclaimer: Major Players sorted in no particular order
Rubber Conveyor Belt Market Companies Covered in this Report
- Bridgestone Corporation
- Continental AG (ContiTech and Phoenix)
- The Yokohama Rubber Co. Ltd.
- Fenner Dunlop Holdings Ltd. (Michelin Conveyor Solutions)
- Bando Chemical Industries Ltd.
- Sempertrans (Semperit AG)
- Dunlop Conveyor Belting
- Qingdao Rubber Six Conveyor Belt Co.
- Zhejiang Double Arrow Rubber Co.
- Oriental Rubber Industries Pvt. Ltd.
- Oxford Rubbers Pvt. Ltd.
- Muller Beltex B.V.
- T-Rex Rubber International B.V.
- Mitsuboshi Belting Ltd.
- Wuxi Boton Belt Co. Ltd.
- Truco Group
- Smiley Monroe Ltd.
- GRT Rubber Technologies
- Continental Belting Pvt. Ltd.
- Probelt Global Ltd.
Market Opportunities and Future Outlook
Circularity and end-of-life solutions are becoming a concrete differentiator for belt manufacturers and service partners as sustainability metrics move into tendering and procurement scorecards. Fenner Conveyors opened its K-MIX Materials Innovation Hub in Kwinana, Western Australia, in March 2026, a AUD 40 million circular manufacturing and recycling facility that supports converting used belts and related rubber waste into reusable feedstock while localizing mixing capacity.
A second opportunity lies in pairing specialized belt designs with digital inspection and monitoring requirements in mining and bulk handling. Continental expanded its mining belt portfolio in 2026 with launches such as VersaFlex (single-ply for above-ground mining) and EcoFlex/EcoFlex Plus in South America (textile belts using High Energy Polyester to reduce CO2 impact). Major miners are also formalizing technology collaboration around conveyor automation and measurement; for example, BHP and BOTON signed a global framework agreement in June 2026 covering joint development spanning automation, carbon monitoring, and robotic inspection of conveyor systems. Taken together, these actions point to demand for suppliers that can deliver upgraded belt constructions and the data layer needed for performance-based service contracts.
Recent Industry Developments in Rubber Conveyor Belt Market
- May 2026: Continental launched the VersaFlex single-ply conveyor belt for above-ground mining, targeting strength, flexibility, and rip resistance in high-abuse applications. The product supports efforts to reduce belt weight and simplify constructions while maintaining durability, helping suppliers defend premium positioning in mining replacements.
- March 2026: Fenner Conveyors officially opened the K-MIX Materials Innovation Hub at Kwinana, Western Australia, backed by a AUD 40 million investment and a closed-loop recycling partnership with Tyrecycle. The facility expands local mixing capacity and enables circular feedstock pathways for used belts and tyres, strengthening supply resilience and sustainability-led differentiation.
- December 2024: Motion Industries agreed to acquire International Conveyor and Rubber, adding seven sites in the United States. The deal broadens MRO distribution and service coverage for conveyor belting and related components, improving responsiveness for end users that prioritize uptime and fast replacement cycles.
Rubber Conveyor Belt Market Report Scope and Research Methodology
Market Definition and Coverage
For this study, the market covers the annual value of rubber conveyor belts sold for material handling, mainly in mining, cement, ports, power plants, and industrial logistics. It includes multilayer rubber carcass belts reinforced with textile fabric or steel cords for fixed conveying lines.
Scope exclusions: The sizing excludes modular plastic belts, wire-mesh or metal belts, and post-installation service revenues.
Segments Covered in This Report
- By Belt Type
- Heat-Resistant
- Oil-Resistant
- Fire-Resistant
- Chemical-Resistant
- General-Purpose
- By Belt Weight
- Lightweight
- Medium-Weight
- Heavy-Weight
- By Reinforcement Material
- Textile / Fabric Carcass
- Steel Cord
- Solid-Woven
- By End-user Industry
- Logistics and Warehousing
- Mining and Quarrying
- Manufacturing (Discrete and Process)
- Metal Processing and Steel Mills
- Power Generation (Thermal and Biomass)
- Food and Beverage
- Construction and Aggregates
- By Geography
- North America
- United States
- Canada
- Mexico
- South America
- Brazil
- Argentina
- Rest of South America
- Europe
- Germany
- United Kingdom
- France
- Italy
- Spain
- Rest of Europe
- Asia-Pacific
- China
- Japan
- South Korea
- India
- Australia
- New Zealand
- Rest of Asia-Pacific
- Middle East and Africa
- United Arab Emirates
- Saudi Arabia
- South Africa
- Rest of Middle East and Africa
- North America
Data Sources, Market Sizing, and Validation
Desk Research
Desk work starts with mapping where rubber conveyor belts are used and linking that demand to measurable activity indicators. We typically rely on public sources such as USGS mining output series, World Steel Association statistics, national cement and mining bodies, UN Comtrade trade flows, and energy and industrial production indicators from agencies such as the IEA and World Bank.
After the baseline is set, company filings, annual reports, and investor presentations are used to interpret product mix, regional exposure, and pricing commentary for fabric and steel-cord reinforced belts. We also use paid subscriptions for company financials and intelligence, news and financials, and patent databases to track product shifts that can change average selling prices and replacement cycles. The specific list of desk research sources mentioned here is not exhaustive, and many other public and paid references were also used for data collection, validation, and clarification.
Primary Interviews and Surveys
Primary work is used to pressure-test the desk model with people who see the market from different angles, including belt manufacturers, distributors, bulk-material handling EPC teams, and maintenance personnel at mines and cement plants. Their input helps confirm what they observe for replacement timing, typical belt duty, and the way customers buy belts through project and maintenance channels. We also validate regional patterns across APAC, EMEA, and the Americas so assumptions on replacement demand, lead times, and price moves do not get skewed by one geography.
Distribution of primary research fieldwork respondents
| Company type | Respondent position | Region |
|---|---|---|
| Top tier: 33% | CXOs: 15% | APAC: 44% |
| Mid tier: 52% | Functional/Unit leaders: 39% | EMEA: 37% |
| Smaller Players: 15% | Managers: 46% | Americas: 19% |
Market-Sizing & Forecasting
Sizing is built using a top-down and bottom-up blend, where mining output, cement production, steel throughput, and bulk-handling activity are translated into belt consumption needs, and then converted into value using observed price bands for fabric and steel-cord belts. To keep the totals practical, we corroborate them with selective bottom-up checks like sampled belt-change volumes from large end users, distributor channel checks, and price-per-meter ranges adjusted for belt width, ply rating, and reinforcement type.
The model is anchored on a few market fingerprints that can be tracked year to year, including replacement cycle length in abrasive duty, the share shift between fabric and steel-cord belts by application, rubber and reinforcement input cost movement, utilization levels in mining and cement, and import-export dependence in belt supply. Forecasts are generated using scenario analysis supported by expert views, since capex cycles in mining and cement can swing quickly and then flow into belt orders with a lag. Where local data is thin, gaps are handled by using peer-country intensity proxies and then rechecked with interview feedback before finalizing.
Data Validation & Update Cycle
Outputs are validated by triangulating the final values against independent signals like end-use production indices, trade movements, and observed pricing direction, and then checking that regional shares stay consistent with capacity and consumption realities. Any unusual jumps are reviewed in steps, first by rechecking inputs and formulas, and then by recontacting sources when the variance cannot be explained by a known event.
Before sign-off, another analyst reviews the logic trail so assumptions can be followed without hidden adjustments. The report is refreshed annually, and interim updates are made when material events occur, such as sharp raw material moves, major capacity additions, or changes in mining and cement outlook. Right before delivery, we do a final pass to ensure the latest public datapoints are reflected.
Mordor Intelligence's Rubber Conveyor Belt Market Size Versus Other Published Estimates
Published market values for rubber conveyor belts often differ because each publisher draws the scope differently and also picks different years and pricing assumptions. In this market, the biggest spread usually comes from what product types get counted, whether services are included, and how replacement-driven demand is treated versus new project demand.
Import-export movements for conveyor belt product codes, together with mining and cement production direction checks, are used to keep Mordor Intelligence's 2026 value aligned to first-sale rubber belt demand and to avoid counting non-rubber belt types or post-installation services. Figures can also vary when currency conversion timing differs, or when price progression is assumed from raw material indices without being checked against quoted belt price ranges.
Benchmark comparison
| Source | Market Size | Gaps in Research Methodology |
|---|---|---|
| Mordor Intelligence | USD 4.68 B (2026) | |
| Industry Data Publisher A | USD 4.49 B (2024) | Uses an earlier base year and a broader definition that is not clearly limited to endless rubber belts reinforced with textile or steel cord, which can shift the included value pool and pricing basis. |
| Market Analytics Firm B | USD 4.21 B (2025) | Uses a different base year and time horizon, and the published scope does not clearly state exclusions for modular plastic, wire-mesh, or metal belt types, which can change what is counted as market value. |
The table mainly shows differences coming from base year selection and inclusion rules, rather than a single growth assumption. When the inputs are tied to observable end-use activity and belt replacement realities, the final number becomes easier to trace and refresh as conditions change.
Key Questions Answered in the Report
What is the projected growth rate for the rubber conveyor belt market during 2026-2031?
The market is expected to grow at a 4.05%CAGR, rising from USD4.68 billion in 2026 to USD5.71 billion by 2031.
Which belt type currently holds the largest rubber conveyor belt market share?
Heat-resistant belts lead the market because high-temperature industries depend on their ability to withstand continuous operation above 200 °C.
Why are steel-cord belts gaining traction in mining applications?
Steel-cord reinforcement provides high tensile strength and low elongation, enabling longer single-flight conveyors that lower energy consumption and maintenance.
How is IoT technology changing conveyor-belt maintenance strategies?
Sensor-equipped belts deliver real-time condition data that support predictive maintenance and enable suppliers to offer pay-per-ton service models.
What regulation is driving demand for flame-retardant belts in Europe?
EU 2023/1115 mandates self-extinguishing conveyor belts in recycling facilities, accelerating replacement cycles with certified fire-resistant variants.
Which region is expected to record the highest growth rate through 2031?
Latin America is projected to grow fastest at a 6.07%CAGR, spurred by large-scale mining and infrastructure investments that rely on heavy-duty conveyor systems.