
Rubber Bonded Abrasive Market Size and Share
Market Overview
| Study Period | 2020 - 2031 |
|---|---|
| Market Size (2026) | USD 1.33 Billion |
| Market Size (2031) | USD 1.54 Billion |
| Growth Rate (2026 - 2031) | 3.05 % |
| Fastest Growing Market | Asia Pacific |
| Largest Market | Asia Pacific |
| Market Concentration | Medium |
Major Players *Disclaimer: Major Players sorted in no particular order Image © Mordor Intelligence. Reuse requires attribution under CC BY 4.0. | |
Rubber Bonded Abrasive Market Analysis by Mordor Intelligence
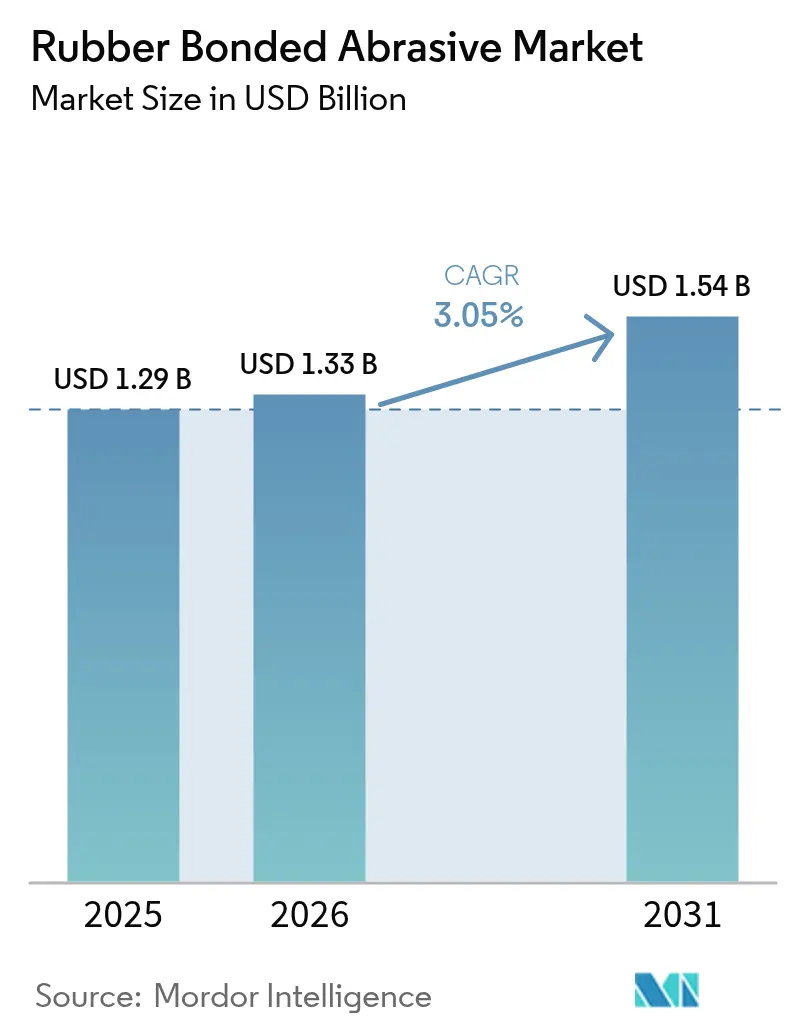
The Rubber Bonded Abrasive market size is expected to grow from USD 1.29 Billion in 2025 to USD 1.33 Billion in 2026 and is forecast to reach USD 1.54 Billion by 2031 at 3.05% CAGR over 2026-2031. The measured expansion signals a shift from volume-led demand toward value-added, high-precision applications as manufacturers prioritize vibration control and surface integrity. Wheels remain the workhorse in heavy-duty grinding, while points and sticks are gaining share in electronics and medical finishing lines. Specialty rubber grades featuring low-volatile organic compound (VOC) chemistries are scaling up in response to tightening environmental regulations. Asia-Pacific retains its dual position as the largest consumer and the fastest-growing region, supported by sustained industrialization and the dispersion of precision manufacturing capabilities. Competitive dynamics point to moderate consolidation, yet regional players find room to expand by offering supply-chain resilience and tailored formulations.
Key Report Takeaways
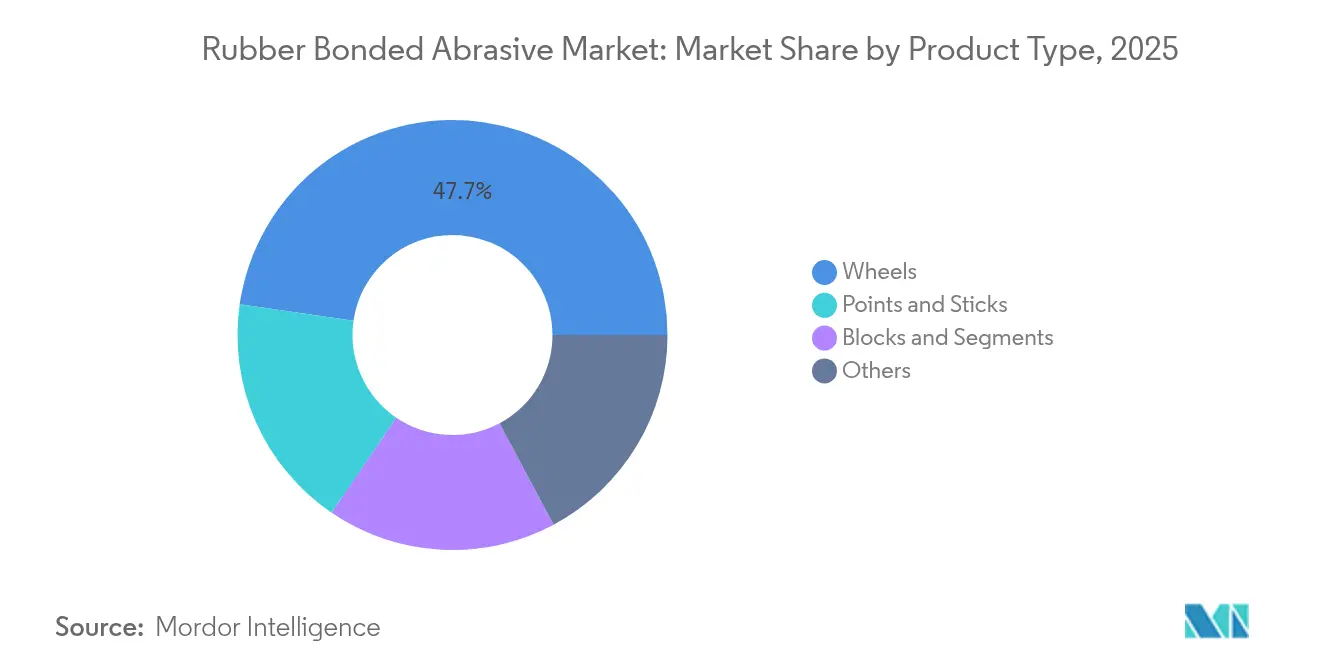
- By product type, wheels led with 47.72% of the Rubber Bonded Abrasive market share in 2025, while points and sticks recorded the highest projected CAGR at 3.92% to 2031.
- By rubber type, natural rubber commanded a 44.10% share, whereas other specialty rubbers are expected to expand at a 4.01% CAGR through 2031.
- By application, the powertrain segment accounted for 28.35% share of the Rubber Bonded Abrasive market size in 2025; other applications are forecast to grow at 4.22% CAGR between 2026-2031.
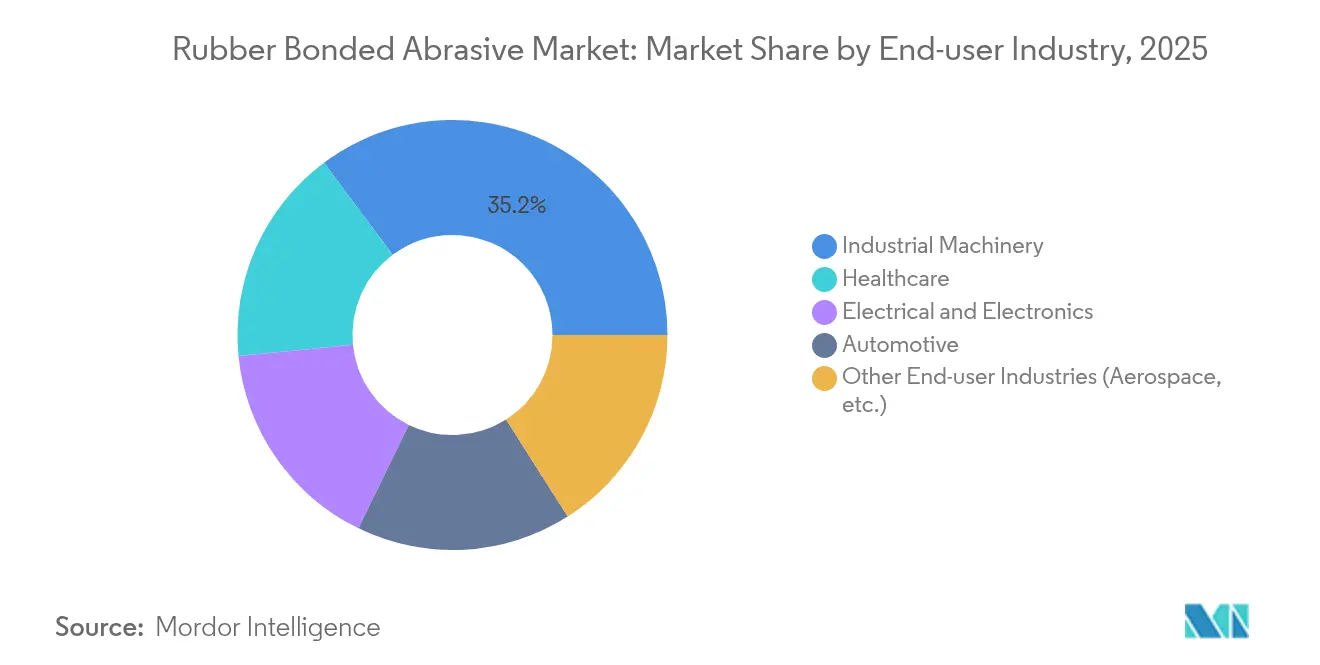
- By end-user, industrial machinery dominated with a 35.20% share in 2025, while healthcare is advancing at a 4.11% CAGR to 2031.
- By geography, Asia-Pacific captured 39.25% of the global Rubber Bonded Abrasive market share in 2025 and is projected to rise at a 4.02% CAGR through 2031.
Note: Market size and forecast figures in this report are generated using Mordor Intelligence’s proprietary estimation framework, updated with the latest available data and insights as of 2026.
Market Trends and Insights
Drivers Impact Analysis of Rubber Bonded Abrasive Market*
| Driver | (~) % Impact on CAGR Forecast | Geographic Relevance | Impact Timeline |
|---|---|---|---|
| Rising Demand for Metal and Steel Fabrication | +0.8% | Global, concentrated in Asia-Pacific and North America | Medium term (2-4 years) |
| Expanding Automotive OEM Production Capacities | +0.6% | Global, led by Asia-Pacific | Medium term (2-4 years) |
| Process-automation and CNC Integration Boosting Productivity | +0.5% | North America & Europe, expanding to Asia-Pacific | Long term (≥ 4 years) |
| Rapid Uptake in 3D-printed Metal Finishing | +0.4% | North America & Europe, early adoption in Asia-Pacific | Short term (≤ 2 years) |
| Increase in Electronics and Semiconductors Manufacturing | +0.3% | Asia-Pacific core, spill-over to North America | Medium term (2-4 years) |
| Source: Mordor Intelligence | |||
Rising Demand for Metal and Steel Fabrication
Steel capacity additions for infrastructure and shipbuilding amplify the need for compliant grinding tools to prevent thermal distortion. Rubber bonded wheels withstand the high pressures of plate grinding, where vitrified alternatives can fracture. Synthetic-enhanced compounds now extend wheel life, balancing productivity with cost control. Localization of fabrication in North America and Europe opens new demand pockets as buyers seek alternatives to imported grains. Automated grinding lines favor rubber bonded designs because their predictable wear supports longer unattended runs [1].
Expanding Automotive OEM Production Capacities
Global automakers are enlarging facilities to serve electric vehicle programs that call for precise finishing of powertrain and battery housings. Fine-grit rubber bonded wheels deliver mirror finishes without subsurface damage on steel and aluminum components. Investment announcements in Europe and the United States point to long-term grinding infrastructure upgrades. The segment’s tilt toward lightweight materials enhances rubber bonded traction because the same wheel can shift from steel to composites with minor parameter changes.
Process-automation and CNC Integration Boosting Productivity
Computerized Numerical Control (CNC) grinders equipped with in-process conditioning rely on wheels that wear predictably across long unattended cycles. Rubber bonded abrasives meet this need and are now being paired with sensors that feed performance data into factory analytics platforms. As Industry 4.0 spreads, smart wheels enable predictive maintenance scheduling that reduces downtime. The synergy between consistent wheel behavior and AI-driven optimization is cementing rubber bonded adoption in advanced machining centers.
Rapid Uptake in 3D-Printed Metal Finishing
Additive manufacturing of aerospace and medical parts is creating complex geometries that conventional wheels cannot reach. Rubber bonded points and sticks adapt to internal channels without damaging delicate lattice structures. New magnetic abrasive finishing systems incorporate rubber bonded media to achieve low-Ra surfaces on titanium and Inconel. As automated post-processing cells scale, demand for specialized rubber bonded formulations tailored to 3D-printed alloys is set to climb.
Restraints Impact Analysis of Rubber Bonded Abrasive Market*
| Restraint | (~) % Impact on CAGR Forecast | Geographic Relevance | Impact Timeline |
|---|---|---|---|
| Environmental Regulations on Rubber and VOC Emissions | -0.4% | Global, with strictest enforcement in North America and Europe | Short term (≤ 2 years) |
| Raw-material Price Volatility | -0.3% | Global, with highest impact in Asia-Pacific | Medium term (2-4 years) |
| Shift Toward Super-abrasives in Precision Grinding | -0.2% | North America & EU, expanding to Asia-Pacific | Long term (≥ 4 years) |
| Source: Mordor Intelligence | |||
Environmental Regulations on Rubber and VOC Emissions
Proposed United States Maximum Achievable Control Technology (MACT) standards and tighter European Registration, Evaluation, Authorization and Restriction of Chemicals (REACH) rules are elevating compliance costs for rubber compounders. Manufacturers are reformulating with low-VOC curatives and investing in thermal oxidizers to capture hazardous air pollutants. Small producers may struggle with the capital burden, accelerating consolidation. R&D pipelines now prioritize bio-based alternatives that maintain elasticity while reducing emissions, positioning early adopters for future growth [2].
Raw-material Price Volatility
Natural rubber prices fluctuate sharply due to weather, disease, and currency swings in Thailand, Indonesia, and Malaysia. Synthetic substitutes mirror oil price movements, limiting hedging strategies. Supply shocks of 20-30% within a quarter compress margins and complicate contract pricing. Pilot programs to cultivate domestic rubber crops in the United States remain nascent and cannot yet offset global supply risk, keeping input costs unpredictable for the medium term.
*Our forecasts treat driver/restraint impacts as directional, not additive. The impact forecasts reflect baseline growth, mix effects, and variable interactions.
Rubber Bonded Abrasive Market Segment Analysis
By Product Type:
Wheels Dominate While Points AccelerateWheels represented 47.72% of the Rubber Bonded Abrasive market size in 2025, reflecting their indispensability in high-volume heavy-duty grinding. Their broad contact surface supports rapid stock removal on crankshafts and steel plates. Points and sticks, although smaller in volume, are climbing at 3.92% CAGR as electronics and medical plants require pinpoint accuracy for finishing delicate parts. Blocks and segments serve niche applications such as turbine blade root grinding where geometry flexibility is paramount.
CNC adoption is reinforcing demand for shape-stable points that uphold tolerances across extended cycles. Hybrid wheel designs that integrate segment adaptability within a wheel body are emerging, offering shops the productivity of wheels and the finesse of points without tool changeovers.

By Rubber Type:
Natural Leads but Specialty Compounds GainNatural rubber held 44.10% of the Global Rubber Bonded Abrasive market share in 2025 owing to its elasticity and vibration damping during heavy grinding. Specialty rubbers, such as silicone, nitrile butadiene rubber (NBR), and neoprene are projected to log 4.01% CAGR, driven by elevated temperature resistance and chemical stability. NBR excels where oil resistance is vital, particularly in powertrain grinding lines, while neoprene finds use in marine environments.
Sustainability pressures are steering research and development (R&D) toward bio-based synthetics that parallel natural rubber performance but mitigate supply risk. Nanotube-enhanced rubber composites promise greater thermal conductivity, enabling higher peripheral speeds without wheel degradation.
By Application:
Powertrain Core but Diversification EvidentPowertrain dominated with 28.35% share of Rubber Bonded Abrasive market size in 2025 as crankshaft and camshaft grinding rely on compliant wheels to avoid residual stress. Other applications, mainly cutting and forming tools, are expanding at 4.22% CAGR on the back of 3D printing post-processing needs. Gears and bearings remain stable, with noise-reduction targets driving finer grit usage. Turbine components command premium pricing due to stringent finishing tolerances.
Electrification is redefining powertrain grinding, shifting focus to lightweight aluminum housings and composite motor laminations. Rubber bonded wheels versatile enough to migrate between steel and non-ferrous substrates without changeover, are becoming OEM standards.
Geography Analysis
APAC Rubber Bonded Abrasive Market
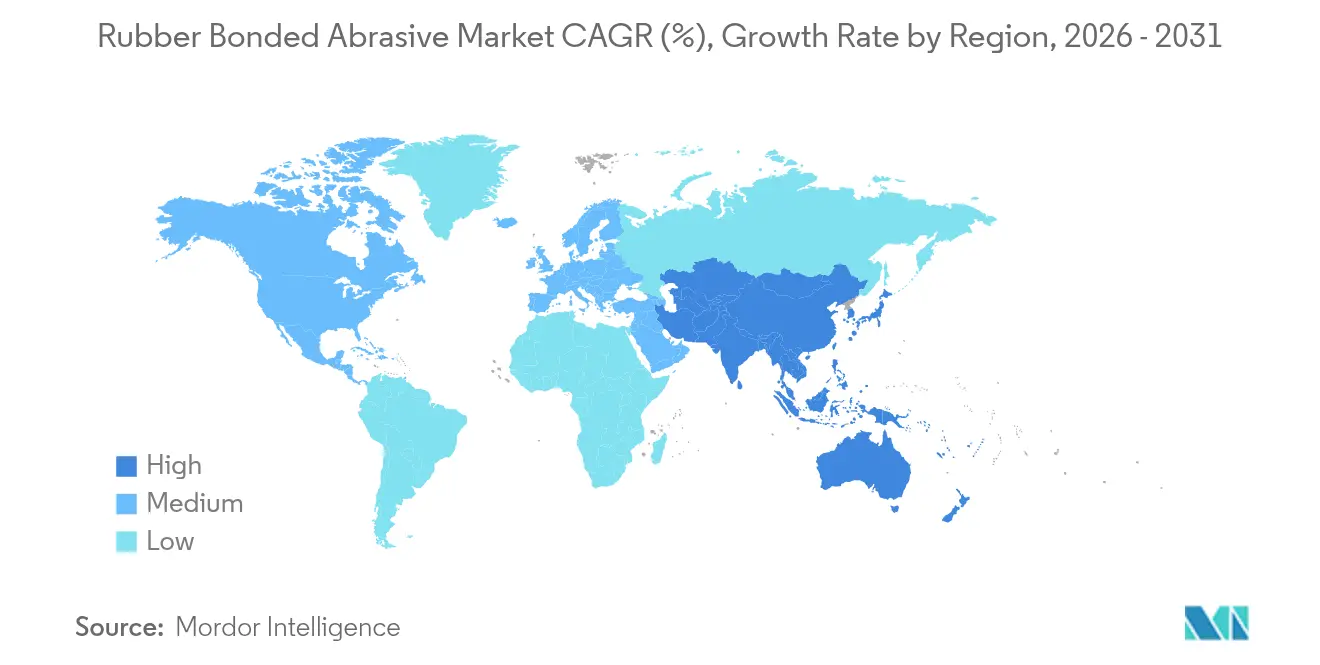
Asia-Pacific accounted for 39.25% of the Global Rubber Bonded Abrasive market share in 2025 and is on course for 4.02% CAGR to 2031. China’s vast automotive, electronics, and machinery sectors anchor demand, while national programs encouraging high-quality manufacturing are elevating precision grinding standards. Japan’s advanced electronics industry requires high-purity wheels, and South Korea’s semiconductor surge is lifting ultra-precision point consumption.
North America and Europe Rubber Bonded Abrasive Market
North America is witnessing a rebound as reshoring and defense investments spur the adoption of specialty wheels capable of processing advanced alloys. The United States is particularly active in integrating smart grinding solutions that tie rubber bonded wheel performance data into plant-wide digital twins. Europe shows steady demand but stands out for its leadership in low-VOC formulations to comply with stringent environmental frameworks.
MEA and South America Rubber Bonded Abrasive Market
South America and the Middle East and Africa trail in volume yet present upside potential. Brazil’s automotive rebuild and Gulf infrastructure megaprojects are spurring procurement of heavy-duty wheels. Technology transfer from global suppliers, coupled with foreign direct investment, is laying the foundation for local finishing capacity, positioning these regions for incremental uptake of rubber bonded products.
Regulatory Landscape
Regulation for rubber bonded abrasives is tightening around chemical content and workplace safety, with the EU and United States setting the dominant compliance benchmarks for global suppliers. In Europe, market access for bonded abrasives is closely tied to REACH (EC) No 1907/2006 substance controls and to product safety standards such as EN 12413:2019 for bonded abrasives. These requirements specify items such as marking (including maximum operating speed and dimensions) and safe-use information, and they are reinforcing the shift toward low-VOC rubber chemistries and improved substance traceability across the supply chain.
In the United States, abrasive wheel safety and use is primarily governed by OSHA, notably 29 CFR 1910.215 (Abrasive Wheel Machinery). This is commonly aligned with ANSI B7.1 practices for guarding and safe operation, while grinding-related exposure controls link to OSHA 29 CFR 1910.94 (ventilation) and 29 CFR 1910.134 (respiratory protection programs). Together, these rules shape wheel design and labeling, but they also influence end-user operating procedures and plant-level investments in dust capture and worker protection, affecting purchasing decisions for compliant wheels and documented formulations.
Value Chain Analysis
The rubber bonded abrasive value chain starts with upstream raw materials, mainly abrasive grains (such as aluminum oxide and silicon carbide), rubber binders (natural and synthetic rubber), and cure systems and additives (such as sulfur and processing aids). Manufacturing typically involves controlled mixing and kneading of grains and rubber compounds, forming into wheels, points, sticks, or segments, followed by curing or vulcanization (commonly cited in the 150-275 C range) and downstream finishing steps such as balancing, inspection, and packaging. Compliance-driven formulation work, including low-VOC curatives and restricted-substance screening, increasingly runs in parallel with process engineering as a core part of production.
Downstream, distribution moves through direct OEM supply (automotive, industrial machinery, electronics, and medical device finishing lines), industrial distributors, and application-engineering channels that provide grinding process support. Value capture tends to rise where suppliers offer application tuning for CNC and automation environments, documented conformity to EN and ANSI requirements, and stable delivery programs such as vendor-managed inventory used by large industrial buyers. Key market participants referenced include Saint-Gobain, 3M, Tyrolit, CUMI, and PFERD, while supply-side risk centers on price volatility in rubber feedstocks and on constraints around qualified producers for certain high-performance abrasive grain architectures.
Competitive Landscape
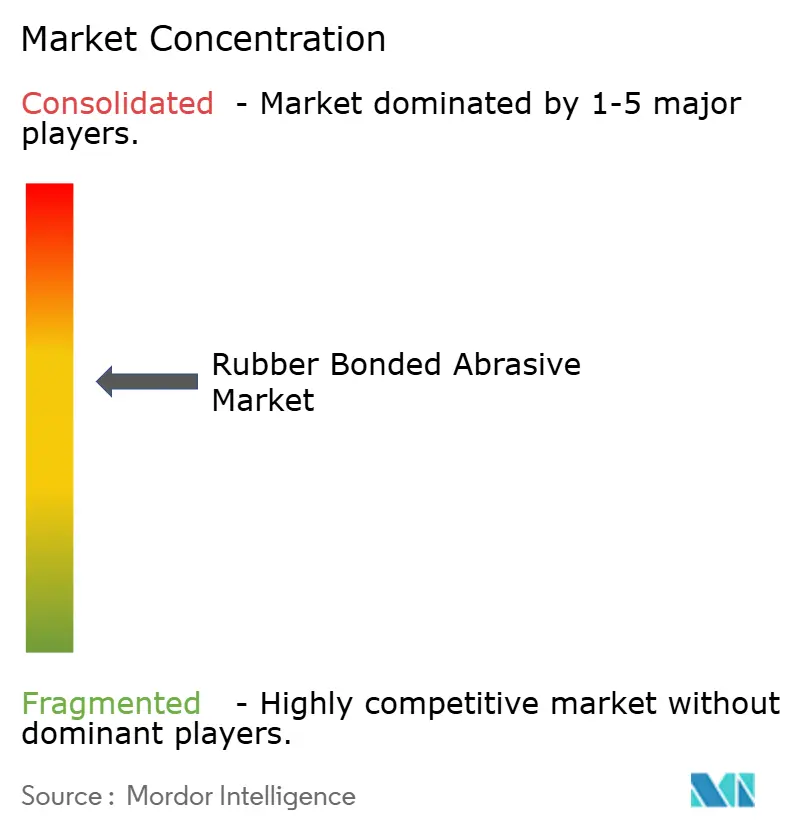
The Rubber Bonded Abrasive market is moderately consolidated with the presence of major players including Saint-Gobain, 3M, Tyrolit – Schleifmittelwerke Swarovski AG & Co KG, CUMI., and PFERD INC. Saint-Gobain, 3M, and CUMI leverage wide portfolios, proprietary compounds, and global logistics to defend share. R&D spending focuses on low-emission binders and wheels compatible with automated dresser systems. Partnerships between wheel suppliers and grinding-machine builders are emerging to offer turnkey performance guarantees. Regional producers capitalize on supply-chain disruptions by offering faster lead times and localized technical support. In North America and Europe, customers favor vendors that can assure raw material transparency and regulatory compliance.
Rubber Bonded Abrasive Industry Leaders
-
3M
-
PFERD INC.
-
CUMI.
-
Tyrolit – Schleifmittelwerke Swarovski AG & Co KG
-
Saint-Gobain
- *Disclaimer: Major Players sorted in no particular order
Rubber Bonded Abrasive Market Companies Covered in this Report
- 3M
- ABRASIVOS MANHATTAN S.A.
- Atto Abrasive Ltd.
- Buehler
- Buffalo Abrasives, Inc.
- CUMI.
- KINIK COMPANY
- Klingspor Abrasives, Inc.
- Marrose Abrasives
- Osborn
- Pacer Industries Inc.
- PFERD INC.
- Saint-Gobain
- Schwarzhaupt GmbH & Co. KG
- Tyrolit – Schleifmittelwerke Swarovski AG & Co KG
Market Opportunities and Future Outlook
Regulatory pressure and plant-level exposure controls are creating room for differentiated low-emission and compliance-forward rubber bond systems, particularly for suppliers that can document substance status for EU REACH and support end users operating under OSHA ventilation and respiratory-protection programs. The March 2025 move to stricter EU REACH requirements in the report context reinforces an immediate need for reformulation and supply-chain declarations, which aligns with the market shift toward low-VOC rubber chemistries highlighted in the overview. That combination supports demand for products positioned around traceable chemistries, consistent wear behavior for unattended CNC cycles, and validated performance in high-precision finishing where surface integrity matters.
Capacity additions and localization initiatives also provide a second opportunity lane, especially for suppliers matching manufacturing footprints to major consuming regions and OEM procurement expectations. CUMI commencing commercial production at its Hosur facility in March 2026 and doubling annual cutting and grinding wheel capacity (from 45 million to 90 million units) is a concrete signal of investment to scale bonded abrasive output for industrial and automotive demand centers. Alongside this, demand pull from precision applications cited in the report, including electronics and medical finishing (where points and sticks are the fastest-growing product type), supports opportunities for specialized rubber bonded formulations and geometries that fit automated grinding cells and additive-manufactured metal post-processing workflows.
Recent Industry Developments in Rubber Bonded Abrasive Market
- March 2026: Carborundum Universal Limited (CUMI) commenced commercial production at its Hosur facility, doubling its annual cutting and grinding wheel capacity from 45 million to 90 million units. The added output supports shorter lead times and broader product availability for bonded abrasive users in automotive and industrial grinding. Higher scale also strengthens CUMI's ability to supply large OEM programs that require consistent quality and reliable replenishment.
- March 2025: The European Union passed a new REACH regulation, setting stricter safety and environmental requirements relevant to rubber bonded abrasives and associated industrial products. The change raises compliance and documentation demands for manufacturers and importers selling into Europe. It also accelerates reformulation activity toward lower-emission and restricted-substance-compliant rubber bond chemistries.
- May 2024: Sak Abrasives Inc., a wholly owned subsidiary of Sak Industries Private Ltd., announced the acquisition of Jowitt & Rodgers Co., a producer of custom-designed bonded abrasives. The deal expanded Sak's access to engineered bonded abrasive capabilities and application-specific know-how. It also broadened the combined offering for customers that require tailored wheel and component designs for specialized grinding and finishing processes.
Rubber Bonded Abrasive Market Report Scope and Research Methodology
Market Definition and Coverage
This market is defined as revenue generated from rubber bonded abrasive products used for grinding, polishing, deburring, and precision finishing across industrial and OEM settings, counted at the point where the abrasive product is sold into the market.
Scope exclusions: We exclude aftermarket machine tools, non-rubber bond formats (such as vitrified or resin), and service labor tied to finishing operations.
Segments Covered in This Report
- By Product Type
- Wheels
- Points and Sticks
- Blocks and Segments
- Others
- By Rubber Type
- Natural Rubber
- Nitrile (NBR)
- Neoprene
- Other Rubber Types (Silicone, etc.)
- By Application
- Powertrain
- Gears
- Bearings
- Turbines
- Other Applications (Cutting and Forming Tools, etc.)
- By End-user Industry
- Industrial Machinery
- Automotive
- Electrical and Electronics
- Healthcare
- Other End-user Industries (Aerospace, etc.)
- By Geography
- Asia-Pacific
- China
- Japan
- India
- South Korea
- ASEAN Countries
- Rest of Asia-Pacific
- North America
- United States
- Canada
- Mexico
- Europe
- Germany
- United Kingdom
- France
- Italy
- Spain
- Russia
- NORDIC Countries
- Rest of Europe
- South America
- Brazil
- Argentina
- Rest of South America
- Middle East and Africa
- Saudi Arabia
- South Africa
- Rest of Middle East and Africa
- Asia-Pacific
Data Sources, Market Sizing, and Validation
Desk Research
Desk work started by setting the boundary around rubber bond products and mapping where demand is created, mainly in metalworking and precision parts finishing. To keep assumptions grounded, we used public sources such as USGS minerals and manufacturing statistics, UN Comtrade trade flows for abrasive-related codes, IEA industrial output indicators, World Bank macro series, and standards and technical notes from bodies such as ISO and OSHA where relevant.
We also reviewed annual reports, investor decks, and press releases from abrasive and industrial tooling suppliers to understand product mix, regional exposure, and pricing direction. Patent databases were checked to see where new rubber bond formulations and low-emission compounds are showing up, which helped us judge what part of demand is moving to higher value grades. These desk sources are not exhaustive, and we relied on additional public references for cross-checks, clarification, and data clean-up.
Primary Interviews and Surveys
Primary work focused on validating how rubber bonded abrasive wheels, points, and segments are priced and purchased, and how demand shifts with OEM output and maintenance cycles. We spoke with a mix of manufacturers, distributors, and industrial end users across APAC, EMEA, and the Americas, so gaps from desk findings could be closed and final assumptions could be confirmed before sign-off.
Distribution of primary research fieldwork respondents
| Company type | Respondent position | Region |
|---|---|---|
| Top tier: 29% | CXOs: 15% | APAC: 50% |
| Mid tier: 56% | Functional/Unit leaders: 42% | EMEA: 30% |
| Smaller Players: 15% | Managers: 43% | Americas: 20% |
Market-Sizing & Forecasting
Sizing began with a top-down build where industrial output and metalworking activity by region were translated into a demand pool for bonded abrasive consumption, and then narrowed to the share typically served by rubber bond formats. Once the total demand pool was formed, we tested it through selective bottom-up checks using sampled price bands and shipment volumes from manufacturers and channels, which helped adjust for under-coverage where disclosure is thin.
Key inputs that moved the model included automotive and industrial machinery production trends, capacity utilization in general manufacturing, trade intensity of abrasive products, the mix shift between wheels versus points and sticks, and average selling price movement tied to rubber inputs and performance-grade upgrades. Forecasting relied on scenario analysis supported by a simple regression view on industrial production and vehicle output, and then refinement based on what interviewees shared on expected price resets and customer buying behavior. Where a bottom-up approximation could not cover smaller local suppliers, the gap was handled through channel mark-up logic and region-level consumption ratios that were rechecked with distributors.
Data Validation & Update Cycle
Outputs were checked against independent signals such as regional manufacturing indices, import and export trends, and supplier commentary on volume and pricing. When a country or product line showed an unusual jump, we revisited assumptions and, where needed, re-contacted experts to confirm whether it was a real shift or a timing effect.
Before finalization, the model goes through multi-step internal review so input series, currency conversions, and calculation links are consistent and traceable. Reports are refreshed annually, and interim updates are triggered when material events occur, such as sharp raw material price changes or major demand shocks in key end-use industries. Right before delivery, a final data pass is done so clients receive the latest view that matches the stated year and currency timing.
Mordor Intelligence's Rubber Bonded Abrasive Market Size Measured Against Other Published Estimates
Published market values for rubber bonded abrasives can vary even when the topic sounds identical, because the boundary and timing choices are not always aligned. Differences usually come from what gets counted as rubber bond, how prices are averaged across grades, and whether the reported year matches the same currency conversion window.
In this study, pricing is refreshed using a consistent year-average currency timing and a product-mix weighted ASP logic, and then the totals are rechecked with distributor and end-user validation loops, which keeps the estimate aligned to real purchasing behavior, a refresh-led step applied by Mordor Intelligence.
Benchmark comparison
| Source | Market Size | Gaps in Research Methodology |
|---|---|---|
| Mordor Intelligence | USD 1.29 B (2025) | |
| Industry Publisher A | USD 1.27 B (2025) | Often stays closer to a narrow product read and may use a simpler average price assumption, which can slightly compress value when performance-grade mix is rising. |
| Research Distributor B | USD 1.43 B (2025) | Tends to publish a higher 2025 value that can be influenced by broader category inclusion and a more aggressive ASP progression, which can inflate totals if currency timing and mix checks are not aligned. |
The comparison shows that most of the spread is explained by scope edges and the way prices are carried forward across years, rather than by demand direction itself. By keeping inputs tied to observable industrial activity and then validating price and mix assumptions through channel feedback, we end up with a number that can be traced back to clear steps and repeated when new data arrives.
Key Questions Answered in the Report
What is the anticipated Global Rubber Bonded Abrasive market size in 2026?
The Rubber Bonded Abrasive market size is expected to reach USD 1.33 Billion in 2026.
Which region leads the Rubber Bonded Abrasive market and how fast is it growing?
Asia-Pacific leads with 39.25% share and is projected to post a 4.02% CAGR through 2031.
What product segment is expanding the quickest?
Points and sticks are rising at a 3.92% CAGR as precision finishing demand grows.
How are environmental regulations influencing product development?
Manufacturers are investing in low-VOC rubber formulations and emission-control systems to comply with stricter EPA and REACH standards.
Which end-user industry is growing fastest?
Healthcare is advancing at a 4.11% CAGR due to demand for precision-ground medical devices.