| Study Period | 2018 - 2030 |
| Base Year For Estimation | 2024 |
| Forecast Data Period | 2025 - 2030 |
| Market Size (2025) | USD 24.83 Billion |
| Market Size (2030) | USD 32.51 Billion |
| CAGR (2025 - 2030) | 5.54 % |
| Market Concentration | Medium |
Major Players*Disclaimer: Major Players sorted in no particular order |

Ready to Drink Coffee Market Analysis
The Ready to Drink Coffee Market size is estimated at 24.83 billion USD in 2025, and is expected to reach 32.51 billion USD by 2030, growing at a CAGR of 5.54% during the forecast period (2025-2030).
The Ready to Drink Coffee Industry is experiencing a significant transformation driven by evolving consumer preferences and lifestyle changes. The surge in urbanization and fast-paced lifestyles has created a strong demand for convenient, on-the-go beverage options. This shift is particularly evident in the rising adoption of digital platforms for beverage purchases, with global internet penetration reaching 5.3 billion users, representing 65.7% of the world's population as of October 2023. The digital transformation has revolutionized how consumers discover, purchase, and interact with RTD coffee products, leading to enhanced product visibility and accessibility across various channels.
Health consciousness has emerged as a pivotal factor shaping the RTD Coffee Market Growth, with manufacturers responding to the growing demand for healthier beverage alternatives. This trend is particularly significant given that the global diabetic population surpassed 537 million in 2022, prompting consumers to seek beverages with reduced sugar content and additional health benefits. Industry players are innovating with functional ingredients, sugar-free variants, and plant-based options to cater to health-conscious consumers while maintaining the convenience factor that RTD coffee is known for.
Generational preferences are playing a crucial role in shaping product development and marketing strategies within the Ready to Drink Coffee Industry. Recent consumer behavior studies reveal distinct preferences across age groups, with 43% of millennials and 38% of Gen Z consumers favoring iced coffee variants, compared to 24% of baby boomers in 2022. This generational divide has prompted manufacturers to develop targeted product offerings and marketing campaigns that resonate with younger consumers while maintaining traditional options for older demographics.
The industry is witnessing substantial investments in production capacity and innovation, particularly in key coffee-producing regions. A notable example is the Saudi Coffee Company's ambitious plan to invest approximately USD 320 million over the next decade to boost domestic coffee production from 300 to 2,500 tonnes annually. This trend of strategic investments extends beyond production to include packaging innovations, sustainable practices, and digital infrastructure development. Companies are increasingly focusing on sustainable sourcing practices and environmentally friendly packaging solutions to align with growing consumer awareness of environmental issues and demand for responsible production methods, reflecting broader Coffee Market Trends.
Global Ready to Drink Coffee Market Trends
The robust consumption of RTD coffee amongst all age groups across all the regions is propelling the market growth
- RTD coffee consumption is particularly high in the age group of 18 to 39-year consumers, mainly because of the caffeine content present in the beverage which makes it an ideal drink for an adult for an instant boost while engaging in their busy schedule. In 2022, nearly 176 million 60-kilogram bags of coffee were consumed worldwide, a slight increase from almost 167 million bags in the previous year.
- The flavor is one of the most significant attributes when it comes to buying RTD coffee. Different coffee blends and flavorings appeal to diverse tastes, ranging from classic black coffee to various flavored options like vanilla, hazelnut, caramel, and mocha among others. The Netherlands, being one of the major consumers of coffee, states that about 45% of the population prefers black coffee, while Australians prefer Latte and Cappuccino.
- Pricing is one of the crucial factors influencing the consumer’s RTD coffee buying behavior in the market. The quality of beans used in the production of RTD coffee beverage also impact the retail pricing of the product. The average price of arabica beans is USD 5.63 per kg whereas robusta is priced at USD 2.29 per kg in 2022. Other factors like packaging and production costs also influence the sales and pricing of RTD coffee.
- The consumption of RTD coffee is still price-driven, but consumers are interested in purchasing coffee with associated health claims. For instance, In 2022, 92% of coffee lovers in the United States stated that they gave high importance to coffee for the health benefits associated with it. Similarly, 76% of the Japanese population stated they consumed coffee as a healthy beverage in 2022.
Understand The Key Trends Shaping This Market
Download PDF
OTHER KEY INDUSTRY TRENDS COVERED IN THE REPORT
- There is a growing trend towards RTD Coffee products that offer fucntional benefits beyond caffeine
- Brands are continously innovating their RTD coffee formulations to offer a wide range of flavors, ingredients and functional benefits
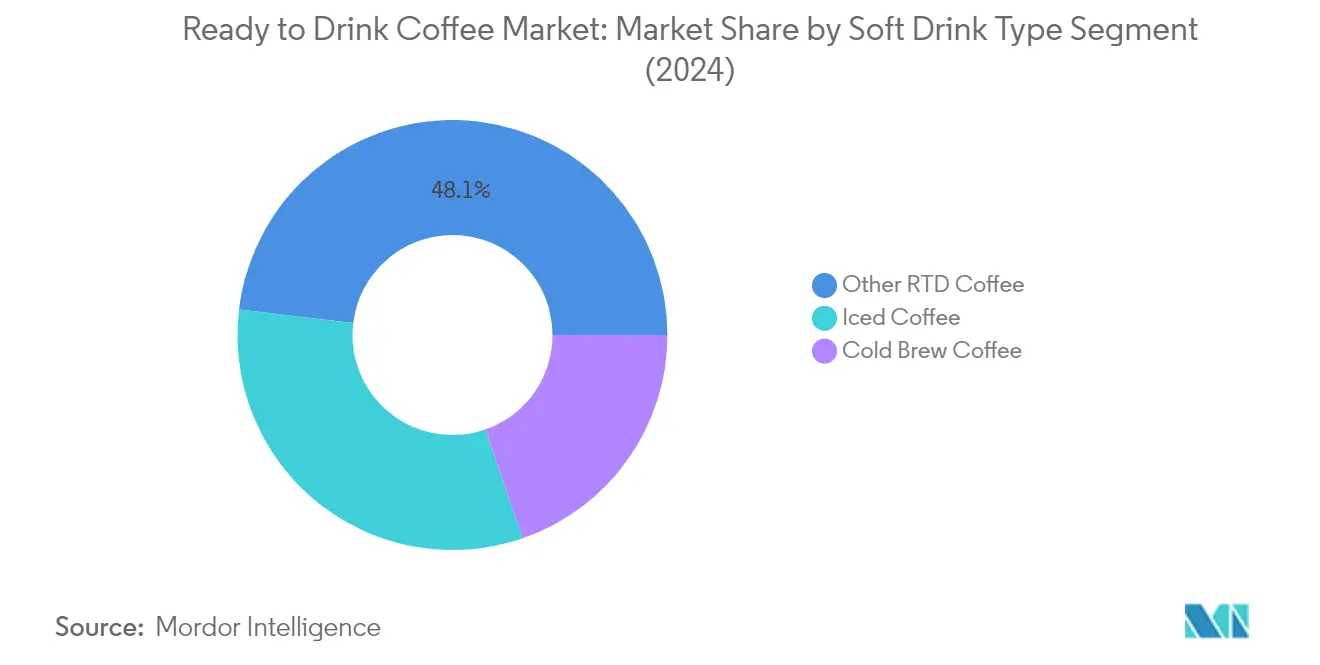
Segment Analysis: Soft Drink Type
Other RTD Coffee Segment in Ready to Drink Coffee Market
The Other RTD Coffee segment, which includes RTD flavored coffee and RTD dairy-free coffee, dominates the global ready-to-drink coffee market with approximately 48% market share in 2024. This segment's prominence is largely attributed to increasing consumer preference for innovative flavored coffees offered by manufacturers. Cannabis and marijuana-infused RTD coffee products are gaining significant popularity among youth, especially in developed markets like the United States, the United Kingdom, and Canada. The segment's growth is further supported by the rising prevalence of lactose intolerance and various food allergies, leading manufacturers to expand their portfolios with dairy-free alternatives. Major players like Starbucks, Costa, and Nestlé have been actively introducing RTD coffees made with alternative milk options such as soy, almond, coconut, hemp, and oats, helping them differentiate their offerings and gain a competitive advantage.
Cold Brew Coffee Segment in Ready to Drink Coffee Market
The cold brew coffee market is experiencing remarkable growth in the global RTD coffee market, projected to expand at approximately 6% CAGR from 2024 to 2029. This growth is primarily driven by consumers' increasing preference for healthier beverages coupled with the convenience of RTD offerings. Cold brew coffee's popularity stems from its lower acidity compared to hot brewed coffee and its inherent sweetness, making it particularly appealing to health-conscious consumers. The segment's growth is further bolstered by its unique production process, which involves crude polysaccharides known for their digestive benefits. Additionally, the declining popularity of sugar-sweetened beverages, driven by rising diabetes and obesity rates globally, is fueling a shift toward healthier alternatives like zero-sugar cold brew coffee.
Remaining Segments in Soft Drink Type
The iced coffee market segment represents a significant portion of the RTD coffee market, offering a wide array of flavors and variants. This segment caters to diverse consumer preferences through products like iced mocha, iced vanilla, iced caramel, and iced hazelnut, offered by major players including Coca-Cola Co, Starbucks, Dunkin' Iced Coffee, and Nestlé. The segment's appeal is particularly strong among younger consumers who prefer chilled coffee beverages over traditional hot coffee. Companies operating in this segment are continuously innovating with new flavors and formats, including shelf-stable and refrigerated variants that deliver cafe-quality experiences for both at-home and on-the-go consumption.
Segment Analysis: Packaging Type
Glass Bottles Segment in RTD Coffee Market
Glass bottles dominate the RTD coffee packaging market, commanding approximately 40% market share in 2024. This significant market position is attributed to glass bottles' superior ability to preserve product freshness and maintain the authentic taste of coffee beverages. The segment's popularity is further bolstered by the increasing consumer preference for sustainable packaging options, as glass bottles are infinitely recyclable and considered environmentally friendly. Major RTD coffee manufacturers are increasingly adopting glass bottle packaging due to its premium appeal and ability to enhance brand value through distinctive designs and shapes. The segment's growth is also supported by technological advancements in glass manufacturing that have improved durability while reducing weight and production costs.
PET Bottles Segment in RTD Coffee Market
The PET bottles segment is experiencing rapid growth in the RTD coffee packaging market, projected to expand at approximately 6% CAGR from 2024 to 2029. This growth is primarily driven by advancements in PET bottle materials, including enhanced transparency and improved barrier properties that extend product shelf life. The segment's expansion is further supported by innovations in post-consumer recycled (PCR) PET bottles, which align with growing environmental consciousness among consumers. Manufacturers are increasingly investing in sustainable PET packaging solutions, with many companies committing to achieving up to 50% PCR content in their bottles by 2030. The lightweight nature of PET bottles, combined with their cost-effectiveness and convenience in transportation and storage, makes them an increasingly attractive option for RTD coffee producers.
Remaining Segments in Packaging Type
Metal cans and aseptic packages complete the metal ready-to-drink coffee packaging landscape, each offering unique advantages to manufacturers and consumers. Metal cans are valued for their excellent barrier properties and ability to maintain beverage freshness, while also providing effective protection against light and oxygen. Aseptic packages, on the other hand, are gaining traction due to their lightweight nature and ability to preserve beverages without refrigeration. Both segments continue to evolve with technological advancements in materials and manufacturing processes, contributing to the overall growth of the RTD coffee market while meeting diverse consumer preferences and sustainability requirements.
Segment Analysis: Distribution Channel
Supermarkets/Hypermarkets Segment in RTD Coffee Market
Supermarkets and hypermarkets maintain their dominance in the RTD coffee distribution landscape, commanding approximately 34% of the global market share in 2024. This channel's prominence is attributed to its extensive shelf space and ability to showcase a diverse range of both local and international RTD coffee brands. These retail giants leverage their market position by offering seasonal promotions, bulk purchase discounts, and dedicated beverage sections that enhance product visibility. The success of this channel is further bolstered by its ability to maintain consistent product availability and temperature-controlled environments essential for RTD coffee storage. Additionally, supermarkets and hypermarkets benefit from their established relationships with major RTD coffee manufacturers, enabling them to offer competitive pricing and exclusive product launches that attract price-conscious consumers.
Online Retail Segment in RTD Coffee Market
The online retail channel is experiencing remarkable growth in the RTD coffee market, projected to achieve approximately 7% growth annually from 2024 to 2029. This surge is primarily driven by the increasing penetration of internet services and smartphones, with global internet users reaching 5.3 billion as of 2023. E-commerce platforms are revolutionizing RTD coffee distribution by offering comprehensive product information, including ingredients, nutritional facts, and customer reviews, enabling consumers to make informed purchasing decisions. The convenience of doorstep delivery, coupled with the ability to compare prices and access a wider variety of products, has made online retail particularly attractive to younger consumers. Furthermore, the channel's growth is supported by the rising adoption of digital payment solutions and the implementation of efficient last-mile delivery systems by e-commerce players.
Remaining Segments in Distribution Channel
The RTD coffee market's distribution landscape is further diversified through convenience stores, specialty stores, and on-trade channels, each serving distinct consumer needs and preferences. Convenience stores excel in capturing impulse purchases and serving on-the-go consumers with strategically placed RTD coffee products near checkout counters. Specialty stores differentiate themselves by offering premium and artisanal RTD coffee varieties, often accompanied by expert product knowledge and personalized customer service. The on-trade channel, encompassing cafes, restaurants, and food service establishments, plays a crucial role in introducing new RTD coffee variants and creating unique consumption experiences. These channels collectively contribute to the market's dynamic nature by catering to various consumer preferences and consumption occasions.
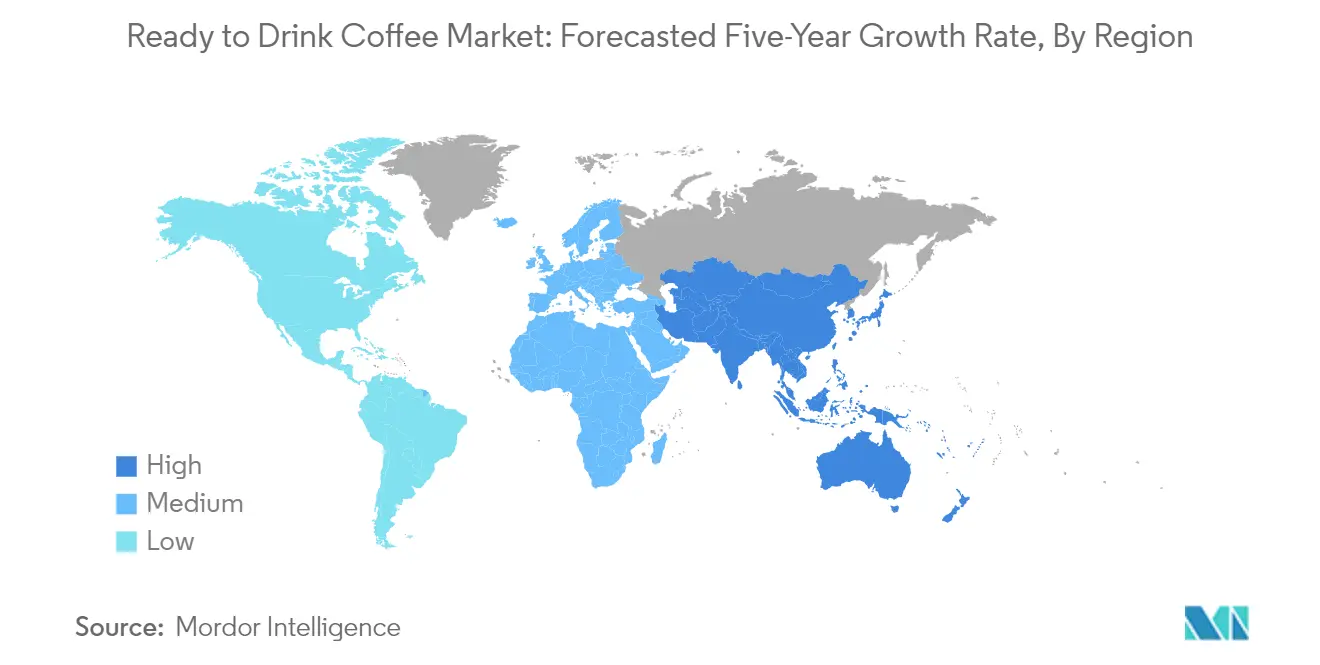
Ready to Drink Coffee Market Geography Segment Analysis
Ready to Drink Coffee Market in Africa
The African ready-to-drink coffee market demonstrates significant potential for growth, driven by an evolving young middle class and increasing appreciation for premium coffee beverages. The region's coffee consumption patterns are undergoing a transformation, particularly in urban areas where there is growing demand for high-quality, artisanal coffee products. Egypt, Nigeria, and South Africa represent the key markets in the region, each characterized by distinct consumer preferences and consumption patterns. The rise in disposable incomes among the middle class has contributed to this shift, particularly in urban centers where coffee culture is rapidly developing.
Ready to Drink Coffee Market in Egypt
Egypt leads the African RTD coffee market, demonstrating a strong market presence through its well-established distribution networks and growing consumer base. The country's RTD coffee sector benefits from a robust retail infrastructure and increasing consumer awareness about different coffee variants. The market is characterized by a strong presence of both international and local brands, with supermarkets and hypermarkets serving as primary distribution channels. Egypt commands approximately 39% share of the African RTD coffee market in 2024, reflecting its dominant position in the region.
Ready to Drink Coffee Market in Nigeria
Nigeria emerges as the fastest-growing market in Africa's RTD coffee market sector, driven by rapid urbanization and changing consumer preferences. The country's young population, particularly in urban areas, shows increasing interest in RTD coffee products, viewing them as convenient and modern beverage choices. The market benefits from expanding retail infrastructure and a growing presence of international coffee chains. Nigeria's RTD coffee market is projected to grow at approximately 18% annually from 2024 to 2029, supported by increasing disposable income and evolving consumer lifestyles.
Ready to Drink Coffee Market in Asia-Pacific
The Asia-Pacific region represents a dynamic market for ready-to-drink coffee, characterized by diverse consumer preferences and consumption patterns across different countries. The market is driven by rapid urbanization, increasing disposable incomes, and growing Western influence on beverage consumption habits. Countries like Japan, China, South Korea, and emerging markets such as India and Vietnam showcase varying levels of market maturity and growth potential. The region's coffee culture continues to evolve, with younger consumers particularly drawn to innovative RTD coffee products and formats.
Ready to Drink Coffee Market in Japan
Japan dominates the Asia-Pacific RTD coffee market with its sophisticated coffee culture and extensive product innovation. The country's market is characterized by a wide variety of RTD coffee products, ranging from traditional to premium offerings. Japanese consumers demonstrate strong brand loyalty and appreciation for quality, driving continuous product innovation and market expansion. Japan holds approximately 59% share of the Asia-Pacific RTD coffee market in 2024, underlining its position as the region's largest market.
Ready to Drink Coffee Market in Vietnam
Vietnam stands out as the fastest-growing market in the Asia-Pacific region, driven by its strong coffee-producing heritage and rapidly evolving consumer preferences. The country's RTD coffee sector benefits from increasing urbanization and a growing young population that embraces modern beverage formats. The market is projected to grow at approximately 16% annually from 2024 to 2029, supported by expanding retail infrastructure and an increasing presence of international coffee chains.
Ready to Drink Coffee Market in Europe
Europe's ready-to-drink coffee market showcases a mature yet dynamic landscape, characterized by sophisticated consumer preferences and strong coffee traditions. The region encompasses diverse markets including Germany, France, the United Kingdom, and emerging Eastern European countries, each with distinct consumption patterns and preferences. Innovation in product formulations and packaging, along with increasing health consciousness among consumers, drives market development across the region.
Ready to Drink Coffee Market in Germany
Germany leads the European RTD coffee market, leveraging its strong coffee culture and sophisticated retail infrastructure. The country's market is characterized by high product innovation and strong consumer awareness about different coffee variants. German consumers show particular interest in premium and organic RTD coffee products, driving market growth and product development.
Ready to Drink Coffee Market in Russia
Russia emerges as the fastest-growing market in Europe's RTD coffee sector, driven by changing consumer preferences and increasing adoption of Western coffee culture. The market benefits from expanding retail infrastructure and a growing presence of international coffee chains. Russian consumers, particularly in urban areas, show increasing interest in premium RTD coffee products and innovative flavors.
Ready to Drink Coffee Market in Middle East
The Middle Eastern RTD coffee market demonstrates strong growth potential, driven by a rich coffee tradition and evolving consumer preferences. The region encompasses key markets including Saudi Arabia, UAE, and Qatar, with varying levels of market maturity and growth potential. The United Arab Emirates leads in market size, while Qatar shows the fastest growth trajectory. The market benefits from high disposable incomes, growing tourism, and a strong presence of international coffee chains across the region.
Ready to Drink Coffee Market in North America
North America's RTD coffee market showcases robust growth, driven by strong coffee culture and innovative product offerings. The region, comprising the United States, Canada, and Mexico, demonstrates varying levels of market maturity and consumer preferences. The U.S. RTD coffee market leads in market size, while Mexico emerges as the fastest-growing market. The region benefits from well-established retail infrastructure, a strong presence of international coffee chains, and increasing consumer preference for convenient, on-the-go beverage options.
Ready to Drink Coffee Market in South America
South America's RTD coffee market leverages its rich coffee-producing heritage and evolving consumer preferences. The region, particularly Brazil and Argentina, demonstrates strong potential for RTD coffee products. Brazil leads both in market size and growth rate, benefiting from its position as the world's largest coffee producer and strong domestic consumption. The market is characterized by increasing urbanization, a growing middle-class population, and a strong presence of both local and international coffee brands.
Get Analysis on Important Geographic Markets
Download PDF
Ready to Drink Coffee Industry Overview
Top Companies in Ready-to-Drink Coffee Market
The ready-to-drink coffee market is characterized by intense competition among major beverage manufacturers who are actively pursuing product innovation and strategic expansion initiatives. Companies are focusing on developing specialized and personalized beverages, including options with reduced sugar content, increased protein, and fortification with vitamins and minerals. The trend toward dairy alternatives, such as oat milk, almond milk, and soy milk-based beverages, has become a key focus area for product development. Market leaders are expanding their geographical presence through strategic partnerships and acquisitions, particularly in emerging markets. Operational agility is demonstrated through investments in sustainable packaging solutions and the optimization of distribution networks. Companies are also leveraging digital marketing and e-commerce platforms to enhance their market reach and consumer engagement.
Market Dominated by Global Beverage Conglomerates
The ready-to-drink coffee market exhibits a relatively consolidated structure, dominated by multinational beverage companies with extensive distribution networks and strong brand portfolios. These major players leverage their established presence in the broader beverage industry to maintain their market positions through economies of scale, advanced research and development capabilities, and robust marketing strategies. The market is characterized by a mix of global beverage conglomerates and specialized coffee companies, with the former holding significant market share in the ready-to-drink coffee sector due to their superior financial resources and integrated supply chains.
The industry has witnessed considerable merger and acquisition activity, particularly involving larger companies acquiring smaller, innovative brands in the ready-to-drink coffee market to expand their product portfolios and reach new consumer segments. Strategic partnerships between beverage manufacturers and coffee chains have become increasingly common, allowing companies to leverage established brand equity and expand their market presence. Regional players maintain their relevance through local market expertise and targeted product offerings that cater to specific consumer preferences and taste profiles.
Innovation and Sustainability Drive Future Success
For incumbent companies to maintain and increase their market share, focus must be placed on continuous product innovation, sustainable packaging solutions, and enhanced distribution capabilities. Success factors include developing unique flavor profiles, incorporating functional ingredients, and addressing growing health consciousness among consumers. Companies need to invest in research and development to create differentiated products while maintaining cost competitiveness through efficient production processes and supply chain optimization. Building strong relationships with retailers and foodservice operators remains crucial for maintaining market presence and securing prime shelf space.
New entrants and challenger brands can gain ground by focusing on niche market segments and innovative product formulations that address specific consumer needs. Success in the ready-to-drink coffee industry increasingly depends on the ability to adapt to changing consumer preferences, particularly regarding health and sustainability concerns. Companies must navigate potential regulatory challenges related to packaging sustainability and product labeling while maintaining product quality and safety standards. The development of direct-to-consumer channels and strategic partnerships with established players can provide viable routes to market for emerging brands, while investment in sustainable practices and transparent supply chains can help build consumer trust and brand loyalty.
Ready to Drink Coffee Market Leaders
-
Kirin Holdings Company, Limited
-
Nestle S.A.
-
PepsiCo, Inc.
-
Suntory Holdings Limited
-
The Coca-Cola Company
- *Disclaimer: Major Players sorted in no particular order

Need More Details on Market Players and Competitors?
Download PDF
Ready to Drink Coffee Market News
- December 2023: Costa Coffee’s Moroccan franchisee Goldex Morocco has planned to launch five new outlets in Morocco by the end of Q3 2023 at a cost of USD m. Two will be in Casablanca, two in Rabat and the final outlet will be opened in Bouskoura.
- July 2023: Keurig Dr. Pepper Inc. announced a strategic partnership with La Colombe, including a long-term sales and distribution agreement for La Colombe's ready-to-drink coffee. Keurig Dr Pepper will also make an equity investment in La Colombe, enabling KDP to participate in the value creation upside expected from the partnership.
- July 2023: Nestlé Thailand has launched the new NESCAFÉ GOLD Creama Craft Latte and NESCAFÉ GOLD Creama Craft Americano in the RTD coffee category in Thailand.
Free With This Report
We provide a comprehensive and exhaustive set of data pointers for global, regional, and country-level metrics that illustrate the fundamentals of the soft drinks industry. With the help of 45+ free charts, clients can access in-depth market analysis based on price trend analysis of per capita spending on various soft drinks, through granular-level segmental information supported by a repository of market data, trends, and expert analysis. Data and analysis on soft drink category, packaging type, distribution channel insights into consumer preferences and purchasing patterns, an overview of key market players, etc., are available in the form of comprehensive reports as well as excel-based data worksheets.


Ready to Drink Coffee Market Report - Table of Contents
1. EXECUTIVE SUMMARY & KEY FINDINGS
2. REPORT OFFERS
3. INTRODUCTION
- 3.1 Study Assumptions & Market Definition
- 3.2 Scope of the Study
- 3.3 Research Methodology
4. KEY INDUSTRY TRENDS
- 4.1 Consumer Buying Behaviour
- 4.2 Innovations
- 4.3 Brand Share Analysis
- 4.4 Regulatory Framework
5. MARKET SEGMENTATION (includes market size in Value in USD and Volume, Forecasts up to 2030 and analysis of growth prospects)
-
5.1 Soft Drink Type
- 5.1.1 Cold Brew Coffee
- 5.1.2 Iced coffee
- 5.1.3 Other RTD Coffee
-
5.2 Packaging Type
- 5.2.1 Aseptic packages
- 5.2.2 Glass Bottles
- 5.2.3 Metal Can
- 5.2.4 PET Bottles
-
5.3 Distribution Channel
- 5.3.1 Off-trade
- 5.3.1.1 Convenience Stores
- 5.3.1.2 Online Retail
- 5.3.1.3 Specialty Stores
- 5.3.1.4 Supermarket/Hypermarket
- 5.3.1.5 Others
- 5.3.2 On-trade
-
5.4 Region
- 5.4.1 Africa
- 5.4.1.1 Egypt
- 5.4.1.2 Nigeria
- 5.4.1.3 South Africa
- 5.4.1.4 Rest of Africa
- 5.4.2 Asia-Pacific
- 5.4.2.1 Australia
- 5.4.2.2 China
- 5.4.2.3 India
- 5.4.2.4 Indonesia
- 5.4.2.5 Japan
- 5.4.2.6 Malaysia
- 5.4.2.7 South Korea
- 5.4.2.8 Thailand
- 5.4.2.9 Vietnam
- 5.4.2.10 Rest of Asia-Pacific
- 5.4.3 Europe
- 5.4.3.1 Belgium
- 5.4.3.2 France
- 5.4.3.3 Germany
- 5.4.3.4 Italy
- 5.4.3.5 Netherlands
- 5.4.3.6 Russia
- 5.4.3.7 Spain
- 5.4.3.8 Turkey
- 5.4.3.9 United Kingdom
- 5.4.3.10 Rest of Europe
- 5.4.4 Middle East
- 5.4.4.1 Qatar
- 5.4.4.2 Saudi Arabia
- 5.4.4.3 United Arab Emirates
- 5.4.4.4 Rest of Middle East
- 5.4.5 North America
- 5.4.5.1 Canada
- 5.4.5.2 Mexico
- 5.4.5.3 United States
- 5.4.5.4 Rest of North America
- 5.4.6 South America
- 5.4.6.1 Argentina
- 5.4.6.2 Brazil
- 5.4.6.3 Rest of South America
6. COMPETITIVE LANDSCAPE
- 6.1 Key Strategic Moves
- 6.2 Market Share Analysis
- 6.3 Company Landscape
-
6.4 Company Profiles
- 6.4.1 Arla Foods amba
- 6.4.2 Asahi Group Holdings, Ltd.
- 6.4.3 Danone S.A.
- 6.4.4 DyDo Group Holdings,Inc.
- 6.4.5 Emmi AG
- 6.4.6 Keurig Dr Pepper, Inc.
- 6.4.7 Kirin Holdings Company, Limited
- 6.4.8 Luigi Lavazza S.p.A.
- 6.4.9 Nestle S.A.
- 6.4.10 PepsiCo, Inc.
- 6.4.11 Rauch Fruchtsäfte GmbH & Co OG
- 6.4.12 Sodiaal Union
- 6.4.13 Suntory Holdings Limited
- 6.4.14 The Coca-Cola Company
- 6.4.15 Unilever PLC
- *List Not Exhaustive
7. KEY STRATEGIC QUESTIONS FOR SOFT DRINK CEOS
8. APPENDIX
-
8.1 Global Overview
- 8.1.1 Overview
- 8.1.2 Porter’s Five Forces Framework
- 8.1.3 Market Dynamics (DROs)
- 8.2 Sources & References
- 8.3 List of Tables & Figures
- 8.4 Primary Insights
- 8.5 Data Pack
- 8.6 Glossary of Terms
You Can Purchase Parts Of This Report. Check Out Prices For Specific Sections
Get Price Break-up Now
List of Tables & Figures
- Figure 1:
- CONSUMER BUYING BEHAVIOUR
- Figure 2:
- INNOVATIONS
- Figure 3:
- BRAND SHARE ANALYSIS
- Figure 4:
- VOLUME OF READY TO DRINK COFFEE MARKET, LITRES, GLOBAL, 2018 - 2030
- Figure 5:
- VALUE OF READY TO DRINK COFFEE MARKET, USD, GLOBAL, 2018 - 2030
- Figure 6:
- VOLUME OF READY TO DRINK COFFEE MARKET BY SOFT DRINK TYPE, LITRES, GLOBAL, 2018 - 2030
- Figure 7:
- VALUE OF READY TO DRINK COFFEE MARKET BY SOFT DRINK TYPE, USD, GLOBAL, 2018 - 2030
- Figure 8:
- VALUE SHARE OF READY TO DRINK COFFEE MARKET SPLIT BY SOFT DRINK TYPE, %, GLOBAL, 2018 VS 2024 VS 2030
- Figure 9:
- VOLUME SHARE OF READY TO DRINK COFFEE MARKET SPLIT BY SOFT DRINK TYPE, %, GLOBAL, 2018 VS 2024 VS 2030
- Figure 10:
- VOLUME OF COLD BREW COFFEE MARKET, LITRES, GLOBAL, 2018 - 2030
- Figure 11:
- VALUE OF COLD BREW COFFEE MARKET, USD, GLOBAL, 2018 - 2030
- Figure 12:
- VALUE SHARE OF COLD BREW COFFEE MARKET SPLIT BY PACKAGING TYPE, %, GLOBAL, 2023 VS 2030
- Figure 13:
- VOLUME OF ICED COFFEE MARKET, LITRES, GLOBAL, 2018 - 2030
- Figure 14:
- VALUE OF ICED COFFEE MARKET, USD, GLOBAL, 2018 - 2030
- Figure 15:
- VALUE SHARE OF ICED COFFEE MARKET SPLIT BY PACKAGING TYPE, %, GLOBAL, 2023 VS 2030
- Figure 16:
- VOLUME OF OTHER RTD COFFEE MARKET, LITRES, GLOBAL, 2018 - 2030
- Figure 17:
- VALUE OF OTHER RTD COFFEE MARKET, USD, GLOBAL, 2018 - 2030
- Figure 18:
- VALUE SHARE OF OTHER RTD COFFEE MARKET SPLIT BY PACKAGING TYPE, %, GLOBAL, 2023 VS 2030
- Figure 19:
- VOLUME OF READY TO DRINK COFFEE MARKET BY PACKAGING TYPE, LITRES, GLOBAL, 2018 - 2030
- Figure 20:
- VALUE OF READY TO DRINK COFFEE MARKET BY PACKAGING TYPE, USD, GLOBAL, 2018 - 2030
- Figure 21:
- VALUE SHARE OF READY TO DRINK COFFEE MARKET SPLIT BY PACKAGING TYPE, %, GLOBAL, 2018 VS 2024 VS 2030
- Figure 22:
- VOLUME SHARE OF READY TO DRINK COFFEE MARKET SPLIT BY PACKAGING TYPE, %, GLOBAL, 2018 VS 2024 VS 2030
- Figure 23:
- VOLUME OF READY TO DRINK COFFEE MARKET SOLD VIA ASEPTIC PACKAGES, LITRES, GLOBAL, 2018 - 2030
- Figure 24:
- VALUE OF READY TO DRINK COFFEE MARKET SOLD VIA ASEPTIC PACKAGES, USD, GLOBAL, 2018 - 2030
- Figure 25:
- VALUE SHARE OF READY TO DRINK COFFEE MARKET SOLD VIA ASEPTIC PACKAGES, SPLIT BY SOFT DRINK TYPE %, GLOBAL, 2023 VS 2030
- Figure 26:
- VOLUME OF READY TO DRINK COFFEE MARKET SOLD VIA GLASS BOTTLES, LITRES, GLOBAL, 2018 - 2030
- Figure 27:
- VALUE OF READY TO DRINK COFFEE MARKET SOLD VIA GLASS BOTTLES, USD, GLOBAL, 2018 - 2030
- Figure 28:
- VALUE SHARE OF READY TO DRINK COFFEE MARKET SOLD VIA GLASS BOTTLES, SPLIT BY SOFT DRINK TYPE %, GLOBAL, 2023 VS 2030
- Figure 29:
- VOLUME OF READY TO DRINK COFFEE MARKET SOLD VIA METAL CAN, LITRES, GLOBAL, 2018 - 2030
- Figure 30:
- VALUE OF READY TO DRINK COFFEE MARKET SOLD VIA METAL CAN, USD, GLOBAL, 2018 - 2030
- Figure 31:
- VALUE SHARE OF READY TO DRINK COFFEE MARKET SOLD VIA METAL CAN, SPLIT BY SOFT DRINK TYPE %, GLOBAL, 2023 VS 2030
- Figure 32:
- VOLUME OF READY TO DRINK COFFEE MARKET SOLD VIA PET BOTTLES, LITRES, GLOBAL, 2018 - 2030
- Figure 33:
- VALUE OF READY TO DRINK COFFEE MARKET SOLD VIA PET BOTTLES, USD, GLOBAL, 2018 - 2030
- Figure 34:
- VALUE SHARE OF READY TO DRINK COFFEE MARKET SOLD VIA PET BOTTLES, SPLIT BY SOFT DRINK TYPE %, GLOBAL, 2023 VS 2030
- Figure 35:
- VOLUME OF READY TO DRINK COFFEE MARKET BY DISTRIBUTION CHANNEL, LITRES, GLOBAL, 2018 - 2030
- Figure 36:
- VALUE OF READY TO DRINK COFFEE MARKET BY DISTRIBUTION CHANNEL, USD, GLOBAL, 2018 - 2030
- Figure 37:
- VALUE SHARE OF READY TO DRINK COFFEE MARKET SPLIT BY DISTRIBUTION CHANNEL, %, GLOBAL, 2018 VS 2024 VS 2030
- Figure 38:
- VOLUME SHARE OF READY TO DRINK COFFEE MARKET SPLIT BY DISTRIBUTION CHANNEL, %, GLOBAL, 2018 VS 2024 VS 2030
- Figure 39:
- VOLUME OF READY TO DRINK COFFEE MARKET SOLD VIA OFF-TRADE CHANNELS, LITRES, GLOBAL, 2018 - 2030
- Figure 40:
- VALUE OF READY TO DRINK COFFEE MARKET SOLD VIA OFF-TRADE CHANNELS, USD, GLOBAL, 2018 - 2030
- Figure 41:
- VALUE SHARE OF READY TO DRINK COFFEE MARKET SOLD VIA OFF-TRADE CHANNELS, %, GLOBAL, 2018 VS 2024 VS 2030
- Figure 42:
- VOLUME SHARE OF READY TO DRINK COFFEE MARKET SOLD VIA OFF-TRADE CHANNELS, %, GLOBAL, 2018 VS 2024 VS 2030
- Figure 43:
- VOLUME OF READY TO DRINK COFFEE MARKET SOLD VIA CONVENIENCE STORES, LITRES, GLOBAL, 2018 - 2030
- Figure 44:
- VALUE OF READY TO DRINK COFFEE MARKET SOLD VIA CONVENIENCE STORES, USD, GLOBAL, 2018 - 2030
- Figure 45:
- VALUE SHARE OF READY TO DRINK COFFEE MARKET SOLD VIA CONVENIENCE STORES SPLIT BY SOFT DRINK TYPE, %, GLOBAL, 2023 VS 2030
- Figure 46:
- VOLUME OF READY TO DRINK COFFEE MARKET SOLD VIA ONLINE RETAIL, LITRES, GLOBAL, 2018 - 2030
- Figure 47:
- VALUE OF READY TO DRINK COFFEE MARKET SOLD VIA ONLINE RETAIL, USD, GLOBAL, 2018 - 2030
- Figure 48:
- VALUE SHARE OF READY TO DRINK COFFEE MARKET SOLD VIA ONLINE RETAIL SPLIT BY SOFT DRINK TYPE, %, GLOBAL, 2023 VS 2030
- Figure 49:
- VOLUME OF READY TO DRINK COFFEE MARKET SOLD VIA SPECIALTY STORES, LITRES, GLOBAL, 2018 - 2030
- Figure 50:
- VALUE OF READY TO DRINK COFFEE MARKET SOLD VIA SPECIALTY STORES, USD, GLOBAL, 2018 - 2030
- Figure 51:
- VALUE SHARE OF READY TO DRINK COFFEE MARKET SOLD VIA SPECIALTY STORES SPLIT BY SOFT DRINK TYPE, %, GLOBAL, 2023 VS 2030
- Figure 52:
- VOLUME OF READY TO DRINK COFFEE MARKET SOLD VIA SUPERMARKET/HYPERMARKET, LITRES, GLOBAL, 2018 - 2030
- Figure 53:
- VALUE OF READY TO DRINK COFFEE MARKET SOLD VIA SUPERMARKET/HYPERMARKET, USD, GLOBAL, 2018 - 2030
- Figure 54:
- VALUE SHARE OF READY TO DRINK COFFEE MARKET SOLD VIA SUPERMARKET/HYPERMARKET SPLIT BY SOFT DRINK TYPE, %, GLOBAL, 2023 VS 2030
- Figure 55:
- VOLUME OF READY TO DRINK COFFEE MARKET SOLD VIA OTHER DISTRIBUTION CHANNEL, LITRES, GLOBAL, 2018 - 2030
- Figure 56:
- VALUE OF READY TO DRINK COFFEE MARKET SOLD VIA OTHER DISTRIBUTION CHANNEL, USD, GLOBAL, 2018 - 2030
- Figure 57:
- VALUE SHARE OF READY TO DRINK COFFEE MARKET SOLD VIA OTHERS SPLIT BY SOFT DRINK TYPE, %, GLOBAL, 2023 VS 2030
- Figure 58:
- VOLUME OF READY TO DRINK COFFEE MARKET SOLD VIA ON-TRADE CHANNEL, LITRES, GLOBAL, 2018 - 2030
- Figure 59:
- VALUE OF READY TO DRINK COFFEE MARKET SOLD VIA ON-TRADE CHANNEL, USD, GLOBAL, 2018 - 2030
- Figure 60:
- VALUE SHARE OF READY TO DRINK COFFEE MARKET SOLD VIA ON-TRADE CHANNEL, SPLIT BY SOFT DRINK TYPE, %, GLOBAL, 2023 VS 2030
- Figure 61:
- VOLUME OF READY TO DRINK COFFEE MARKET BY REGION, LITRES, GLOBAL, 2018 - 2030
- Figure 62:
- VALUE OF READY TO DRINK COFFEE MARKET BY REGION, USD, GLOBAL, 2018 - 2030
- Figure 63:
- VALUE SHARE OF READY TO DRINK COFFEE MARKET SPLIT BY REGION, %, GLOBAL, 2018 VS 2024 VS 2030
- Figure 64:
- VOLUME SHARE OF READY TO DRINK COFFEE MARKET SPLIT BY REGION, %, GLOBAL, 2018 VS 2024 VS 2030
- Figure 65:
- VOLUME OF READY TO DRINK COFFEE MARKET BY COUNTRY, LITRES, AFRICA, 2018 - 2030
- Figure 66:
- VALUE OF READY TO DRINK COFFEE MARKET BY COUNTRY, USD, AFRICA, 2018 - 2030
- Figure 67:
- VALUE SHARE OF READY TO DRINK COFFEE MARKET SPLIT BY COUNTRY, %, AFRICA, 2018 VS 2024 VS 2030
- Figure 68:
- VOLUME SHARE OF READY TO DRINK COFFEE MARKET SPLIT BY COUNTRY, %, AFRICA, 2018 VS 2024 VS 2030
- Figure 69:
- VOLUME OF RTD COFFEE MARKET, LITRES, EGYPT, 2018 - 2030
- Figure 70:
- VALUE OF RTD COFFEE MARKET, USD, EGYPT, 2018 - 2030
- Figure 71:
- VALUE SHARE OF READY TO DRINK COFFEE MARKET SPLIT BY SUB DISTRIBUTION CHANNEL, %, EGYPT, 2023 VS 2030
- Figure 72:
- VOLUME OF RTD COFFEE MARKET, LITRES, NIGERIA, 2018 - 2030
- Figure 73:
- VALUE OF RTD COFFEE MARKET, USD, NIGERIA, 2018 - 2030
- Figure 74:
- VALUE SHARE OF READY TO DRINK COFFEE MARKET SPLIT BY SUB DISTRIBUTION CHANNEL, %, NIGERIA, 2023 VS 2030
- Figure 75:
- VOLUME OF RTD COFFEE MARKET, LITRES, SOUTH AFRICA, 2018 - 2030
- Figure 76:
- VALUE OF RTD COFFEE MARKET, USD, SOUTH AFRICA, 2018 - 2030
- Figure 77:
- VALUE SHARE OF READY TO DRINK COFFEE MARKET SPLIT BY SUB DISTRIBUTION CHANNEL, %, SOUTH AFRICA, 2023 VS 2030
- Figure 78:
- VOLUME OF RTD COFFEE MARKET, LITRES, REST OF AFRICA, 2018 - 2030
- Figure 79:
- VALUE OF RTD COFFEE MARKET, USD, REST OF AFRICA, 2018 - 2030
- Figure 80:
- VALUE SHARE OF READY TO DRINK COFFEE MARKET SPLIT BY SUB DISTRIBUTION CHANNEL, %, REST OF AFRICA, 2023 VS 2030
- Figure 81:
- VOLUME OF READY TO DRINK COFFEE MARKET BY COUNTRY, LITRES, ASIA-PACIFIC, 2018 - 2030
- Figure 82:
- VALUE OF READY TO DRINK COFFEE MARKET BY COUNTRY, USD, ASIA-PACIFIC, 2018 - 2030
- Figure 83:
- VALUE SHARE OF READY TO DRINK COFFEE MARKET SPLIT BY COUNTRY, %, ASIA-PACIFIC, 2018 VS 2024 VS 2030
- Figure 84:
- VOLUME SHARE OF READY TO DRINK COFFEE MARKET SPLIT BY COUNTRY, %, ASIA-PACIFIC, 2018 VS 2024 VS 2030
- Figure 85:
- VOLUME OF RTD COFFEE MARKET, LITRES, AUSTRALIA, 2018 - 2030
- Figure 86:
- VALUE OF RTD COFFEE MARKET, USD, AUSTRALIA, 2018 - 2030
- Figure 87:
- VALUE SHARE OF READY TO DRINK COFFEE MARKET SPLIT BY SUB DISTRIBUTION CHANNEL, %, AUSTRALIA, 2023 VS 2030
- Figure 88:
- VOLUME OF RTD COFFEE MARKET, LITRES, CHINA, 2018 - 2030
- Figure 89:
- VALUE OF RTD COFFEE MARKET, USD, CHINA, 2018 - 2030
- Figure 90:
- VALUE SHARE OF READY TO DRINK COFFEE MARKET SPLIT BY SUB DISTRIBUTION CHANNEL, %, CHINA, 2023 VS 2030
- Figure 91:
- VOLUME OF RTD COFFEE MARKET, LITRES, INDIA, 2018 - 2030
- Figure 92:
- VALUE OF RTD COFFEE MARKET, USD, INDIA, 2018 - 2030
- Figure 93:
- VALUE SHARE OF READY TO DRINK COFFEE MARKET SPLIT BY SUB DISTRIBUTION CHANNEL, %, INDIA, 2023 VS 2030
- Figure 94:
- VOLUME OF RTD COFFEE MARKET, LITRES, INDONESIA, 2018 - 2030
- Figure 95:
- VALUE OF RTD COFFEE MARKET, USD, INDONESIA, 2018 - 2030
- Figure 96:
- VALUE SHARE OF READY TO DRINK COFFEE MARKET SPLIT BY SUB DISTRIBUTION CHANNEL, %, INDONESIA, 2023 VS 2030
- Figure 97:
- VOLUME OF RTD COFFEE MARKET, LITRES, JAPAN, 2018 - 2030
- Figure 98:
- VALUE OF RTD COFFEE MARKET, USD, JAPAN, 2018 - 2030
- Figure 99:
- VALUE SHARE OF READY TO DRINK COFFEE MARKET SPLIT BY SUB DISTRIBUTION CHANNEL, %, JAPAN, 2023 VS 2030
- Figure 100:
- VOLUME OF RTD COFFEE MARKET, LITRES, MALAYSIA, 2018 - 2030
- Figure 101:
- VALUE OF RTD COFFEE MARKET, USD, MALAYSIA, 2018 - 2030
- Figure 102:
- VALUE SHARE OF READY TO DRINK COFFEE MARKET SPLIT BY SUB DISTRIBUTION CHANNEL, %, MALAYSIA, 2023 VS 2030
- Figure 103:
- VOLUME OF RTD COFFEE MARKET, LITRES, SOUTH KOREA, 2018 - 2030
- Figure 104:
- VALUE OF RTD COFFEE MARKET, USD, SOUTH KOREA, 2018 - 2030
- Figure 105:
- VALUE SHARE OF READY TO DRINK COFFEE MARKET SPLIT BY SUB DISTRIBUTION CHANNEL, %, SOUTH KOREA, 2023 VS 2030
- Figure 106:
- VOLUME OF RTD COFFEE MARKET, LITRES, THAILAND, 2018 - 2030
- Figure 107:
- VALUE OF RTD COFFEE MARKET, USD, THAILAND, 2018 - 2030
- Figure 108:
- VALUE SHARE OF READY TO DRINK COFFEE MARKET SPLIT BY SUB DISTRIBUTION CHANNEL, %, THAILAND, 2023 VS 2030
- Figure 109:
- VOLUME OF RTD COFFEE MARKET, LITRES, VIETNAM, 2018 - 2030
- Figure 110:
- VALUE OF RTD COFFEE MARKET, USD, VIETNAM, 2018 - 2030
- Figure 111:
- VALUE SHARE OF READY TO DRINK COFFEE MARKET SPLIT BY SUB DISTRIBUTION CHANNEL, %, VIETNAM, 2023 VS 2030
- Figure 112:
- VOLUME OF RTD COFFEE MARKET, LITRES, REST OF ASIA-PACIFIC, 2018 - 2030
- Figure 113:
- VALUE OF RTD COFFEE MARKET, USD, REST OF ASIA-PACIFIC, 2018 - 2030
- Figure 114:
- VALUE SHARE OF READY TO DRINK COFFEE MARKET SPLIT BY SUB DISTRIBUTION CHANNEL, %, REST OF ASIA-PACIFIC, 2023 VS 2030
- Figure 115:
- VOLUME OF READY TO DRINK COFFEE MARKET BY COUNTRY, LITRES, EUROPE, 2018 - 2030
- Figure 116:
- VALUE OF READY TO DRINK COFFEE MARKET BY COUNTRY, USD, EUROPE, 2018 - 2030
- Figure 117:
- VALUE SHARE OF READY TO DRINK COFFEE MARKET SPLIT BY COUNTRY, %, EUROPE, 2018 VS 2024 VS 2030
- Figure 118:
- VOLUME SHARE OF READY TO DRINK COFFEE MARKET SPLIT BY COUNTRY, %, EUROPE, 2018 VS 2024 VS 2030
- Figure 119:
- VOLUME OF RTD COFFEE MARKET, LITRES, BELGIUM, 2018 - 2030
- Figure 120:
- VALUE OF RTD COFFEE MARKET, USD, BELGIUM, 2018 - 2030
- Figure 121:
- VALUE SHARE OF READY TO DRINK COFFEE MARKET SPLIT BY SUB DISTRIBUTION CHANNEL, %, BELGIUM, 2023 VS 2030
- Figure 122:
- VOLUME OF RTD COFFEE MARKET, LITRES, FRANCE, 2018 - 2030
- Figure 123:
- VALUE OF RTD COFFEE MARKET, USD, FRANCE, 2018 - 2030
- Figure 124:
- VALUE SHARE OF READY TO DRINK COFFEE MARKET SPLIT BY SUB DISTRIBUTION CHANNEL, %, FRANCE, 2023 VS 2030
- Figure 125:
- VOLUME OF RTD COFFEE MARKET, LITRES, GERMANY, 2018 - 2030
- Figure 126:
- VALUE OF RTD COFFEE MARKET, USD, GERMANY, 2018 - 2030
- Figure 127:
- VALUE SHARE OF READY TO DRINK COFFEE MARKET SPLIT BY SUB DISTRIBUTION CHANNEL, %, GERMANY, 2023 VS 2030
- Figure 128:
- VOLUME OF RTD COFFEE MARKET, LITRES, ITALY, 2018 - 2030
- Figure 129:
- VALUE OF RTD COFFEE MARKET, USD, ITALY, 2018 - 2030
- Figure 130:
- VALUE SHARE OF READY TO DRINK COFFEE MARKET SPLIT BY SUB DISTRIBUTION CHANNEL, %, ITALY, 2023 VS 2030
- Figure 131:
- VOLUME OF RTD COFFEE MARKET, LITRES, NETHERLANDS, 2018 - 2030
- Figure 132:
- VALUE OF RTD COFFEE MARKET, USD, NETHERLANDS, 2018 - 2030
- Figure 133:
- VALUE SHARE OF READY TO DRINK COFFEE MARKET SPLIT BY SUB DISTRIBUTION CHANNEL, %, NETHERLANDS, 2023 VS 2030
- Figure 134:
- VOLUME OF RTD COFFEE MARKET, LITRES, RUSSIA, 2018 - 2030
- Figure 135:
- VALUE OF RTD COFFEE MARKET, USD, RUSSIA, 2018 - 2030
- Figure 136:
- VALUE SHARE OF READY TO DRINK COFFEE MARKET SPLIT BY SUB DISTRIBUTION CHANNEL, %, RUSSIA, 2023 VS 2030
- Figure 137:
- VOLUME OF RTD COFFEE MARKET, LITRES, SPAIN, 2018 - 2030
- Figure 138:
- VALUE OF RTD COFFEE MARKET, USD, SPAIN, 2018 - 2030
- Figure 139:
- VALUE SHARE OF READY TO DRINK COFFEE MARKET SPLIT BY SUB DISTRIBUTION CHANNEL, %, SPAIN, 2023 VS 2030
- Figure 140:
- VOLUME OF RTD COFFEE MARKET, LITRES, TURKEY, 2018 - 2030
- Figure 141:
- VALUE OF RTD COFFEE MARKET, USD, TURKEY, 2018 - 2030
- Figure 142:
- VALUE SHARE OF READY TO DRINK COFFEE MARKET SPLIT BY SUB DISTRIBUTION CHANNEL, %, TURKEY, 2023 VS 2030
- Figure 143:
- VOLUME OF RTD COFFEE MARKET, LITRES, UNITED KINGDOM, 2018 - 2030
- Figure 144:
- VALUE OF RTD COFFEE MARKET, USD, UNITED KINGDOM, 2018 - 2030
- Figure 145:
- VALUE SHARE OF READY TO DRINK COFFEE MARKET SPLIT BY SUB DISTRIBUTION CHANNEL, %, UNITED KINGDOM, 2023 VS 2030
- Figure 146:
- VOLUME OF RTD COFFEE MARKET, LITRES, REST OF EUROPE, 2018 - 2030
- Figure 147:
- VALUE OF RTD COFFEE MARKET, USD, REST OF EUROPE, 2018 - 2030
- Figure 148:
- VALUE SHARE OF READY TO DRINK COFFEE MARKET SPLIT BY SUB DISTRIBUTION CHANNEL, %, REST OF EUROPE, 2023 VS 2030
- Figure 149:
- VOLUME OF READY TO DRINK COFFEE MARKET BY COUNTRY, LITRES, MIDDLE EAST, 2018 - 2030
- Figure 150:
- VALUE OF READY TO DRINK COFFEE MARKET BY COUNTRY, USD, MIDDLE EAST, 2018 - 2030
- Figure 151:
- VALUE SHARE OF READY TO DRINK COFFEE MARKET SPLIT BY COUNTRY, %, MIDDLE EAST, 2018 VS 2024 VS 2030
- Figure 152:
- VOLUME SHARE OF READY TO DRINK COFFEE MARKET SPLIT BY COUNTRY, %, MIDDLE EAST, 2018 VS 2024 VS 2030
- Figure 153:
- VOLUME OF RTD COFFEE MARKET, LITRES, QATAR, 2018 - 2030
- Figure 154:
- VALUE OF RTD COFFEE MARKET, USD, QATAR, 2018 - 2030
- Figure 155:
- VALUE SHARE OF READY TO DRINK COFFEE MARKET SPLIT BY SUB DISTRIBUTION CHANNEL, %, QATAR, 2023 VS 2030
- Figure 156:
- VOLUME OF RTD COFFEE MARKET, LITRES, SAUDI ARABIA, 2018 - 2030
- Figure 157:
- VALUE OF RTD COFFEE MARKET, USD, SAUDI ARABIA, 2018 - 2030
- Figure 158:
- VALUE SHARE OF READY TO DRINK COFFEE MARKET SPLIT BY SUB DISTRIBUTION CHANNEL, %, SAUDI ARABIA, 2023 VS 2030
- Figure 159:
- VOLUME OF RTD COFFEE MARKET, LITRES, UNITED ARAB EMIRATES, 2018 - 2030
- Figure 160:
- VALUE OF RTD COFFEE MARKET, USD, UNITED ARAB EMIRATES, 2018 - 2030
- Figure 161:
- VALUE SHARE OF READY TO DRINK COFFEE MARKET SPLIT BY SUB DISTRIBUTION CHANNEL, %, UNITED ARAB EMIRATES, 2023 VS 2030
- Figure 162:
- VOLUME OF RTD COFFEE MARKET, LITRES, REST OF MIDDLE EAST, 2018 - 2030
- Figure 163:
- VALUE OF RTD COFFEE MARKET, USD, REST OF MIDDLE EAST, 2018 - 2030
- Figure 164:
- VALUE SHARE OF READY TO DRINK COFFEE MARKET SPLIT BY SUB DISTRIBUTION CHANNEL, %, REST OF MIDDLE EAST, 2023 VS 2030
- Figure 165:
- VOLUME OF READY TO DRINK COFFEE MARKET BY COUNTRY, LITRES, NORTH AMERICA, 2018 - 2030
- Figure 166:
- VALUE OF READY TO DRINK COFFEE MARKET BY COUNTRY, USD, NORTH AMERICA, 2018 - 2030
- Figure 167:
- VALUE SHARE OF READY TO DRINK COFFEE MARKET SPLIT BY COUNTRY, %, NORTH AMERICA, 2018 VS 2024 VS 2030
- Figure 168:
- VOLUME SHARE OF READY TO DRINK COFFEE MARKET SPLIT BY COUNTRY, %, NORTH AMERICA, 2018 VS 2024 VS 2030
- Figure 169:
- VOLUME OF RTD COFFEE MARKET, LITRES, CANADA, 2018 - 2030
- Figure 170:
- VALUE OF RTD COFFEE MARKET, USD, CANADA, 2018 - 2030
- Figure 171:
- VALUE SHARE OF READY TO DRINK COFFEE MARKET SPLIT BY SUB DISTRIBUTION CHANNEL, %, CANADA, 2023 VS 2030
- Figure 172:
- VOLUME OF RTD COFFEE MARKET, LITRES, MEXICO, 2018 - 2030
- Figure 173:
- VALUE OF RTD COFFEE MARKET, USD, MEXICO, 2018 - 2030
- Figure 174:
- VALUE SHARE OF READY TO DRINK COFFEE MARKET SPLIT BY SUB DISTRIBUTION CHANNEL, %, MEXICO, 2023 VS 2030
- Figure 175:
- VOLUME OF RTD COFFEE MARKET, LITRES, UNITED STATES, 2018 - 2030
- Figure 176:
- VALUE OF RTD COFFEE MARKET, USD, UNITED STATES, 2018 - 2030
- Figure 177:
- VALUE SHARE OF READY TO DRINK COFFEE MARKET SPLIT BY SUB DISTRIBUTION CHANNEL, %, UNITED STATES, 2023 VS 2030
- Figure 178:
- VOLUME OF RTD COFFEE MARKET, LITRES, REST OF NORTH AMERICA, 2018 - 2030
- Figure 179:
- VALUE OF RTD COFFEE MARKET, USD, REST OF NORTH AMERICA, 2018 - 2030
- Figure 180:
- VALUE SHARE OF READY TO DRINK COFFEE MARKET SPLIT BY SUB DISTRIBUTION CHANNEL, %, REST OF NORTH AMERICA, 2023 VS 2030
- Figure 181:
- VOLUME OF READY TO DRINK COFFEE MARKET BY COUNTRY, LITRES, SOUTH AMERICA, 2018 - 2030
- Figure 182:
- VALUE OF READY TO DRINK COFFEE MARKET BY COUNTRY, USD, SOUTH AMERICA, 2018 - 2030
- Figure 183:
- VALUE SHARE OF READY TO DRINK COFFEE MARKET SPLIT BY COUNTRY, %, SOUTH AMERICA, 2018 VS 2024 VS 2030
- Figure 184:
- VOLUME SHARE OF READY TO DRINK COFFEE MARKET SPLIT BY COUNTRY, %, SOUTH AMERICA, 2018 VS 2024 VS 2030
- Figure 185:
- VOLUME OF RTD COFFEE MARKET, LITRES, ARGENTINA, 2018 - 2030
- Figure 186:
- VALUE OF RTD COFFEE MARKET, USD, ARGENTINA, 2018 - 2030
- Figure 187:
- VALUE SHARE OF READY TO DRINK COFFEE MARKET SPLIT BY SUB DISTRIBUTION CHANNEL, %, ARGENTINA, 2023 VS 2030
- Figure 188:
- VOLUME OF RTD COFFEE MARKET, LITRES, BRAZIL, 2018 - 2030
- Figure 189:
- VALUE OF RTD COFFEE MARKET, USD, BRAZIL, 2018 - 2030
- Figure 190:
- VALUE SHARE OF READY TO DRINK COFFEE MARKET SPLIT BY SUB DISTRIBUTION CHANNEL, %, BRAZIL, 2023 VS 2030
- Figure 191:
- VOLUME OF RTD COFFEE MARKET, LITRES, REST OF SOUTH AMERICA, 2018 - 2030
- Figure 192:
- VALUE OF RTD COFFEE MARKET, USD, REST OF SOUTH AMERICA, 2018 - 2030
- Figure 193:
- VALUE SHARE OF READY TO DRINK COFFEE MARKET SPLIT BY SUB DISTRIBUTION CHANNEL, %, REST OF SOUTH AMERICA, 2023 VS 2030
- Figure 194:
- MOST ACTIVE COMPANIES BY NUMBER OF STRATEGIC MOVES, COUNT, GLOBAL, 2020 - 2023
- Figure 195:
- MOST ADOPTED STRATEGIES, COUNT, GLOBAL, 2020 - 2023
- Figure 196:
- VALUE SHARE OF MAJOR PLAYERS, %, GLOBAL
Ready to Drink Coffee Industry Segmentation
Cold Brew Coffee, Iced coffee are covered as segments by Soft Drink Type. Aseptic packages, Glass Bottles, Metal Can, PET Bottles are covered as segments by Packaging Type. Off-trade, On-trade are covered as segments by Distribution Channel. Africa, Asia-Pacific, Europe, Middle East, North America, South America are covered as segments by Region.| Soft Drink Type | Cold Brew Coffee | ||
| Iced coffee | |||
| Other RTD Coffee | |||
| Packaging Type | Aseptic packages | ||
| Glass Bottles | |||
| Metal Can | |||
| PET Bottles | |||
| Distribution Channel | Off-trade | Convenience Stores | |
| Online Retail | |||
| Specialty Stores | |||
| Supermarket/Hypermarket | |||
| Others | |||
| On-trade | |||
| Region | Africa | Egypt | |
| Nigeria | |||
| South Africa | |||
| Rest of Africa | |||
| Asia-Pacific | Australia | ||
| China | |||
| India | |||
| Indonesia | |||
| Japan | |||
| Malaysia | |||
| South Korea | |||
| Thailand | |||
| Vietnam | |||
| Rest of Asia-Pacific | |||
| Europe | Belgium | ||
| France | |||
| Germany | |||
| Italy | |||
| Netherlands | |||
| Russia | |||
| Spain | |||
| Turkey | |||
| United Kingdom | |||
| Rest of Europe | |||
| Middle East | Qatar | ||
| Saudi Arabia | |||
| United Arab Emirates | |||
| Rest of Middle East | |||
| North America | Canada | ||
| Mexico | |||
| United States | |||
| Rest of North America | |||
| South America | Argentina | ||
| Brazil | |||
| Rest of South America | |||
Need A Different Region or Segment?
Customize Now
Market Definition
- Carbonated Soft Drinks (CSDs) - Carbonated soft drinks (CSDs) refer to non-alcoholic beverages that are carbonated and typically flavored, containing dissolved carbon dioxide to create effervescence. These beverages commonly include cola, lemon-lime, orange, and various fruit-flavored sodas. Marketed in cans, bottles, or fountain dispense.
- Juices - We have considered packaged juices which encompass non-alcoholic beverages derived from fruits, vegetables, or a combination thereof, processed and sealed in various packaging formats such as bottles, cartons, or pouches. Excluding fresh juices, this market segment involves commercially prepared and preserved juices, often with added preservatives and flavors.
- Ready-to-Drink (RTD) Tea and RTD Coffee - Ready-to-Drink (RTD) tea and RTD coffee are pre-packaged, non-alcoholic beverages that are brewed and prepared for consumption without further dilution. RTD tea typically includes various tea varieties, infused with flavors and sweeteners, and comes in bottles, cans, or cartons. Similarly, RTD coffee involves pre-brewed coffee formulations, often mixed with milk, sugar, or flavorings, and is conveniently packaged for on-the-go consumption.
- Energy Drinks - Energy drinks are non-alcoholic beverages formulated to provide a quick boost of energy and alertness. Whereas, sports drinks are beverages designed to hydrate and replenish electrolytes, particularly after physical exertion, exercise, or intense activity
| Keyword | Definition |
|---|---|
| Carbonated Soft Drinks | Carbonated soft drinks (CSDs) are a combination of carbonated water and flavouring, sweetened by sugar or a non-sugar sweeteners. |
| Standard Cola | Standard Cola is defined as the original flavor of cola soda. |
| Diet Cola | A cola-based soft drink containing no or low amounts of sugar |
| Fruit Flavored Carbonates | A carbonated beverage prepared from fruit juice/fruit flavor with carbonated water and containing sugar, dextrose, invert sugar or liquid glucose either singly or in combination. It may contain peel oil and fruit essences. |
| Juice | Juice is a drink made from the extraction or pressing of the natural liquid contained in fruit and vegetables. |
| 100% Juice | Fruit/vegetable juice made from fruit in the form of its juice with no water added to make up the volume. It is not permitted to add sugars, sweeteners, preservatives, flavourings or colourings to fruit juice. |
| Juice Drinks (up to 24% Juice) | Fruit/vegetable juice drinks with up to 24% fruits/vegetable extract. |
| Nectars (25-99% Juice) | Juices that can have between 25 and 99% of fruit, with the minimum legal limits defined depending on the type of fruit |
| Juice concentrates | Juice Concentrates are those form of juices when most of this liquid is removed resulting in a thick, syrupy product known as juice concentrate. |
| RTD Coffee | Packaged coffee beverages that are sold in a prepared form and are ready for consumption at the time of purchase. |
| Iced Coffee | An iced coffee is a cold version of coffee, usually a combination of hot espresso and milk with ice added to it. |
| Cold Brew Coffee | Cold brew also called cold water extraction or cold pressing is made by steeping ground coffee in room-temperature water for several hours. |
| RTD Tea | Ready-to-drink (RTD) tea is a packaged tea product ready for immediate consumption without brewing or preparation |
| Iced Tea | Ice tea or iced tea is a drink made from tea without milk but with sugar and sometimes fruit flavourings, drunk cold. |
| Green Tea | Green tea is a tea beverage which promotes mental alertness, relieving digestive symptoms and promoting weight loss. |
| Herbal Tea | Herbal tea beverages are made from the infusion or decoction of herbs, spices, or other plant material in hot water. |
| Energy Drink | A type of drink containing stimulant compounds, usually caffeine, which is marketed as providing mental and physical stimulation. They may or may not be carbonated and may also contain sugar, other sweeteners, or herbal extracts, among numerous possible ingredients. |
| Sugar-free or Low-calories Energy Drinks | Sugar-free or Low-calories Energy Drinks are sugar-free, artificially sweetened energy drinks with few or no calories. |
| Traditional Energy Drink | Traditional Energy Drinks are functional soft drinks containing ingredients designed to boost the consumer's energy. |
| Natural/Oraganic Energy Drinks | Natural/Organic energy drinks are energy drinks free of artificial sweeteners and synthetic colorings. Instead, they contain naturally derived ingredients such as green tea, yerba mate, and botanical extracts. |
| Energy Shots | A small but highly concentrated energy drink that contains large amounts of caffeine and/or other stimulants. The quantity is comparatively smaller compared to energy drinks. |
| Sports Drink | Sports drinks are beverages designed specifically for the rapid supply of fluid, carbohydrates, and electrolytes before, during or after exercise. |
| Isotonic | Isotonic drinks contain similar concentrations of salt and sugar as in the human body, and are designed to quickly replace fluids lost during exercise but with an increase of carbohydrate. |
| Hypertonic | Hypertonic drinks have a higher concentration of salt and sugar than the human body. They are best drunk after exercise as it is important to replace glycogen levels quickly after exercise. |
| Hypotonic | Hypotonic drinks are designed to quickly replace fluids lost during exercise. They have very low carbohydrate content and a lower concentration of salt and sugar than the human body. |
| Electrolyte-Enhanced Water | Electrolyte water is water infused with electrically-charged minerals, such as sodium, potassium, calcium, and magnesium. |
| Protein-based Sport Drinks | Protein-based sports drinks are those sports drinks which has added protein in it that will improve performance and reduce muscle protein breakdown. |
| On-Trade | The on-trade refers to places that sell beverages for immediate consumption on the premises like bars, restaurants, and pubs |
| Off-Trade | Off-trade usually means places like liquor stores, supermarkets and other places where you don't consume the beverage right away. |
| Convenience Store | A retail business that provides the public with a convenient location to quickly purchase a wide variety of consumable products and services, generally food and gasoline. |
| Specialty store | A specialty store is a shop/store that carries a deep assortment of brands, styles, or models within a relatively narrow category of goods |
| Online Retail | Online retail is a type of eCommerce whereby a business sells goods or services directly to consumers from a website. |
| Aseptic Packaging | Aseptic packaging refers to the filling of a cold, commercially sterile product under sterile conditions into a presterilized container and closure under sterile conditions to form a seal that effectively excludes microorganisms. These includes tetra packs, cartons, pouches etc. |
| PET Bottle | PET bottle means a bottle made of polyethylene terephthalate. |
| Metal Cans | Metal containers made of aluminum or tin- plated or zinc-plated steel, which are commonly used for packaging food, beverages or other products. |
| Disposable Cups | Disposable Cup means a cup or other container designed for single use to serve beverages, such as water, cold drinks, hot drinks and alcoholic beverages. |
| Gen Z | A way of referring to the group of people who were born in the late 1990s and early 2000s. |
| Millenial | Anyone born between 1981 and 1996 (ages 23 to 38 in 2019) is considered a Millennial |
| Taurine | Taurine is an amino acid that supports immune health and nervous system function. |
| Bars & Pubs | It is a drinking establishment licensed to serve alcoholic drinks for consumption on the premises. |
| Café | It is a foodservice establishment serving refreshments (mainly coffee) and light meals. |
| On the go | It means doing / dealing with while busily engaged with something and not diverting plans in order to accommodate. |
| Internet Penetration | The Internet Penetration Rate corresponds to the percentage of the total population of a given country or region that uses the Internet. |
| Vending Machine | A machine that dispenses small articles such as food, drinks, or cigarettes when a coin or token is inserted |
| Discount store | A discount store or discounter offers a retail format in which products are sold at prices that are in principle lower than an actual or supposed "full retail price". Discounters rely on bulk purchasing and efficient distribution to keep down costs. |
| Clean Label | Clean label on the beverage market are drinks that are made from few ingredients of natural origin and are not or only slightly processed. |
| Caffeine | An alkaloid compound which is a stimulant of the central nervous system. It is mainly used recreationally, as a mild cognitive enhancer to increase alertness and attentional performance. |
| Extreme sport | Action sports, adventure sports or extreme sports are activities perceived as involving a high degree of risk. |
| High-intensity interval training | It incorporates several rounds that alternate between several minutes of high intensity movements to significantly increase the heart rate to at least 80% of one's maximum heart rate, followed by short periods of lower intensity movements. |
| Shelf life | The length of time for which an item remains usable, fit for consumption, or saleable. |
| Cream Soda | Cream soda is a sweet soft drink. Generally flavored with vanilla and based on the taste of an ice cream float |
| Root Beer | Root beer is a sweet North American soft drink traditionally made using the root bark of the sassafras tree Sassafras albidum or the vine of Smilax ornata as the primary flavor. Root beer is typically, but not exclusively, non-alcoholic, caffeine-free, sweet, and carbonated. |
| Vanilla Soda | A carbonated soft drink flavoured with vanilla. |
| Dairy-Free | A product that does not contain any milk or milk products from cows, sheep or goats. |
| Caffeine-Free Energy Drinks | Caffeine-free energy drinks rely on other ingredients to boost the energy. Popular choices include amino acids, B vitamins, and electrolytes. |
Need More Details on Market Definition?
Ask a Question
Research Methodology
Mordor Intelligence follows a four-step methodology in all our reports.
- Step-1: IDENTIFY KEY VARIABLES: In order to build a robust forecasting methodology, the variables and factors identified in Step 1 are tested against available historical market numbers. Through an iterative process, the variables required for market forecast are set, and the model is built on the basis of these variables.
- Step-2: Build a Market Model: Market-size estimations for the forecast years are in nominal terms. Inflation is not a part of the pricing, and the average selling price (ASP) is kept constant throughout the forecast period for each country.
- Step-3: Validate and Finalize: In this important step, all market numbers, variables, and analyst calls are validated through an extensive network of primary research experts from the market studied. The respondents are selected across levels and functions to generate a holistic picture of the market studied.
- Step-4: Research Outputs: Syndicated reports, custom consulting assignments, databases & subscription platforms

Get More Details On Research Methodology
Download PDF


