
Market Overview
| Study Period | 2021 - 2031 |
|---|---|
| Market Size (2026) | USD 3.72 Billion |
| Market Size (2031) | USD 6.05 Billion |
| Growth Rate (2026 - 2031) | 10.21 % |
| Fastest Growing Market | Europe |
| Largest Market | North America |
| Market Concentration | Medium |
Major Players *Disclaimer: Major Players sorted in no particular order Image © Mordor Intelligence. Reuse requires attribution under CC BY 4.0. | |
Remotely Operated Vehicles (ROV) Market Analysis by Mordor Intelligence
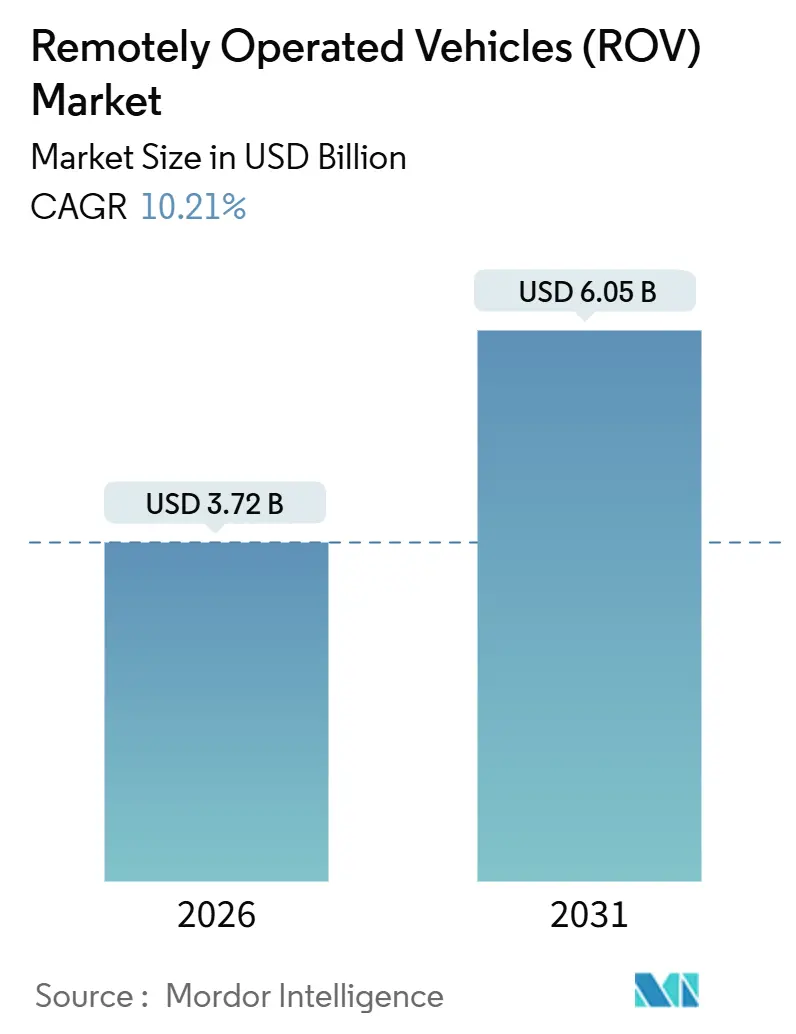
The Remotely Operated Vehicles Market size is estimated at USD 3.72 billion in 2026, and is expected to reach USD 6.05 billion by 2031, at a CAGR of 10.21% during the forecast period (2026-2031).
Rising multi-year capital programs in ultra-deep reservoirs and a parallel boom in offshore wind construction are rewriting the subsea economics that underpin the Global ROV market. National oil companies in the Middle East and Latin America are resuming pre-pandemic drilling schedules, European utilities are laying thousands of kilometers of inter-array cable that need frequent inspection, and battery breakthroughs are extending mission endurance for electric vehicles, enlarging the addressable Global ROV market. Work-class systems dominate heavy-lift tasks, yet shallow-water fleets are scaling quickly in response to turbine-foundation inspections. Operators with resident vehicles docked subsea are already reducing mobilization days and cutting inspection turnaround times, sharpening competitive dynamics inside the Global ROV market.
Key Report Takeaways
- By vehicle class, work-class platforms held 71.6% of the Global ROV market share in 2025 and are forecast to expand at an 11.7% CAGR to 2031.
- By depth rating, deep-water operations above 1,000 meters captured 56.3% of revenue in 2025, while shallow-water deployments up to 300 meters are advancing at a 13.1% CAGR.
- By propulsion system, electric vehicles commanded 55.5% of 2025 revenue, growing at an 11.3% CAGR through 2031.
- By activity, inspection-repair-maintenance accounted for 34.7% of spending in 2025 and is rising at an 11.0% CAGR.
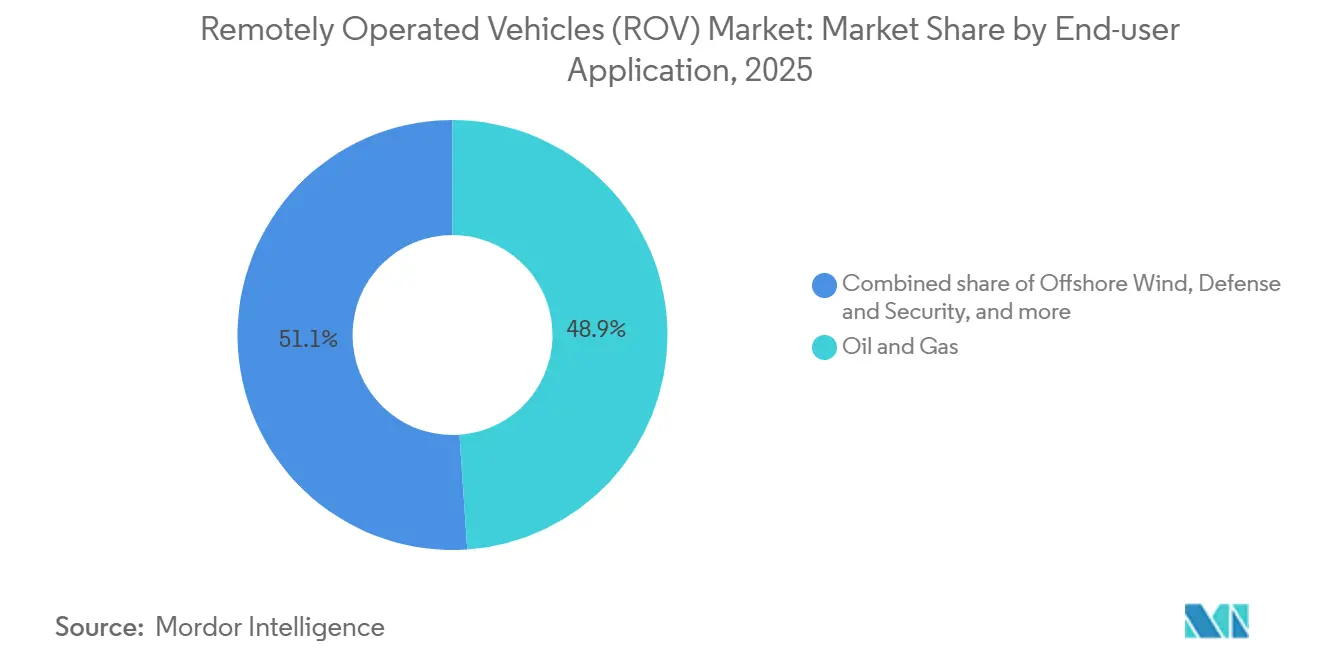
- By end-user application, oil and gas led with 48.9% of revenue in 2025, yet offshore wind is the fastest-growing segment at an 18.8% CAGR.
- By geography, North America held 37.1% of 2025 revenue, while Europe is the fastest-advancing region at a 16.5% CAGR.
Note: Market size and forecast figures in this report are generated using Mordor Intelligence’s proprietary estimation framework, updated with the latest available data and insights as of January 2026.
Market Trends and Insights
Drivers Impact Analysis of Remotely Operated Vehicles (ROV) Market*
| Driver | (~) % Impact on CAGR Forecast | Geographic Relevance | Impact Timeline |
|---|---|---|---|
| Increasing Offshore Oil & Gas Exploration Capex Rebound | 2.50% | Gulf of Mexico, North Sea, Brazil, Middle East | Medium term (2-4 years) |
| Expansion of Offshore Wind Farms and Subsea Cabling | 2.80% | UK, Norway, Denmark, Germany, China, Taiwan, South Korea | Long term (≥ 4 years) |
| Rising IRM Demand for Ageing Subsea Infrastructure | 1.90% | Gulf of Mexico, North Sea, mature Asian fields | Medium term (2-4 years) |
| Deep-Water Capex Surge by NOCs | 1.70% | Saudi Arabia, UAE, Qatar, Brazil, Mexico, Nigeria, Angola | Long term (≥ 4 years) |
| Resident ROV Systems Enabled by Subsea Docking | 0.80% | Early adoption in Gulf of Mexico and North Sea | Long term (≥ 4 years) |
| Seabed Mineral-Mining Pilot Programs | 0.50% | Clarion-Clipperton Zone, Indian Ocean | Long term (≥ 4 years) |
| Source: Mordor Intelligence | |||
Increasing Offshore Oil & Gas Exploration Capex Rebound
Global upstream budgets have normalized after the 2020-2023 downturn, with Chevron allocating USD 14.5 billion to upstream in 2025, much of it in the Gulf of Mexico.[1]Chevron Corporation, “Investor Presentation 2025,” chevron.com Shell’s Whale project reached first oil in late 2024 at 2,500 meters and required continuous work-class support.[2]Reuters, “Shell Whale Project First Oil,” reuters.com Fitch Ratings expects annual upstream spending to top USD 500 billion through 2027, with deep-water claiming 22% of that outlay.[3]Fitch Ratings, “Upstream Capex Outlook 2025-2027,” fitchratings.com The International Energy Agency projects offshore production to rise by 1.8 million barrels per day between 2025 and 2030, almost entirely from deep-water assets.[4]International Energy Agency, “World Energy Outlook 2025,” iea.org These commitments enlarge the Global ROV market because only heavy work-class units can handle hydraulic manipulation at depths beyond 1,500 meters.
Expansion of Offshore Wind Farms and Subsea Cabling
Europe is on track for 120 gigawatts of offshore wind by 2030, requiring 35,000 kilometers of cables that must be inspected annually. Ørsted’s Hornsea 3 will install 231 turbines across 696 square kilometers and deploy shallow-water vehicles for foundation surveys. Equinor’s Hywind Tampen floating project introduced mooring-line inspections that depend on multi-beam-equipped ROVs. China surpassed 40 gigawatts in 2025 and targets 100 gigawatts by 2030, generating sustained procurement of battery-electric units. The Celtic Sea leasing round added 4.5 gigawatts with contracts mandating yearly scour assessments, guaranteeing decades of recurring demand.
Rising IRM Demand for Ageing Subsea Infrastructure
The Gulf of Mexico hosts more than 2,000 wells installed before 2010, and inspection cycles have shortened from five to three years as corrosion accelerates. Oceaneering reported a 14% rise in IRM awards during the first nine months of 2024, lifting utilization to 69%. TechnipFMC secured a five-year North Sea framework in 2025 covering 120 trees and 18 manifolds. Norway requires annual assessments on installations older than 15 years, creating a USD 800 million captive market. Subsea 7’s resident vehicle cut inspection turnaround from 21 days to 7 days, demonstrating the efficiency gains resonating across the Global ROV market.
Deep-Water Capex Surge by NOCs
Saudi Aramco’s Marjan and Berri redevelopments include deep-water tie-backs running to 2028. Petrobras allocated USD 102 billion for 2025-2029, with 60% for pre-salt prospects deeper than 2,000 meters. ADNOC awarded a USD 1.65 billion subsea system for Hail and Ghasha in early 2025. Mexico’s Pemex restarted Perdido exploration in 2024, issuing multi-year vehicle tenders. IMCA estimates national companies represented 58% of subsea capex in 2024, up from 47% in 2020.
Restraints Impact Analysis of Remotely Operated Vehicles (ROV) Market*
| Restraint | (~) % Impact on CAGR Forecast | Geographic Relevance | Impact Timeline |
|---|---|---|---|
| Offshore E&P Moratoriums & Environmental Activism | -0.60% | California, U.S. Atlantic, select European zones | Short term (≤ 2 years) |
| High Capex & OPEX of Work-Class ROV Fleets | -0.40% | Global, smaller contractors | Medium term (2-4 years) |
| Regulatory Grey Zones for Autonomous Subsea Ops | -0.30% | Global | Medium term (2-4 years) |
| Fiber-Optic Umbilical Bandwidth Constraints | -0.20% | Global | Long term (≥ 4 years) |
| Source: Mordor Intelligence | |||
Offshore E&P Moratoriums & Environmental Activism
The U.S. federal pause on new leases announced in 2025 removed 12 million acres from near-term exploration. California extended its drilling moratorium to 2030, freezing ROV demand in the Santa Barbara Channel. Norway deferred Barents licensing until impact studies finish in 2027. The EU’s Renewable Energy Strategy closed 18% of the North Sea to hydrocarbon activity. Meanwhile, environmental groups pressured the International Seabed Authority to postpone commercial mining licenses until 2028.
High Capex & OPEX of Work-Class ROV Fleets
A heavy work-class system costs more than USD 5 million, and yearly operations add USD 1.2 million. Fleet utilization must average 75% across 320 days for a 15% return, a ratio only consistent in the Gulf of Mexico and the North Sea. DOF Subsea sold eight older units in 2024 during restructuring to ease debt. Smaller contractors struggle to secure financing because lenders view the assets as specialized with limited resale value. Although resident units trim long-run OPEX, they require high upfront investment in docking infrastructure, further elevating barriers to entry.
*Our forecasts treat driver/restraint impacts as directional, not additive. The impact forecasts reflect baseline growth, mix effects, and variable interactions.
Remotely Operated Vehicles (ROV) Market Segment Analysis
By Vehicle Class:
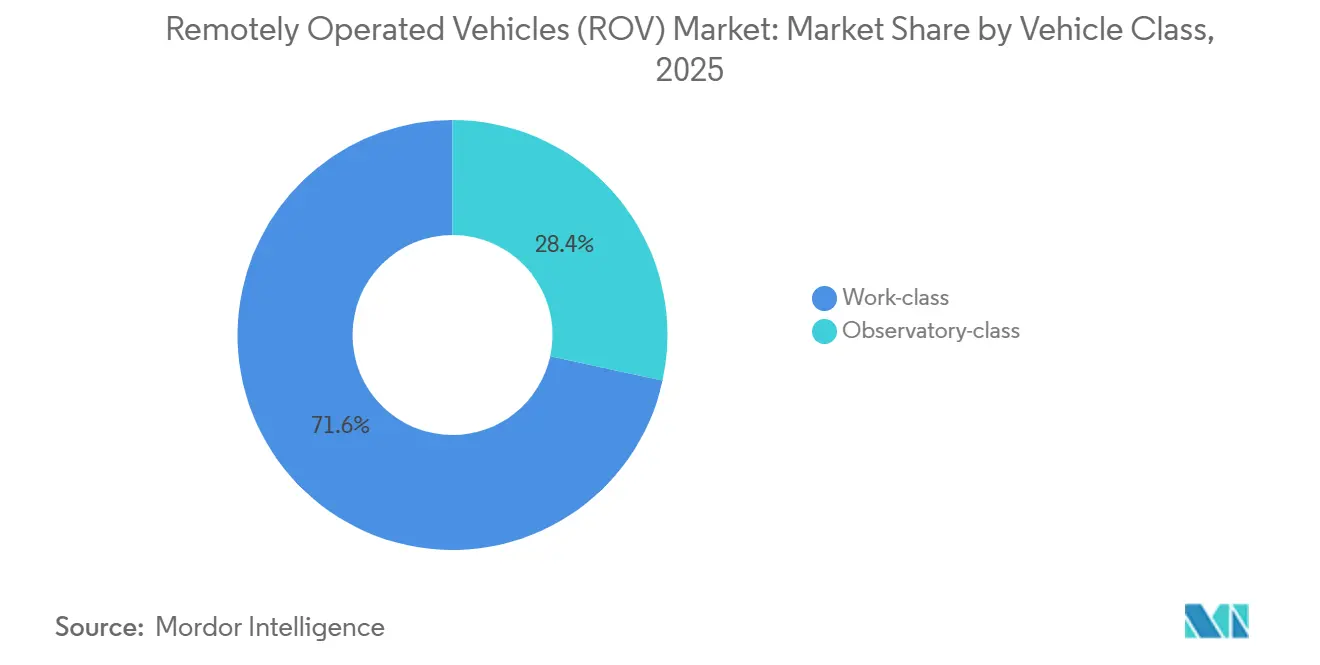
Work-Class Units Anchor Deep-Water ComplexityWork-class systems held 71.6% of the ROV market share in 2025 and will climb at an 11.7% CAGR to 2031. The ROV market size for work-class units is projected to expand by USD 1.9 billion over the forecast, reflecting monopoly on tasks that demand 200-kilogram manipulator force. Saab Seaeye launched the Leopard in 2024, pairing electric transit with hydraulic lift to cut fuel use 18%. Observatory-class vehicles remain essential for shallow inspections but command lower day rates. Forum’s Sub-Atlantic Mohawk Lite targets mid-tier tasks with a tool skid that reconfigures in under two hours. This bifurcation ensures parallel growth paths inside the ROV market as offshore wind favors compact electric units while oil and gas relies on heavy work-class capacity.
Work-class innovations now center on fiber-optic telemetry that enables real-time 4K video, closing a data gap that historically forced post-mission downloads. Oceaneering’s Millennium Plus demonstrated seamless multi-beam streaming in Gulf of Mexico trials. Smaller observatory fleets focus on agility and battery endurance, typified by VideoRay’s Pro 5 with a 10-hour lithium-ion package. Hybrid architecture is emerging as a compromise, letting operators satisfy environmental guidelines without sacrificing payload.


By Depth Rating:
Shallow-Water Momentum from Offshore WindDeep-water projects above 1,000 meters controlled 56.3% of revenue in 2025, yet shallow-water fleets up to 300 meters are pacing the Global ROV market at a 13.1% CAGR. The Global ROV market size for shallow-water operations is projected to more than double by 2031 as turbine-foundation inspections proliferate. Ørsted’s Hornsea 3 requires annual verification across 231 turbines located at 40-60 meters. VideoRay’s Pro 5 and Deep Trekker’s Revolution target this domain with battery swaps under five minutes.
Mid-water zones covering 300-1,000 meters serve mature North Sea fields and deeper coastal wind sites. EU directives mandate yearly cable checks in waters shallower than 200 meters, creating a captive shallow-water revenue stream of USD 450 million annually. These compliance obligations ensure long-run visibility for operators pursuing recurrent contracts inside the Global ROV market.
By Propulsion System:
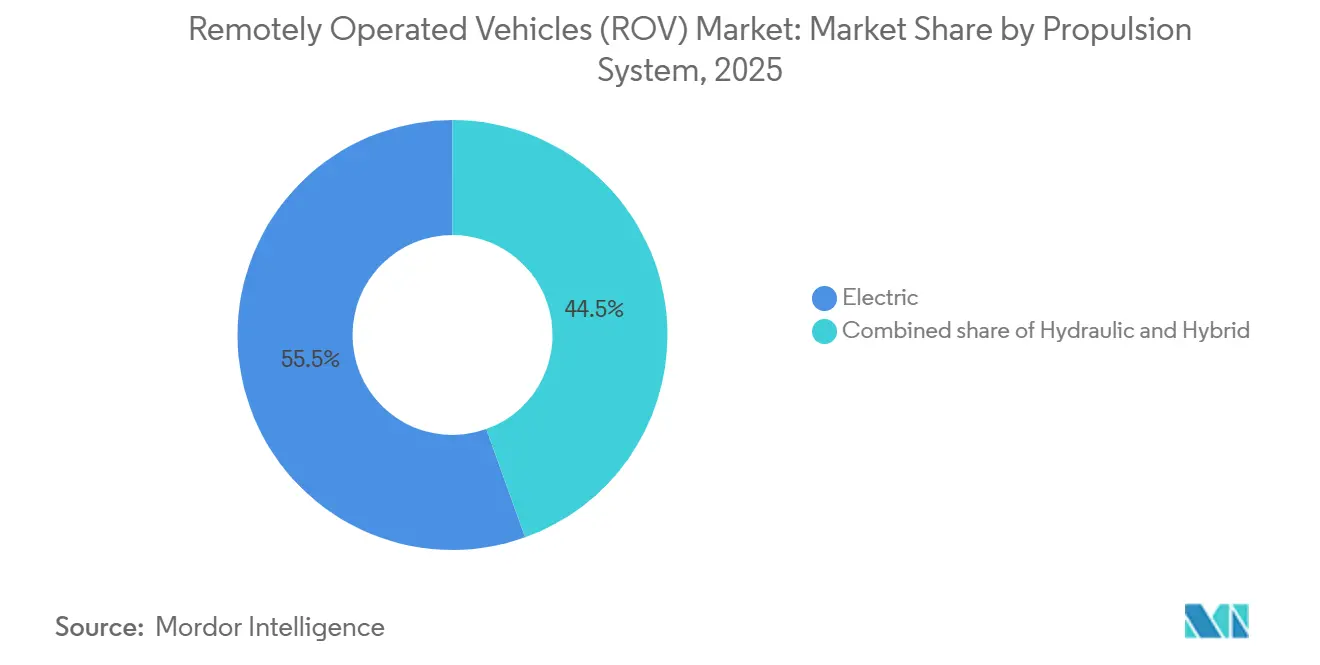
Electric Vehicles Scale on EfficiencyElectric systems secured 55.5% revenue in 2025 and are moving ahead at an 11.3% CAGR thanks to 14.8 kilowatt-hour battery packs that support eight-hour missions. The Global ROV market share for electric units will widen as marine protected areas restrict hydraulic leaks. Kongsberg’s eROV prototype leverages hybrid energy storage, switching to fuel cells for resident deployments. Norway’s safety regulator now encourages electric or hybrid propulsion within 500 meters of protected zones.
Hydraulic units still rule heavy intervention work because manipulator force remains unmatched. Saab Seaeye’s Sabertooth hybrid demonstrates that pairing electric thrusters with hydraulic power can reduce consumption 22% while preserving lift capacity. The propulsion pivot underscores how environmental compliance and cost efficiency are converging inside the Global ROV market.
By Activity:
IRM Outpaces Drilling and ConstructionInspection-repair-maintenance commanded 34.7% revenue in 2025 and is growing at an 11.0% CAGR, reflecting North Sea life-extension programs and Gulf of Mexico integrity mandates. The Global ROV market size for IRM is on course to surpass USD 2 billion by 2031 as decommissioning accelerates. Subsea 7’s resident vehicle cut mobilization costs by 40% during a 2024 pilot. Drilling support remains vital for Brazil, West Africa, and Mexico where blowout-preventer installation demands heavy work-class capacity.
Construction work is buoyant in offshore wind, with 35,000 kilometers of cable laying planned across Europe and Asia by 2030. Environmental monitoring remains a modest segment but is expanding as developers conduct benthic surveys under EU directives, reinforcing the recurrent inspection cycle that underpins the Global ROV market.
By End-User Application:
Offshore Wind Becomes the Growth EngineOil and gas retained 48.9% of revenue in 2025, yet offshore wind’s 18.8% CAGR leads future expansion. Europe alone will need yearly surveys on 120 gigawatts of turbines by 2030. China targets 100 gigawatts by 2030, favoring electric fleets that avoid hydraulic leakage. Equinor’s Hywind Tampen demands dynamic-cable inspection, modulating tooling requirements for Global ROV industry vendors.
Defense, research, and aquaculture form smaller but growing niches. Navies are adopting mine-countermeasure vehicles, while salmon farms in Norway deploy compact units for net checks, broadening the Global ROV market beyond traditional energy clients.
Geography Analysis
North America Remotely Operated Vehicles (ROV) Market
North America generated 37.1% of 2025 revenue, anchored by Gulf of Mexico lease rounds that drew USD 382 million in bids. Chevron’s upstream budget signals a durable deep-water appetite, and Canada’s approvals in Newfoundland add new drilling campaigns through 2027. Pemex revived Perdido exploration in 2024, enhancing medium-term demand. Policy headwinds persist as the federal leasing pause and California moratorium constrain near-shore growth.
Europe Remotely Operated Vehicles (ROV) Market
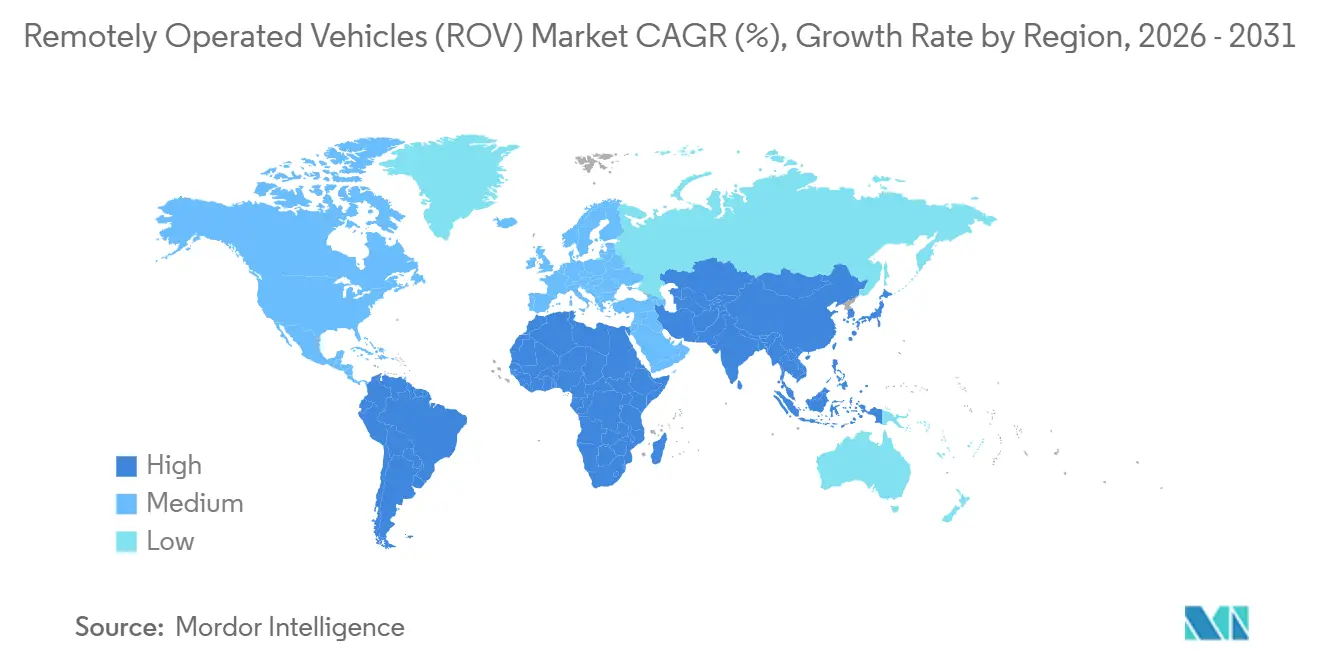
Europe is the fastest-advancing region with a 16.5% CAGR, scaling the Global ROV market through offshore wind build-out and decommissioning. The Crown Estate’s Celtic Sea leases add 4.5 gigawatts with compulsory yearly inspections. Norway’s annual integrity rules create a USD 800 million captive IRM market. Denmark’s Energinet let contracts for 1,200 kilometers of export cables in 2024. Germany targets 30 gigawatts of wind by 2030.
APAC, Middle East and LATAM Remotely Operated Vehicles (ROV) Market
Asia-Pacific, the Middle East, and Latin America represent high-growth corridors. China already crossed 40 gigawatts of offshore wind in 2025. India’s ONGC awarded contracts for deep-water KG-Basin blocks. Saudi Aramco, Petrobras, and ADNOC together plan more than 60 subsea trees per year through 2028, sustaining heavy work-class utilization. ASEAN pipeline inspection work is rising as Malaysia and Indonesia expand gas exports.

Regulatory Landscape
Regulation affecting ROV operations is tightening around offshore safety compliance, formalized documentation of industry standards, and growing acceptance of remote and robotic inspection in lieu of diver exposure. In the US Gulf of Mexico, the Bureau of Safety and Environmental Enforcement (BSEE) updated its B-PINCs manual in January 2026 to explicitly require ROV intervention functions for subsea blowout preventer (BOP) stacks, including RAM testing upon initial seafloor installation. This update reinforces demand for intervention-capable work-class systems and qualified crews. BSEE also issued Safety Alert 499 in April 2025 following an umbilical termination failure that led to a dropped ROV during recovery, prompting operators and contractors to strengthen inspection and re-termination procedures tied to launch and recovery operations.
Global and cross-border standards are also influencing equipment specifications and operating procedures. The IMO 2023 Diving Code became effective on January 1, 2024 for ships with diving systems (500+ gross tonnage), shaping how integrated diving and ROV support activities are planned and managed on offshore vessels. On the standards side, ISO published ISO 25451:2026 in May 2026, setting technical requirements for seafloor mapping using uncrewed marine vehicles (including ROVs), which supports consistent survey deliverables across oil and gas, offshore wind, and IMR scopes. In parallel, BSEE continued incorporating updated industry standards into US offshore rules, with a final rule published in June 2026 and an implementation date in August 2026 for updates to 30 CFR Part 250 that further elevate the role of documented, standards-based verification in offshore projects.
Competitive Landscape
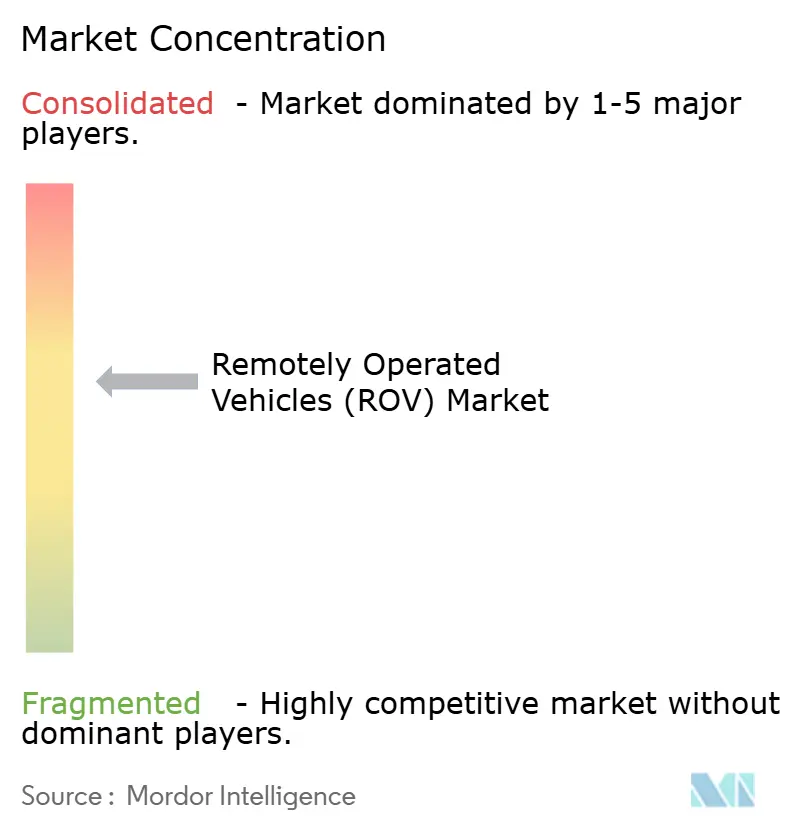
The top five operators, Oceaneering, TechnipFMC, Subsea 7, Fugro, and DOF Subsea, control roughly 62% of worldwide fleet capacity, indicating moderate concentration. Oceaneering’s 250-unit fleet achieved 69% utilization and USD 10,576 daily revenue per vehicle in Q3 2024. TechnipFMC bundles ROV services with production systems, deepening client lock-in. Subsea 7 leads resident deployments, logging 92% uptime in its pilot. Disruptors such as Blue Robotics and Deep Trekker supply low-cost electric units that suit offshore wind developers and research institutes.
Strategic priorities include resident operations, hybrid propulsion, and high-bandwidth telemetry. Oceaneering’s Liberty e-ROV trims vessel days, Saab Seaeye’s Sabertooth cuts fuel 22%, and Fugro is partnering with Kongsberg on autonomous cable-inspection vehicles. Autonomous and semi-autonomous deployments account for less than 3% of fleet hours, suggesting ample runway as DNV’s remote-operations framework gains traction.
Remotely Operated Vehicles (ROV) Industry Leaders
DeepOcean AS
DOF Subsea AS
Oceaneering International Inc.
TechnipFMC PLC
Helix Energy Solutions Group Inc.
- *Disclaimer: Major Players sorted in no particular order
Remotely Operated Vehicles (ROV) Market Companies Covered in this Report
- Oceaneering International Inc.
- TechnipFMC plc
- Subsea 7 S.A.
- Fugro N.V.
- DOF Subsea AS
- DeepOcean AS
- Helix Energy Solutions Group Inc.
- Bourbon Corp. SA
- Saipem SpA
- Forum Energy Technologies Inc.
- Saab Seaeye Ltd.
- ROVOP Ltd.
- Delta SubSea LLC
- IKM Subsea AS
- Kongsberg Maritime
- ECA Group
- Deep Trekker Inc.
- VideoRay LLC
- Blue Robotics Inc.
- Seatronics (Ashtead Group)

Market Opportunities and Future Outlook
White space is expanding where customers are seeking persistent subsea presence and fewer vessel days, particularly for inspection, repair, and maintenance on aging infrastructure and for deepwater developments with higher intervention complexity. Resident and extended-stay architectures are moving from pilots toward commercial offerings. Oceaneering debuted its Momentum Electric Work Class ROV in March 2026 with a design goal of 30-day continuous subsea residency, aligning with operator priorities to reduce weather dependence and shorten inspection turnaround times. In February 2026, Saipem reported a record 240 days of continuous seabed residency for its Hydrone-R underwater drone in the Norwegian Sea, reinforcing the operational case for long-duration subsea robotics where integrity programs and offshore wind cable monitoring depend on repeatable campaigns.
A second opportunity area is fleet modernization and local capability build-out in high-activity basins, where contractors are adding high-spec work-class capacity and electric propulsion options to support deeper water deployments and stricter environmental operating preferences. In May 2026, CNOOC introduced the FCV3001 work-class ROV in collaboration with Fugro, targeting global subsea IMR and survey tasks, which indicates that national operators are investing in advanced ROV capability rather than relying only on imported systems. Together with the market shift toward electric and hybrid platforms referenced by operators and regulators, including preferences near protected zones, these moves create clearer demand signals for high-bandwidth telemetry, condition-based maintenance, and docking-enabled resident operations that fit both oil and gas deepwater intervention and offshore wind inspection cycles.
Recent Industry Developments in Remotely Operated Vehicles (ROV) Market
- July 2026: Oceaneering extended its collaboration with Petrobras through a four-year agreement for ROV services. The deal supports multi-year utilization for Oceaneering's ROV fleet in Brazil and enables planning for staffing, tooling, and spares for sustained deepwater IMR and intervention workloads.
- March 2026: DOF Group ordered four XLX EVO III work-class ROVs from Forum Energy Technologies, with deliveries scheduled between April and August 2026. The purchase adds modern work-class capacity to DOF's subsea services platform and positions its fleet for higher-specification deepwater requirements and longer-term charter-linked project demand.
- September 2025: The Indian Navy signed a contract with EyeROV for advanced underwater ROVs, including the Trout model, for underwater reconnaissance, inspection, and surveillance. This procurement strengthens domestic supply chains for defense-grade ROV capabilities and expands the addressable market beyond offshore energy into security-driven inspection and monitoring missions.


Remotely Operated Vehicles (ROV) Market Report Scope and Research Methodology
Market Definition and Coverage
This market covers revenues earned from remotely operated vehicles used for underwater work where the vehicle is controlled from the surface through a tether, including related onboard systems sold with the vehicle and typical service delivery.
Scope exclusions: This sizing excludes autonomous underwater vehicles (AUVs) and general underwater robotics totals where ROV revenue cannot be cleanly separated.
Segments Covered in This Report
- By Vehicle Class
- Work-class
- Light Work-class
- Medium Work-class
- Heavy Work-class
- Observatory-class
- Work-class
- By Depth Rating
- Shallow (Up to 300 m)
- Mid-water (300 to 1,000 m)
- Deep-water (Above 1,000 m)
- By Propulsion System
- Electric
- Hydraulic
- Hybrid
- By Activity
- Drilling and Development
- Construction and Installation
- Inspection, Repair and Maintenance (IRM)
- Decommissioning
- Environmental Monitoring
- By End-user Application
- Oil and Gas
- Offshore Wind
- Defense and Security
- Research and Academia
- Aquaculture and Marine Infrastructure
- By Geography
- North America
- United States
- Canada
- Mexico
- Europe
- United Kingdom
- Norway
- Denmark
- Germany
- France
- Russia
- Rest of Europe
- Asia-Pacific
- China
- India
- Japan
- South Korea
- ASEAN Countries
- Rest of Asia-Pacific
- South America
- Brazil
- Argentina
- Colombia
- Rest of South America
- Middle East and Africa
- Saudi Arabia
- United Arab Emirates
- Qatar
- South Africa
- Egypt
- Nigeria
- Rest of Middle East and Africa
- North America
Data Sources, Market Sizing, and Validation
Desk Research
For desk research, we started by mapping the demand pool and installed activity where ROVs are used, then aligning that demand to how revenue is usually reported in this industry. Public sources used for grounding include offshore and maritime energy statistics from the International Energy Agency, safety and offshore activity references from national regulators (such as BOEM in the US and the UK HSE), and marine standards and technical references from bodies such as IMO and ISO.
Next, the build was supported with cross checks from customs and trade statistics (such as UN Comtrade) for relevant underwater equipment categories, along with patent databases to understand where new ROV capabilities are moving. Company annual reports, investor presentations, contract awards covered in reputed press, and association websites were used to confirm product scope and typical pricing logic. We also used paid subscriptions for company financials and intelligence, news and financials, and patent databases to speed up screening and validation. The sources listed here are illustrative only, and additional public documents were used to collect data, validate inputs, and clarify assumptions.
Primary Interviews and Surveys
Primary work was used to test how end users and service providers define an ROV program cost, what is counted as vehicle revenue versus services, and how utilization changes by water depth and activity. We spoke with operators, integrators, and downstream users across key offshore basins and naval demand pockets, so gaps from desk findings could be closed and assumptions could be corrected before finalizing totals.
Distribution of primary research fieldwork respondents
| Company type | Respondent position | Region |
|---|---|---|
| Top tier: 37% | CXOs: 12% | APAC: 45% |
| Mid tier: 42% | Functional/Unit leaders: 34% | EMEA: 35% |
| Smaller Players: 21% | Managers: 54% | Americas: 20% |
Market-Sizing & Forecasting
The core model uses a top-down approach where offshore activity signals and capex cycles are converted into an addressable demand pool for ROV deployments, then translated into annual spending using typical system pricing and service mix. To keep totals realistic, the outputs are corroborated with selective bottom-up approximations, such as sampled price per vehicle by class, a few supplier and operator revenue roll ups, and channel checks on fleet utilization, which are then used to adjust the final totals where needed.
Inputs are kept practical and repeatable, and the most common ones include offshore project starts and maintenance intensity, depth rating mix between work class and observation class units, day rates and utilization for intervention and inspection work, replacement and refurbishment cycles, and the share of ROV demand tied to offshore wind inspection versus oil and gas field work. When data was sparse in a country or niche activity, proxy indicators were applied, such as nearby basin activity, tender volume, and installed offshore infrastructure growth, followed by expert checks so the gap did not distort the global picture.
For forecasting, scenario analysis was used around offshore investment, energy price expectations, and regulatory driven inspection intensity, then the selected scenario was stress tested with interview feedback on pricing trends and utilization outlook. Short term swings were handled by smoothing year to year spikes from large project timing, so the trajectory reflects what buyers and suppliers typically plan for.
Data Validation & Update Cycle
We validated results by comparing model outputs against independent signals like offshore project pipelines, tender activity for subsea work, and disclosed order intake trends where available, and then checking whether the implied pricing and utilization looked realistic. Outliers were investigated, and follow up calls were triggered when a number moved beyond what the activity indicators could explain.
Before sign off, the work is reviewed in multiple steps, starting with internal consistency checks and followed by a peer review that looks for scope leakage between vehicles, services, and adjacent underwater robotics. Reports are refreshed annually, and interim updates are made when major events change offshore spending, regulations, or technology adoption, followed by a final pre delivery pass to keep the view current.
Mordor Intelligence's Rov Market Size Compared Against Other Published Estimates
Published market sizes for ROVs often differ because the counting rules are not the same, even when the title looks similar. The biggest drivers are usually scope coverage, whether values include only offshore deployments or all end uses, and how pricing and utilization are carried forward in the forecast.
The main gap comes from offshore only scoping and narrower revenue capture, where Mordor Intelligence counts global ROV revenues across major applications while keeping AUVs and blended underwater robotics totals out of the number. Differences also show up when one estimate leans on a conservative capex cycle, uses older currency conversion points, or does not validate implied day rates and fleet utilization against recent project timing.
Benchmark comparison
| Source | Market Size | Gaps in Research Methodology |
|---|---|---|
| Mordor Intelligence | USD 3.72 B (2026) | |
| Trade Journal A | USD 1.00 B (2024) | Uses an offshore-only definition and tends to exclude onshore, defense, and research demand, which lowers the addressable revenue pool versus a global count. |
| Regional Consultancy B | USD 2.30 B (2023) | Year and scope are not clearly stated in the public summary, and the growth curve appears tied to a narrower set of activities with limited transparency on utilization and ASP progression. |
The spread in the table is mostly explained by whether the estimate is offshore only, how revenues are separated from adjacent underwater robotics, and which year is treated as the anchor for pricing and utilization. By keeping the inputs tied to observable offshore activity signals and then validating them through expert checks, the resulting number stays traceable to clear variables and can be repeated when new data comes in.


Key Questions Answered in the Report
How large is the Global ROV market today and where is it heading?
The Global ROV market size reached USD 3.72 billion in 2026 and is forecast to rise to USD 6.05 billion by 2031 at a 10.21% CAGR.
Which vehicle class dominates current demand?
Work-class units led with 71.6% revenue in 2025 because heavy manipulators and high payloads are essential for deep-water construction.
What end-user segment is expanding the fastest?
Offshore wind is advancing at an 18.8% CAGR as Europe and China lay thousands of kilometers of subsea cable that require annual inspection.
Why are electric propulsion systems gaining market share?
Battery advances are extending mission endurance beyond eight hours and regulators prefer zero-leakage vehicles in marine protected zones.
Which regions offer the strongest growth outlook?
Europe leads with a 16.5% CAGR thanks to wind build-outs and North Sea decommissioning, while Asia-Pacific follows on rapid Chinese capacity additions.
What is the competitive intensity among service providers?
The top five operators control around 62% of global fleet capacity, creating a moderately concentrated landscape with meaningful but not overwhelming pricing power.
Page last updated on:


 Your data is secure and never sold or shared.


