
Route Optimization Software Market Size and Share
Market Overview
| Study Period | 2020 - 2031 |
|---|---|
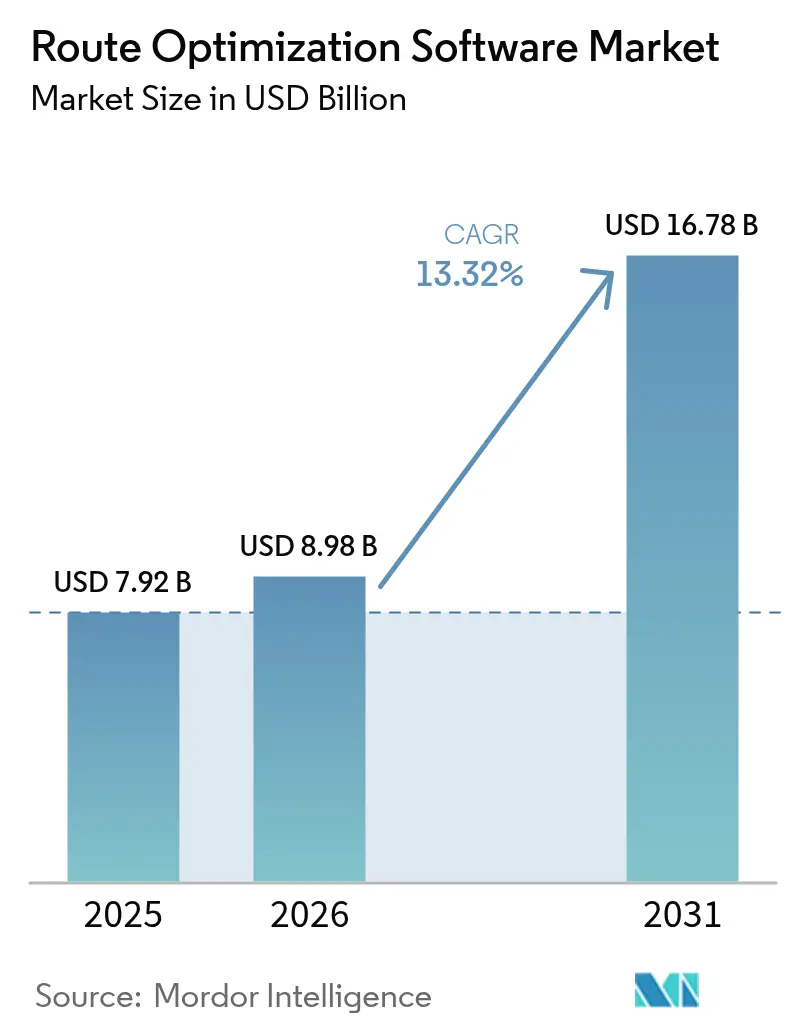
| Market Size (2026) | USD 8.98 Billion |
| Market Size (2031) | USD 16.78 Billion |
| Growth Rate (2026 - 2031) | 13.32 % |
| Fastest Growing Market | Asia Pacific |
| Largest Market | North America |
| Market Concentration | Medium |
Major Players *Disclaimer: Major Players sorted in no particular order Image © Mordor Intelligence. Reuse requires attribution under CC BY 4.0. | |
Route Optimization Software Market Analysis by Mordor Intelligence
The Route Optimization Software market size was valued at USD 7.92 billion in 2025 and estimated to grow from USD 8.98 billion in 2026 to reach USD 16.78 billion by 2031, at a CAGR of 13.32% during the forecast period (2026-2031). Continuous e-commerce growth, artificial intelligence integration, and persistent driver shortages are reshaping logistics economics, spurring global adoption of automated route-planning engines. Cloud-native platforms accelerate deployment times, while 5G connectivity enables sub-second traffic recalculations that slash idle miles and overtime costs. Low-emission zone mandates, telematics–AI convergence, and national smart-logistics programs amplify demand as fleets seek to comply with environmental targets and labor constraints. Commercial offerings increasingly bundle predictive maintenance, driver safety analytics, and vehicle-agnostic optimization features, turning route software into a control tower for last-mile orchestration.
Key Report Takeaways
- By solution component, software platforms led with 62.15% revenue share of the Route Optimization Software market size in 2025, whereas services are expanding at a 14.08% CAGR through 2031.
- By end-user vertical, on-demand food delivery posted the fastest 15.03% CAGR through 2031, while retail and FMCG commanded 31.25% of the Route Optimization Software market share in 2025.
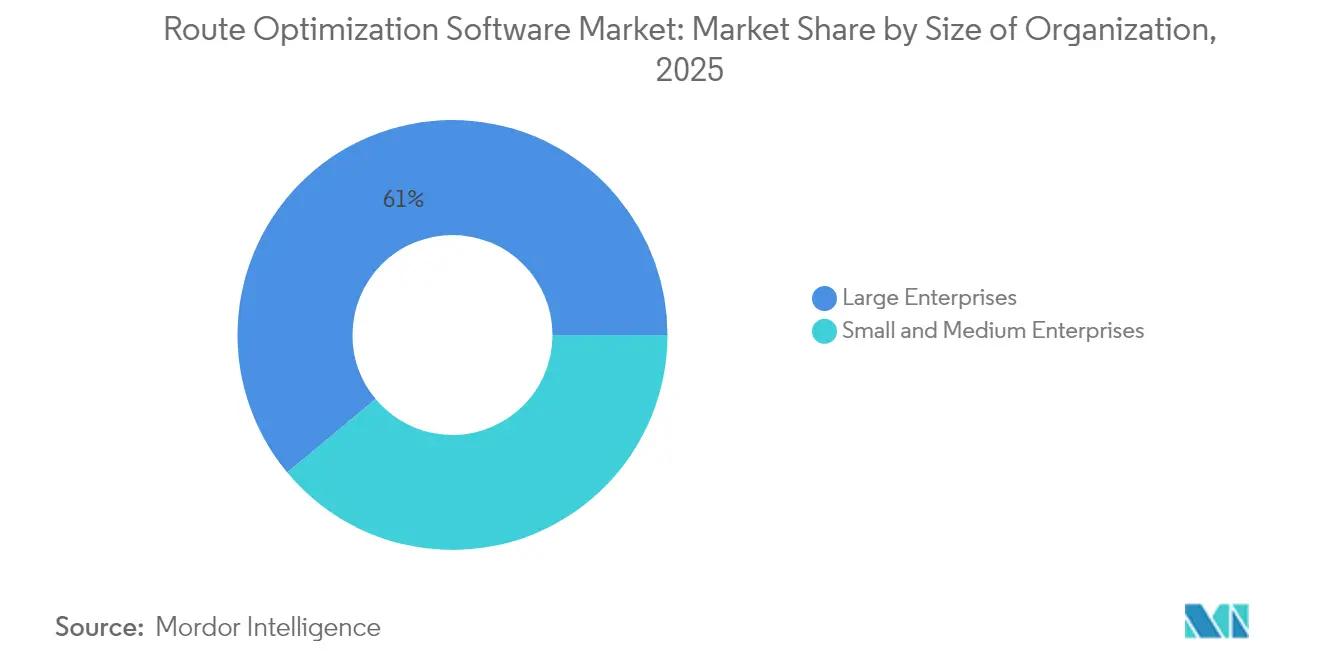
- By organization size, large enterprises accounted for 61.05% of the Route Optimization Software market size in 2025, yet SMEs record the highest 14.12% CAGR through 2031.
- By deployment mode, cloud solutions represented 65.74% of the Route Optimization Software market share in 2025 and are progressing at a 13.95% CAGR to 2031.
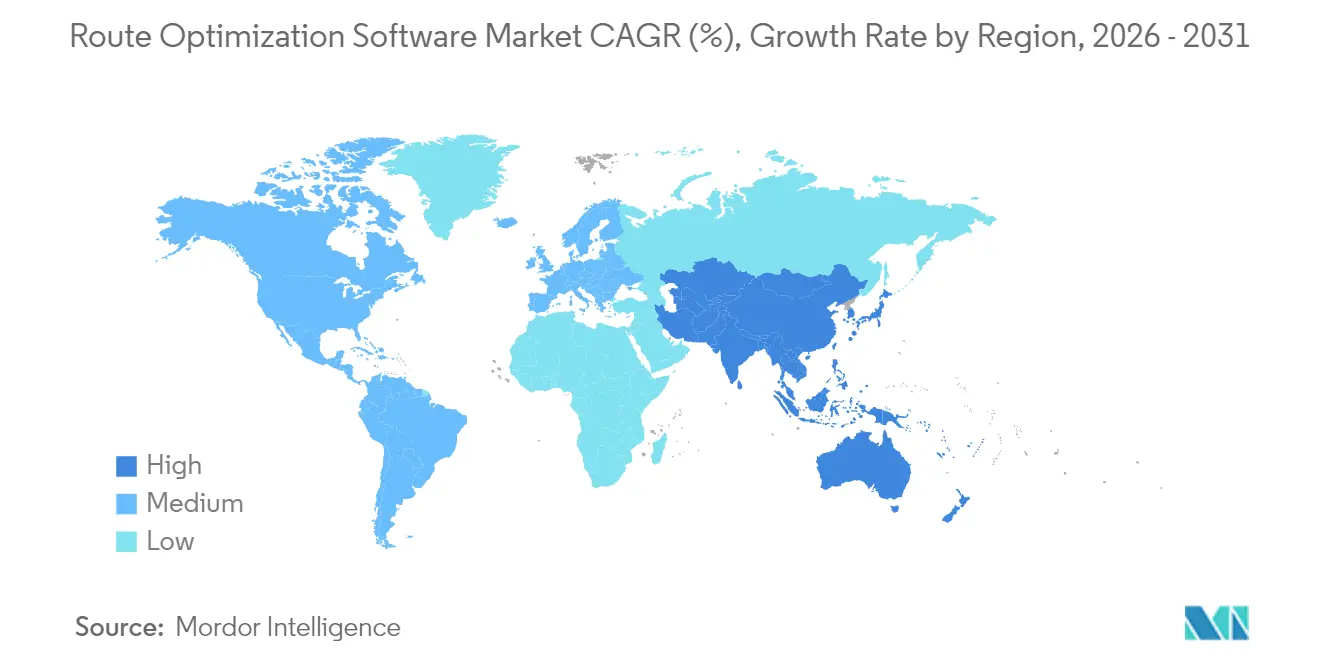
- By geography, North America captured 38.05% revenue share of the Route Optimization Software market in 2025, whereas Asia-Pacific is set to expand at a 14.82% CAGR over the forecast horizon.
Note: Market size and forecast figures in this report are generated using Mordor Intelligence’s proprietary estimation framework, updated with the latest available data and insights as of 2026.
Market Trends and Insights
Drivers Impact Analysis of Route Optimization Software Market*
| Driver | (~) % Impact on CAGR Forecast | Geographic Relevance | Impact Timeline |
|---|---|---|---|
| Explosive growth in e-commerce parcel volume | +3.2% | Global, with concentration in North America and Asia-Pacific | Short term (≤ 2 years) |
| Driver-assistance mandates from urban low-emission zones | +2.1% | Europe and select North American cities | Medium term (2-4 years) |
| 5G-enabled real-time optimization for gig economy fleets | +1.8% | Asia-Pacific core, spill-over to North America | Medium term (2-4 years) |
| Convergence of telematics and AI-powered route engines | +2.5% | Global | Long term (≥ 4 years) |
| Dynamic pricing models lowering TCO for SMB adopters | +1.4% | Global, with early adoption in developed markets | Short term (≤ 2 years) |
| National smart-logistics programs (e.g., EU DTLF, India ULIP) | +1.7% | Europe and Asia-Pacific | Long term (≥ 4 years) |
| Source: Mordor Intelligence | |||
Explosive Growth in E-commerce Parcel Volume
E-commerce parcels soared to multibillion annual counts, collapsing legacy hub-and-spoke models and forcing software providers to handle millions of dynamic delivery points within tight windows. Amazon alone processed over five billion packages in 2024, underscoring the need for algorithms that juggle inventory proximity, micro-fulfillment center locations, and real-time traffic predictions. High-density urban drops now require machine-learning engines able to pre-optimize routes from historical demand, weather, and driver behavior data. Platforms unable to deliver millisecond-level recalculations lose relevance as retailers scale omnichannel services and same-day promises.[1]
5G-enabled Real-time Optimization for Gig-Economy Fleets
Millisecond latency from 5G and Multi-Access Edge Computing turns batch scheduling into continuous optimization. Food-delivery platforms leverage local network edges to recompute routes instantly when orders surge or traffic bottlenecks emerge. Edge nodes cut round-trip computation times to 1–10 milliseconds, meaning a driver can receive an updated drop sequence before the next traffic light. Coverage is still city-centric, so rural fleets experience fewer gains until national roll-outs mature.[2]
Convergence of Telematics and AI-powered Route Engines
Modern engines ingest vehicle diagnostics, fuel-burn curves, driver fatigue sensors, and live congestion feeds to maximize multiple objectives: cost, speed, emissions, and driver safety simultaneously. Predictive maintenance schedules now feed directly into route assignments, preventing breakdowns that derail tight delivery promises. Long-haul carriers report 1-2% fuel-burn reductions once AI models reorder delivery sequences based on historical terrain, load weight, and traffic cyclicality.[3]
Dynamic Pricing Models Lowering TCO for SMB Adopters
Cloud platforms popularized pay-per-use and savings-share models that eliminate large upfront license fees. Local courier firms can deploy enterprise-grade optimization within days, capitalizing on shared algorithm improvements drawn from anonymized fleet data. Outcome-based contracts align vendor incentives with client productivity gains, accelerating adoption among cost-sensitive markets.
Restraints Impact Analysis of Route Optimization Software Market*
| Restraint | (~) % Impact on CAGR Forecast | Geographic Relevance | Impact Timeline |
|---|---|---|---|
| Complex data rights in crowdsourced driving datasets | -1.5% | Global, with stricter enforcement in Europe | Medium term (2-4 years) |
| Driver push-back against hyper-dense delivery schedules | -2.1% | Global, with concentration in developed markets | Short term (≤ 2 years) |
| Limited map accuracy in emerging markets rural networks | -1.2% | Asia-Pacific, Africa, and Latin America rural areas | Long term (≥ 4 years) |
| Fragmented last-mile regulations raising compliance cost | -1.8% | Global, with particular complexity in Europe and North America | Medium term (2-4 years) |
| Source: Mordor Intelligence | |||
Complex Data Rights in Crowdsourced Driving Datasets
GDPR and similar statutes curtail the volume and granularity of behavioral data available for machine-learning pipelines. Software vendors must embed consent management, data lineage tracking, and selective deletion workflows that inflate compliance overhead. Smaller vendors lacking dedicated legal teams face barriers to cross-border expansion, nudging market concentration upward as well-capitalized players absorb compliance costs.[4]
Driver Push-back Against Hyper-dense Delivery Schedules
Field reports show that optimization algorithms often overlook curb-side realities, parking scarcities, building access codes, and dwell times, creating schedules drivers deem unrealistic. Unions and gig-driver coalitions have launched strikes across major metros, forcing fleets to insert buffer times and human override mechanisms. These manual interventions erode projected efficiency gains and can lengthen ROI horizons, especially where labor negotiations remain volatile.
*Our forecasts treat driver/restraint impacts as directional, not additive. The impact forecasts reflect baseline growth, mix effects, and variable interactions.
Route Optimization Software Market Segment Analysis
By Solution Component:
Services Growth Outpaces PlatformsSoftware platforms retained a 62.15% stake in the Route Optimization Software market share during 2025, reflecting their role as the backbone of automated dispatch systems. Consulting and integration services, though smaller in absolute value, are growing at 14.08% CAGR as enterprises grapple with multi-vendor IT landscapes and change-management hurdles. Implementers re-engineer warehouse workflows, transportation management system interfaces, and CRM notifications to unlock software-promised savings. Vendors increasingly bundle advisory engagements, recognizing that platform deployments without process redesign rarely achieve double-digit delivery-cost reductions.
Enterprises also lean on services teams for ongoing model-tuning, benchmarking, and edge-case exception handling, which are critical once fleets scale beyond pilot districts. As a result, recurring optimization-as-a-service contracts are cannibalizing perpetual licenses, smoothing revenue streams for providers. The Route Optimization Software market size allocated to professional services is expected to cross USD 4.72 billion by 2031, signaling a shift toward outcome-based collaboration models.


By End-user Vertical:
Food Delivery Drives Fastest GrowthRetail and FMCG suppliers dominated revenue, yet on-demand food delivery is accelerating with a 15.03% CAGR as 30-minute promise windows become a competitive baseline. The Route Optimization Software market size tied to meal-delivery fleets will exceed USD 2.32 billion by 2031, fueled by dynamic rider pools and perishable payloads that demand real-time recalculations. Algorithms must re-optimize routes every few minutes, balancing heat-loss constraints and kitchen throughput.
Field services, healthcare, and ride-hailing each require tailored constraint libraries, temperature monitoring for pharmaceuticals, technician skill matching, or driver re-positioning models. Such verticalization spurs vendors to release plug-ins rather than one-size-fits-all engines, fragmenting the platform landscape but lifting total addressable value across specialized niches.
By Size of Organization:
SMEs Embrace Cloud-native SolutionsLarge multinationals held 61.05% of the Route Optimization Software market size in 2025, deploying sophisticated multi-modal coordinators that integrate air cargo, rail, and drayage legs. However, SMEs display the strongest 14.12% CAGR because cloud deployments slash infrastructure and support burdens. Usage-based fees align with sporadic shipment volumes, making optimization economical for regional couriers and specialty distributors.
SME uptake is also propelled by intuitive dashboards and wizard-based route builders that forego steep learning curves. As marketplaces and e-commerce platforms embed “optimize” buttons within seller portals, micro-merchants gain one-click access to routing intelligence once reserved for enterprises. This democratization widens competitive parity, pressuring incumbents to investigate hyper-local service guarantees.
By Deployment Mode:
Cloud Dominance Reflects Real-time RequirementsCloud configurations captured 65.74% of the Route Optimization Software market share in 2025 and are tracking a 13.95% CAGR through 2031. Real-time API calls to traffic, weather, and point-of-delivery confirmation systems saturate bandwidth that on-premise instances struggle to provision. Auto-scaling elasticity handles seasonal spikes, holiday e-commerce, and harvest logistics without cap-ex overruns.
Nevertheless, sectors handling sensitive military or pharmaceutical payloads persist with on-premise or hybrid deployments. Edge-optimized appliances now run localized optimization for minute-by-minute updates while synchronizing anonymized aggregates to cloud models for fleet-wide learning. Such architectures blend compliance with innovation, a compromise likely to sustain a double-digit hybrid footprint across heavily regulated verticals.
Geography Analysis
North America Route Optimization Software Market
North America commanded 38.05% of 2025 revenue, buoyed by e-commerce maturity and acute driver shortages that make algorithmic mileage savings mission-critical. Amazon’s proprietary systems set benchmarks that ripple through competitors, while Canada leverages cross-border modules to synchronize NAFTA corridors. Mexico’s manufacturing upswing drives inbound-outbound balancing algorithms that minimize empty miles across industrial clusters. Regional regulatory stances toward data sharing remain comparatively lenient, enabling rapid roll-out of driver-behavior training and fuel-savings dashboards.
APAC Route Optimization Software Market
Asia-Pacific is the fastest-expanding theatre, clocking a 14.82% CAGR on the back of megacity congestion and state-sponsored digital logistics schemes. India’s ULIP ushers standardized data pipes among 500-plus carriers, allowing small fleets to tap shared optimization engines without bespoke integrations. China’s 5G-blanketed metros support sub-second recalculations for grocery and parcel delivery swarms, while Japan’s “2024 Problem” overtime cap mandates productivity jumps to keep freight flowing despite constrained driver hours. Southeast Asian growth rides on smartphone-first commerce, cloud penetration, and rising export-oriented manufacturing zones requiring synchronized port logistics.
Europe Route Optimization Software Market
Europe exhibits steady uptake driven by environmental regulation. Low-emission zones across more than 250 cities impose time-window and payload constraints that only AI-enhanced routing can satisfy economically. The EU’s Digital Transport and Logistics Forum releases harmonized APIs that trim compliance costs for cross-border consignments. Yet GDPR’s stringent consent rules restrain crowdsourced telemetry usage, nudging vendors to pioneer privacy-preserving learning techniques such as federated optimization and differential masking.
Mordor Intelligence provides coverage of the route optimization software market across other key regional markets. Detailed country-level analysis extends to United Kingdom incorporating local coverage and market participation, as required.
Regulatory Landscape
Regulation is increasingly embedding digital, auditable data requirements into freight operations, pulling route optimization software closer to compliance workflows. In the European Union, the eFTI Regulation (EU) 2020/1056 is driving the digital exchange of regulatory freight information, and Commission Implementing Regulation (EU) 2025/2243 finalized functional requirements for eFTI platforms on November 6, 2025. This raises the need for routing platforms to support standardized data formats, authority-facing interfaces, and traceable decision logs as Member States and industry prepare for full operational requirements by December 2026.
Road-transport rules are also tightening the planning constraints the software must handle. Under EU Mobility Package I, cabotage limits and the vehicle return rule impose hard scheduling constraints, while the second-generation smart tachograph (G2V2) requirements, effective July 1, 2026, expand to include light commercial vehicles over 2.5 tonnes engaged in international transport. That broadening increases compliance-driven demand for routing that accounts for duty-time, border crossings, and vehicle eligibility. In the United States, the USDOT 2026 National Freight Strategic Plan under 49 USC 70102 reinforces data-driven bottleneck identification and intelligent transportation systems adoption, aligning public-sector freight programs with quantitative methodologies that interact with commercial routing, telemetry, and corridor analytics.
Value Chain Analysis
The route optimization software value chain starts with inputs that determine routing fidelity: digital maps and geocoding, real-time traffic and weather feeds, telematics and ELD/tachograph signals, and customer, order, and depot master data. These inputs are then normalized within routing engines (constraint modeling, optimization solvers, and increasingly AI-assisted planning) and delivered via cloud platforms, APIs, and mobile driver apps for navigation, proof-of-delivery, and exception handling. Downstream, value is captured when optimized plans are embedded into daily operations through integrations with TMS, WMS, OMS, and ERP, followed by execution analytics that track miles, stops per hour, service-time adherence, and emissions reporting where required.
Services and ecosystem partners are key value-chain enablers because the most difficult steps sit outside the core solver, including integration, data governance, change management, and continuous model tuning. Last-mile execution remains a recurring bottleneck, with the last mile often cited as 30-50% of delivery cost, so driver reality constraints such as parking availability, loading zones, building access, and time-dependent congestion differentiate solution performance. Vendor ecosystems increasingly package routing alongside fleet and telematics stacks, for example linking route planning to predictive maintenance or driver safety analytics, so optimization outcomes drive dispatch actions, maintenance scheduling, and customer communication rather than staying as static plans.
Competitive Landscape
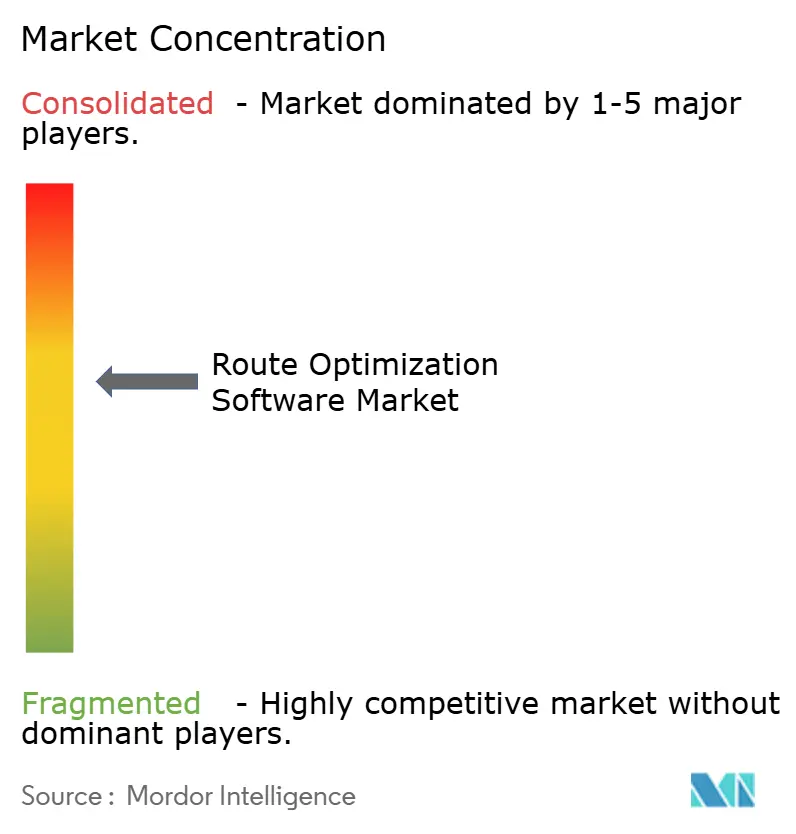
The Route Optimization Software market features moderate fragmentation, but consolidation trends are unmistakable as telematics giants acquire niche AI specialists. Trimble’s 2025 partnership with Microsoft Azure adds predictive maintenance, folding route planning into broader fleet-health ecosystems. Verizon Connect exploits its 5G backbone to launch sub-second rerouting, differentiating against legacy batch-processing rivals. ORTEC extends capabilities into electric-vehicle range modeling, positioning for fleets migrating to zero-emission vans.
Emerging cloud-native entrants court SMEs with wizard-driven UIs and pay-per-delivery pricing, capturing share in segments historically underserved by enterprise-centric suites. Vertical specialists such as Locus.sh for healthcare logistics and Bringg for driver coaching underscore the value of domain-specific constraint libraries. Intellectual property moats revolve around real-time compute architectures, federated privacy safeguards, and proprietary data partnerships with mapping or traffic-sensor providers. Market incumbents must either accelerate in-house AI investments or pursue tuck-in acquisitions to stave off niche erosion.
Route Optimization Software Industry Leaders
-
Trimble Inc.
-
Verizon Connect Solutions Inc.
-
The Descartes Systems Group Inc.
-
Omnitracs LLC
-
ORTEC B.V.
- *Disclaimer: Major Players sorted in no particular order
Route Optimization Software Market Companies Covered in this Report
- Trimble Inc.
- Verizon Connect Solutions Inc.
- The Descartes Systems Group Inc.
- Omnitracs LLC
- ORTEC B.V.
- ESRI Global Inc.
- Caliper Corporation
- PTV Planung Transport Verkehr GmbH
- Paragon Software Systems PLC
- Microlise Group PLC
- Route4Me LLC
- Routific Solutions Inc.
- InsightGeeks Solutions Pvt. Ltd (TrackoBit)
- WorkWave LLC
- Wise Systems Inc.
- Bringg Delivery Technologies Ltd.
- FarEye Technologies Pvt. Ltd.
- Locus.sh (Marble Automation Pvt. Ltd.)
- OptimoRoute Inc.
- Mapbox Inc.
Market Opportunities and Future Outlook
Sustainability-linked routing is creating a clear whitespace for translating optimization outputs into auditable carbon measurement and reporting for fleets and shippers. In January 2026, SimpliRoute disclosed operational results from 2025 in Mexico that it tied to avoided travel (139.74 million km), fuel savings (17.47 million liters), and emissions avoided (29,345 metric tons of CO2). In March 2026, it launched the NetZero platform in Brazil for real-time CO2 monitoring integrated with route optimization. This is pushing vendors to productize emissions accounting, route-level carbon attribution, and customer-facing sustainability dashboards as standard modules rather than as custom projects.
A second opportunity is extending optimization beyond urban delivery into heavier, multi-modal, and mission-critical operations where time, fuel, and safety constraints are more sensitive to weather and traffic variability. In March 2026, Heerema Marine Contractors announced a partnership with Amphitrite to run a data-driven voyage optimization pilot that cut the North Atlantic transit of its crane vessel Sleipnir by 2.5 days, illustrating demand for optimization that fuses routing with external risk and environmental data. Fleet operators are also operationalizing AI routing in day-to-day dispatch at scale, including in May 2026 when Net Zero Logistics moved fleet operations to Finmile and reported a shift from managing roughly 30-40 routes daily down to 16-20 routes. This points to commercial pull for tools that combine automation, exception handling, and integration into execution systems rather than standalone planning.
Recent Industry Developments in Route Optimization Software Market
- June 2026: Trimble introduced Saved and Shared Routes capability in Trimble PC*Miler Web to centralize route creation and distribute standardized routes across teams. The update improves enterprise governance for route templates and supports faster onboarding of planners and drivers across multi-site fleets. It also reinforces the shift toward cloud-managed route libraries that can be updated and reused as operating constraints change.
- January 2026: The Descartes Systems Group announced that Supergasbras modernized complex LPG distribution operations using Descartes routing and fleet management across more than 400 trucks. The deployment points to demand for cloud-based planning and execution in regulated, safety-sensitive distribution with dense multi-stop routing. It also expands Descartes presence in Latin American fleet digitization programs where routing, compliance, and service reliability are closely linked.
- April 2025: The Descartes Systems Group acquired a last-mile optimization specialist for USD 125 million to strengthen urban delivery orchestration capabilities. The transaction reflects ongoing consolidation as larger logistics technology providers add specialized routing IP and last-mile features rather than building them solely in-house. It also accelerates feature bundling across route planning, dispatch, and execution analytics within broader logistics platforms.
Route Optimization Software Market Report Scope and Research Methodology
Market Definition and Coverage
For this methodology, the market covers revenues earned from route optimization software that helps plan, sequence, and re-optimize multi-stop routes using constraints like time windows, distance, and vehicle limits, across commercial fleet use cases.
Scope exclusions: We exclude generic navigation apps and mapping-only tools that do not provide optimization logic for multi-stop fleet routing.
Segments Covered in This Report
- By Solution Component
- Software Platforms
- Services
- By End-user Vertical
- On-Demand Food Delivery
- Retail and FMCG
- Field Services
- Ride Hailing and Taxi Services
- Healthcare and Pharmaceuticals
- Other End-user Verticals
- By Size of the Organization
- Small and Medium Enterprises
- Large Enterprises
- By Deployment Mode
- Cloud
- On-Premise
- By Geography
- North America
- United States
- Canada
- Mexico
- South America
- Brazil
- Argentina
- Rest of South America
- Europe
- Germany
- United Kingdom
- France
- Italy
- Spain
- Rest of Europe
- Asia-Pacific
- China
- Japan
- South Korea
- India
- Singapore
- Australia
- Rest of Asia-Pacific
- Middle East and Africa
- Middle East
- Saudi Arabia
- United Arab Emirates
- Turkey
- Rest of Middle East
- Africa
- South Africa
- Nigeria
- Egypt
- Rest of Africa
- Middle East
- North America
Data Sources, Market Sizing, and Validation
Desk Research
Desk research starts by anchoring the demand pool in observable fleet activity and digital logistics adoption, then mapping that into the portion of software spend addressable by route optimization tools. We use public sources such as the US Bureau of Transportation Statistics, Eurostat transport statistics, the International Transport Forum (OECD), and the World Bank logistics indicators to understand shipment intensity, urban delivery pressure, and fleet utilization patterns.
To convert activity into spend ranges, we also review materials such as SEC filings, investor presentations, and product documentation that indicate pricing approaches, contract structures, and the move from on-premise licenses to subscriptions. For triangulation, supportive signals come from patent databases for routing and optimization themes, and from select paid subscriptions that provide company financials and news coverage. Where available, shipment-level trade and tender databases are used to sanity-check enterprise buying behavior. The sources listed here are illustrative only, and many other public and proprietary references were used for data collection, validation, and clarification.
Primary Interviews and Surveys
Primary work focused on interviews and structured surveys with software users and channel-side experts, including fleet operations leaders, dispatch managers, logistics planners, and implementation partners across major regions. These inputs were used to confirm typical buyer requirements, average contract values, renewal behavior, and the share of routing spend that is truly optimization (not just tracking or basic dispatch). When estimates showed large variance across countries or verticals, the key assumptions were re-checked with the same input categories.
Distribution of primary research fieldwork respondents
| Company type | Respondent position | Region |
|---|---|---|
| Top tier: 29% | CXOs: 15% | APAC: 44% |
| Mid tier: 54% | Functional/Unit leaders: 41% | EMEA: 32% |
| Smaller Players: 17% | Managers: 44% | Americas: 24% |
Market-Sizing & Forecasting
The model is built mainly using a top-down demand pool approach, where fleet and delivery activity indicators are reconstructed by region and then filtered to the share that typically adopts paid optimization software. Once the demand pool is shaped, we translate it into spend using adoption rates and price ranges validated through interviews. Total values are stress-tested using selective bottom-up approximations such as sampled vendor revenue splits and typical subscription ASP times estimated active fleets.
A few practical inputs in this market include growth in last-mile delivery volume, the share of fleets using dispatch and telematics systems, cloud deployment preference, multi-stop route density in urban areas, and expected productivity gains that support software ROI. When bottom-up signals are incomplete, we use adjacent vertical benchmarks (for example, retail delivery versus field service routing) and then apply conservative penetration adjustments so small niches do not get overcounted.
For forecasting, we run scenario analysis and then anchor to an exponential smoothing baseline for recurring subscription revenue. Scenario deltas are guided by expert views on AI-assisted routing adoption, fuel and labor cost pressure, and regulatory or sustainability reporting requirements that can accelerate optimization tool rollouts.
Data Validation & Update Cycle
Estimates are checked through triangulation across demand indicators, pricing ranges, and regional adoption signals, and then any outliers are reviewed at the assumption level before the final numbers are signed off. We also compare outputs to independent signals such as logistics software spending trends, cloud migration pace in transportation, and the presence of optimization features in procurement requirements.
The work is reviewed in multiple steps, including peer checks on formulas, unit conversions, and currency handling, followed by a final sense check on growth paths by geography and use case. Reports are refreshed annually, and interim updates are triggered when material events occur, such as major regulatory changes, sharp pricing resets, or sudden shifts in freight and delivery volumes. Before delivery, an analyst performs a fresh pass so clients receive the latest updated view.
Mordor Intelligence's Route Optimization Software Market Sizing Compared With Other Published Estimates
Published market sizes for route optimization software often do not match because the counted product scope is not the same, and because pricing logic can vary between license-heavy models and subscription-heavy models. Differences also show up when some studies blend route planning, dispatch, and telematics together, and when refresh timing changes the assumed impact of fuel, labor, and e-commerce cycles.
Some external figures fold in broader route planning and management categories and attach a large services component, which pushes the number upward even when software adoption is still uneven by vertical. In Mordor Intelligence, route optimization is counted when the tool is sold as paid optimization software for multi-stop fleet routing, and adjacent navigation-only, tracking-only, or generic fleet management spend is kept out. Totals are converted using consistent USD timing.
Benchmark comparison
| Source | Market Size | Gaps in Research Methodology |
|---|---|---|
| Mordor Intelligence | USD 7.92 B (2025) | |
| Industry Research Publisher A | USD 7.20 B (2025) | Often treats professional services, training, and support as a larger bundled share, and may apply blended pricing that underweights higher-value enterprise optimization subscriptions. |
| Industry Research Publisher B | USD 4.30 B (2025) | Uses a narrower definition focused on route planning and management software, which can exclude higher-end dynamic optimization modules and some logistics-focused fleet use cases. |
The comparison shows that the spread is mainly explained by what gets counted as software versus services, and whether planning-only tools are treated as equivalent to optimization. Our approach stays traceable to a repeatable demand pool, validated price ranges, and clear inclusions, which helps keep the estimate consistent across regions and update cycles.
Key Questions Answered in the Report
What is the projected CAGR for the Route Optimization Software market to 2031?
The market is slated to expand at a 13.32% CAGR from 2026 to 2031.
Which region will register the fastest growth through 2031?
Asia-Pacific leads with a 14.82% CAGR driven by smart-logistics programs and 5G coverage.
Why are services growing faster than software platforms?
Enterprises need integration, change management, and model-tuning expertise to capture full optimization benefits, pushing services to a 14.08% CAGR.
How are 5G networks influencing route optimization?
5G enables sub-second route recalculations via edge computing, enhancing real-time fleet responsiveness in dense urban areas.
What challenges limit software adoption among fleets?
Data-privacy compliance, driver push-back against dense schedules, and inconsistent rural mapping accuracy temper adoption rates.
How are SMEs benefiting from cloud-native route solutions?
Usage-based fees and no-infrastructure deployments allow SMEs to deploy enterprise-grade optimization quickly and cost-effectively.