
Market Overview
| Study Period | 2021 - 2031 |
|---|---|
| Forecast Data Period | 2026 - 2031 |
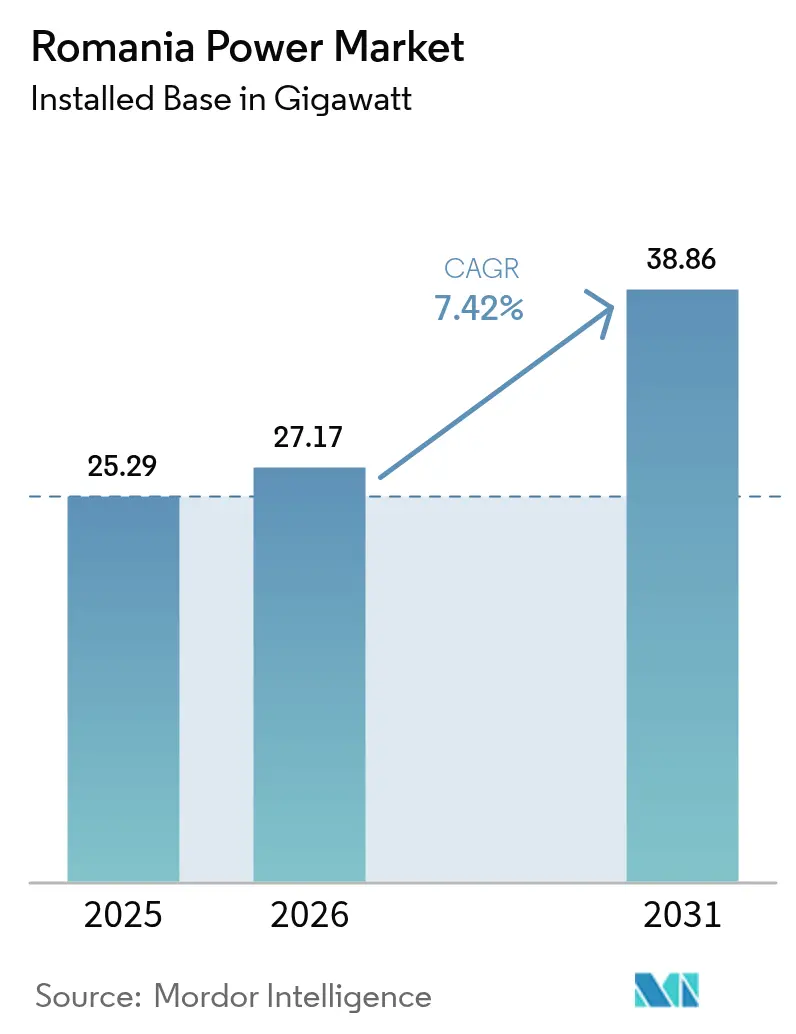
| Base Year Market Size (2025) | 25.29 gigawatt |
| Market Volume (2026) | 27.17 gigawatt |
| Market Volume (2031) | 38.86 gigawatt |
| Growth Rate (2026 - 2031) | 7.42 % |
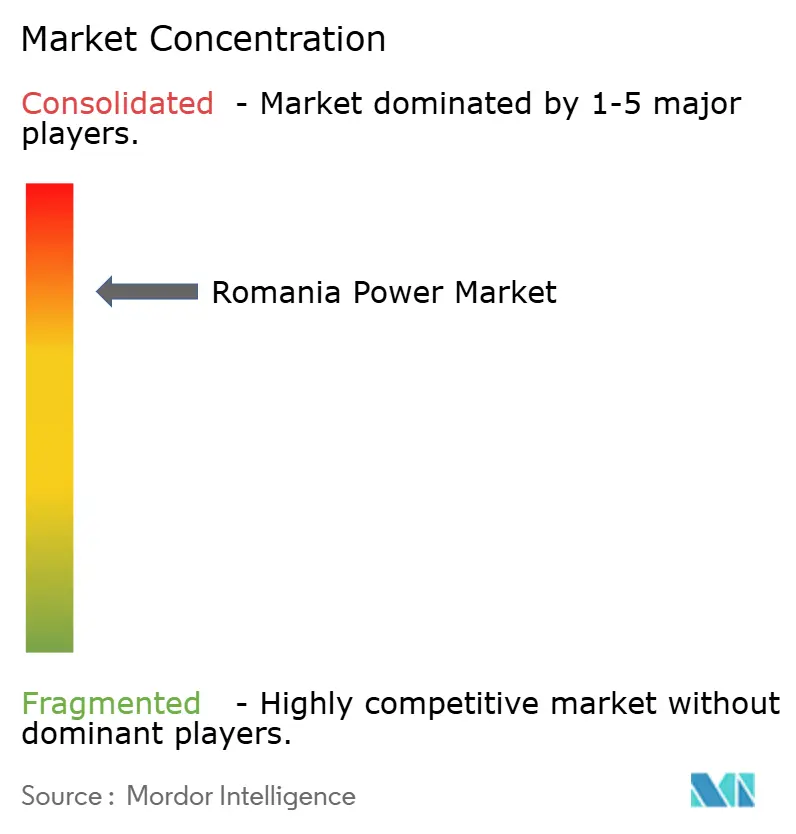
| Market Concentration | High |
Major Players *Disclaimer: Major Players sorted in no particular order Image © Mordor Intelligence. Reuse requires attribution under CC BY 4.0. | |
Romania Power Market Analysis by Mordor Intelligence
The Romania Power Market size was valued at 25.29 gigawatt in 2025 and estimated to grow from 27.17 gigawatt in 2026 to reach 38.86 gigawatt by 2031, at a CAGR of 7.42% during the forecast period (2026-2031).
Current growth hinges on three structural shifts: steady retirement of coal assets, rapid solar and wind build-out enabled by the 2024 Contracts for Difference (CfD) scheme, and visible progress on grid-modernization projects supported by EU grants. Developers now face fewer regulatory hurdles after 2022 permitting reforms, while auction-indexed strike prices below wholesale averages have derisked merchant exposure and attracted broad international equity interest. Rising corporate demand for long-term renewable power-purchase agreements (PPAs) is amplifying investment in behind-the-meter solar-plus-storage, and fresh capital from the Hidroelectrica IPO and OMV Petrom’s renewables acquisitions is intensifying competition across asset classes. Simultaneously, the Black Sea offshore wind framework unlocks a large maritime resource that can diversify the generation mix, provided transmission upgrades arrive on schedule.
Key Report Takeaways
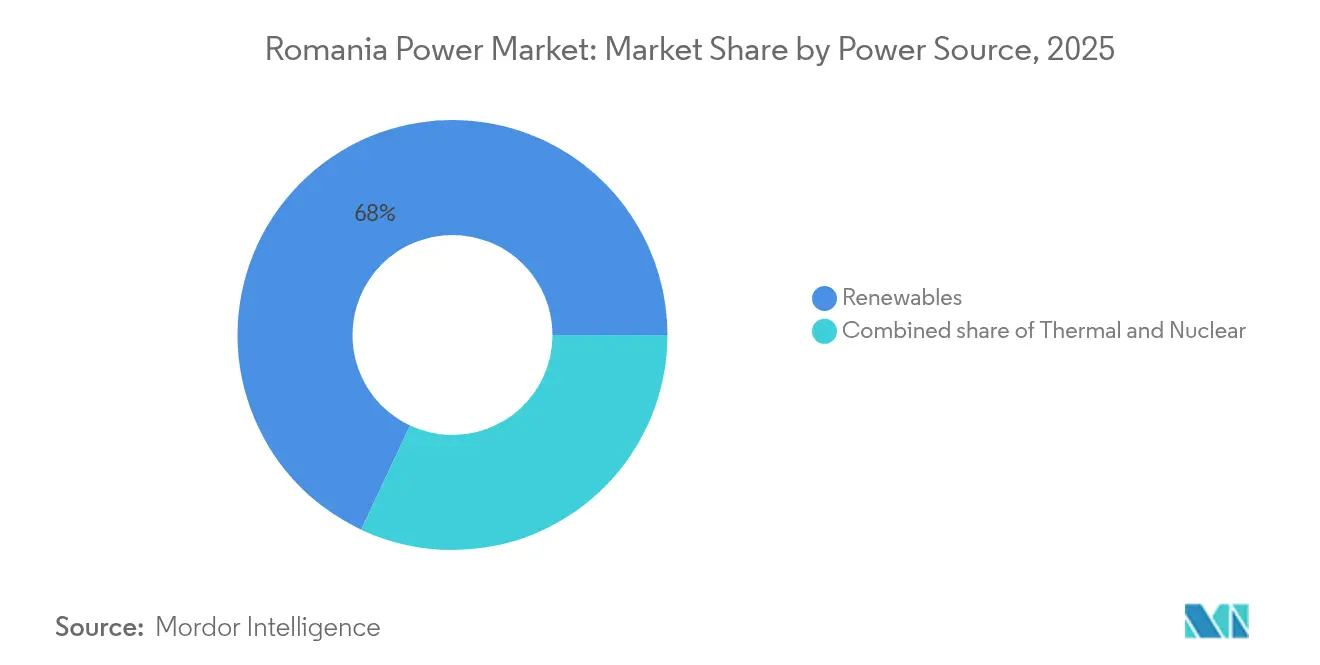
- By power source, renewables led with 68.02% of Romania's power market share in 2025, and the segment is forecast to grow at an 8.48% CAGR through 2031.
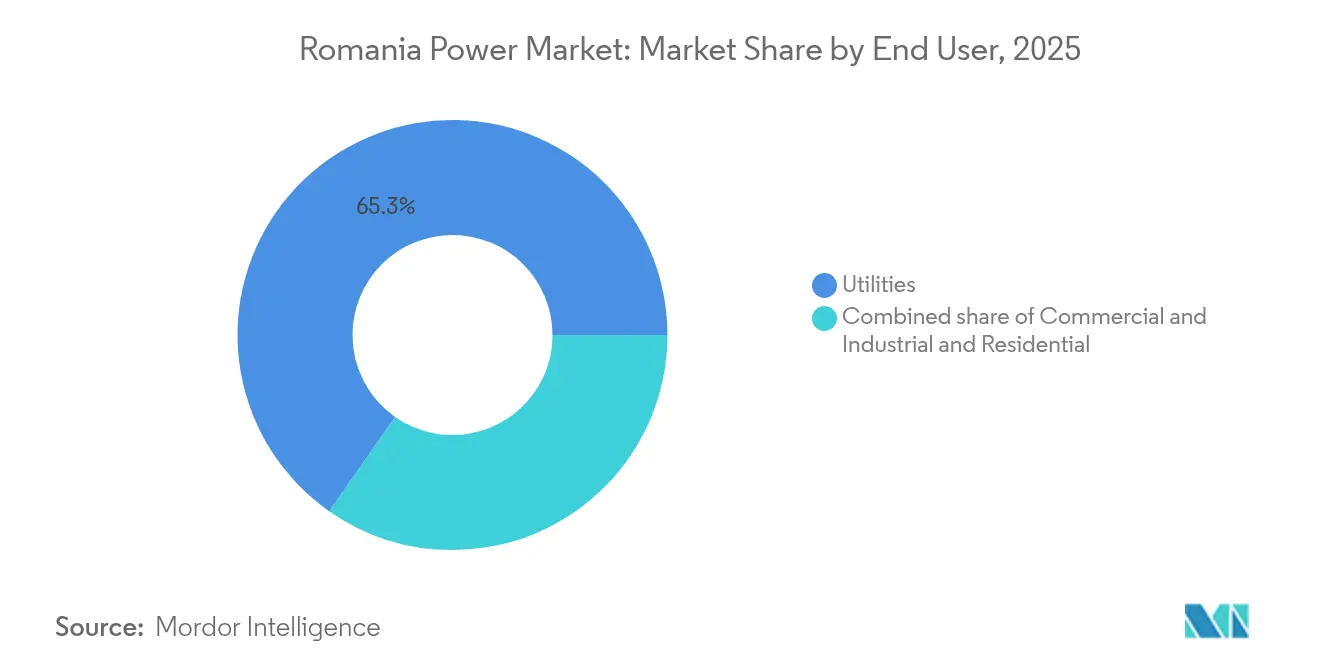
- By end user, utilities accounted for 65.28% of the market in 2025, while the commercial and industrial segment is projected to expand at a 8.98% CAGR to 2031, outpacing utilities and residential customers.
- Hidroelectrica, OMV Petrom, and Nuclearelectrica together controlled more than 55% of total installed capacity in 2024, highlighting the weight of state-influenced incumbents.
Note: Market size and forecast figures in this report are generated using Mordor Intelligence’s proprietary estimation framework, updated with the latest available data and insights as of 2026.
Romania Power Market Trends and Insights
Drivers Impact Analysis*
| Driver | (~) % Impact on CAGR Forecast | Geographic Relevance | Impact Timeline |
|---|---|---|---|
| EU Green Deal decarbonisation targets | +1.8% | National, strongest momentum in Dobrogea and Transylvania | Long term (≥ 4 years) |
| Rising corporate PPA demand from energy-intensive exporters | +1.2% | Prahova, Argeș, Timiș industrial corridors | Medium term (2-4 years) |
| EU-funded grid-modernisation grants | +1.0% | Priority high-voltage corridors and smart-meter zones | Medium term (2-4 years) |
| Newly-approved Black Sea offshore-wind framework | +1.5% | Coastal counties Constanța and Tulcea | Long term (≥ 4 years) |
| Smart-meter rollout enabling prosumers & VPPs | +0.7% | Major urban centers | Short term (≤ 2 years) |
| Cross-border interconnector upgrades | +0.5% | Border regions Banat and Oltenia | Medium term (2-4 years) |
| Source: Mordor Intelligence | |||
EU Green Deal Decarbonisation Targets Drive Capacity Additions
Romania’s pledge to supply 38% of electricity from renewables by 2030 has reoriented national planning toward wind, solar, and hydropower build-out. Approval of a EUR 3 billion CfD program in November 2024 allocated 5 GW at winning strike prices of EUR 65/MWh for wind and EUR 51/MWh for solar, well below the 2024 day-ahead wholesale average.[1]European Commission, “State Aid SA.109966 (2023/N)–Romania–Contracts for Difference Scheme,” europa.eu Utility-scale solar installations jumped by 2 GW in 2024 alone, illustrating how quickly projects move once grid links and land permits are secured. Wind growth lags due to longer environmental assessments, yet Dobrogea’s 7 m/s resource remains attractive for developers with seasoned local partners. The upcoming carbon border adjustment mechanism further encourages domestic manufacturers to switch to low-carbon electricity, reinforcing demand certainty for new plants.
Rising Corporate PPA Demand from Energy-Intensive Exporters
Romanian automotive, steel, and chemicals groups now favor multi-year PPAs to hedge OPCOM price swings and satisfy Scope 2 reporting under the Corporate Sustainability Reporting Directive. NextE’s 42.9 MW on-site solar deal signed in 2024 priced power near EUR 50/MWh, beating the prior year’s EUR 90–120/MWh wholesale range. This differential triggered fresh tenders in Timiș and Argeș and pushed local lenders to refine credit benchmarks for long-term offtakes. An EIB survey found 81% of firms rating energy costs a top competitiveness threat, with 57% spending on on-site efficiency upgrades and 90% on greenhouse-gas measures.[2]European Investment Bank, “EIB Investment Survey 2024–Romania Factsheet,” eib.org As the PPA ban lifted in 2022, bankable offtakes became feasible, transferring volume risk away from utilities and into bilateral contracts.
EU-Funded Grid-Modernisation Grants Unlock Transmission Capacity
Transelectrica received EUR 56.2 million in 2024 to pilot solar-plus-storage at 29 high-voltage substations, aiming to smooth renewable ramps and defer costly line upgrades.[3]Transelectrica, “RRF Pilot Projects,” transelectrica.ro The EBRD’s EUR 100 million loan to PPC’s distribution arm and Electrica’s EUR 171 million smart-meter rollout anchors wider digitalization that improves load forecasting and voltage management. Romania’s vintage 1970s network lacks dynamic line rating, leading to midday solar curtailment in southern counties. Competitive auctions for scarce grid-connection capacity, proposed by ANRE in 2024, intend to prioritize projects offering firm capacity or co-located batteries. Without these upgrades, the 5 GW awarded under the CfD scheme risk commissioning delays and squeezed returns.
Newly-Approved Black Sea Offshore Wind Framework
Law 128/2024 opened Romania’s exclusive economic zone to 3–7 GW of offshore wind by 2035, giving developers access to capacity factors above 45% and avoiding much of the onshore permitting pushback.[4]World Bank, “Romania Offshore Wind Roadmap,” worldbank.org The BSOG consortium targets a 3 GW shallow-water array with the first turbines expected in 2027, while Verbund secured leases for adjacent sites. Absence of a pre-built offshore grid requires private financing of subsea cables, adding EUR 1–2 million/km and lengthening payback periods. A Germany-style centralized grid model could cut costs and accelerate schedules, but would need fresh legislation and public funding.
Restraints Impact Analysis*
| Restraint | (~) % Impact on CAGR Forecast | Geographic Relevance | Impact Timeline |
|---|---|---|---|
| High upfront CAPEX & permitting lead-times | -1.3% | Natura 2000 zones, archaeological clusters | Medium term (2-4 years) |
| Ageing grid causes renewable curtailment risk | -0.9% | Constanța, Tulcea, Dolj | Short term (≤ 2 years) |
| Wholesale price caps undermine PPA bankability | -0.6% | All merchant generators | Short term (≤ 2 years) |
| Biodiversity pushback against onshore wind repowering | -0.4% | Dobrogea plateau, Carpathian foothills | Long term (≥ 4 years) |
| Source: Mordor Intelligence | |||
High Upfront CAPEX & Permitting Lead-Times
Utility-scale PV typically clears permits within three years, yet wind projects average 6.5 years because multi-agency reviews include environment, heritage, and land-use approvals. Archaeological rules require digs within 500 m of ancient sites, impacting roughly 30% of planned Dobrogea wind locations. Developers also shoulder substation costs that can exceed EUR 50 million before grid access is guaranteed. ANRE’s proposal for capacity auctions adds further uncertainty, potentially pushing smaller independent power producers out of contention, given higher carrying costs.
Ageing Grid Causes Renewable Curtailment Risk
Legacy conductors lack phase-shifting transformers, so Transelectrica cuts renewable output during high-irradiance or high-wind intervals to preserve system frequency. Curtailment reached 150 GWh in 2024, equal to -1% of renewable production, and could double by 2027 without accelerated upgrades. Battery pilots at 29 substations help, yet nationwide reinforcement needs EUR 2–3 billion, well beyond the current EU grant envelope. Distribution feeders in rural solar clusters also breach voltage limits, requiring reactive-power devices that add unforeseen OPEX for utilities.
*Our forecasts treat driver/restraint impacts as directional, not additive. The impact forecasts reflect baseline growth, mix effects, and variable interactions.
Segment Analysis
By Power Source: Renewables Dominate Amid Coal Phase-Out
Renewables contributed 68.02% of 2025 capacity, and their 8.48% growth pace keeps the Romania power market size expansion aligned with EU emission goals. Hydropower alone held a 33.12% share, courtesy of Hidroelectrica’s 6.5 GW fleet that supports peak shaving and frequency response. Wind capacity reached 3 GW, with 2.5 GW more awarded in the CfD auction at EUR 65/MWh, pricing that underlines a maturing cost curve. Solar jumped past 5.3 GW after 2 GW was connected in 2024, helped by modules priced below USD 0.18/W and fast-track permits for projects under 10 MW. The Black Sea offshore framework could add 3–7 GW by 2035, giving Romania a fresh nucleus for high-factor generation and bolstering energy-security margins. Gas-fired capacity rises modestly as flexible CCGTs linked to Neptun Deep output replace retiring coal. Nuclear remains vital; Cernavoda Units 1-2 generate one-fifth of supply, while Units 3-4 plus the 462 MW Doicești SMR will anchor firm, low-carbon baseload later in the decade.
The shift reshapes asset economics, as capacity-weighted average LCOE for new projects reaches EUR 48/MWh for solar and EUR 56/MWh for onshore wind, both below 2024 wholesale prices. Curtailment risk tempers enthusiasm in congestion-prone southern counties, yet co-located storage can secure higher balancing fees. Accordingly, project sponsors aggregate PV with 4-hour batteries sized at 25% of nameplate capacity to capture arbitrage spreads.


By End User: Industrial Offtakers Accelerate PPA Adoption
Utilities still owned 65.28% of capacity in 2025, but the 8.98% CAGR expected for commercial and industrial offtakers signals a decisive decentralization of the Romania power market. Automotive hubs in Timiș and Argeș host rooftop solar arrays coupled with lithium-ion batteries that flatten demand peaks and cut grid fees. NextE’s 42.9 MW PPA at EUR 50/MWh triggers competitive follow-ons, with multinationals demanding supply chain carbon cuts ahead of the 2026 carbon border adjustment. Lenders restrict PPAs to investment-grade buyers, limiting access for SMEs and concentrating deals among export-oriented corporates.
Residential prosumers already add meaningful volume: systems average 13 kW and feed surplus into distribution networks under yearly net-billing terms, raising the Romania power market size for distributed generation. Smart-meter deployment unlocks time-of-use rates and prospective VPP remuneration, though settlement backlogs frustrate early adopters. Utilities respond by proposing tariff structures that reward afternoon self-consumption to relieve network stress.
Geography Analysis
Dobrogea hosts the largest wind clusters and will likely anchor the first Romanian offshore projects, giving the region both onshore and maritime leverage over future renewable additions. Transmission corridors to Bucharest are mid-upgrade, and sustained curtailment risk remains until 2027 line reinforcements come online. Oltenia’s high irradiance propels solar greenfield activity, with over 40% of the 2 GW PV built in 2024 situated here. Retiring lignite assets in Turceni and Rovinari free up skilled labor and grid nodes ideally suited to solar-plus-storage retrofits.
Transylvania blends moderate wind and solar resources with strong industrial demand, making it fertile ground for corporate PPAs. Cross-border lines into Hungary and Serbia enable exporters to arbitrage spot spreads, improving project bankability. Banat benefits from the new 400 kV Serbia link, which trimmed redispatch costs for wind farms during winter 2024 congestion events.
Bucharest and Ilfov account for roughly one-fifth of national consumption. Lacking local generation, the capital relies on inland hydropower, Dobrogea wind, and imported baseload. Smart-meter rollouts improve peak-load visibility and support demand-response pilots that shave evening ramps. Ongoing synchronization work with Ukraine and Moldova positions Romania as a continental transit hub, enhancing merchant revenue options for generators grappling with domestic price caps.
Regulatory Landscape
Romania's electricity sector operates under the primary framework of Law No. 123/2012, with ANRE serving as the main regulator for licensing, authorizations, and market participation rules. In November 2024, the European Commission approved Romania's state-aid backed Contracts for Difference (CfD) program (EUR 3 billion), supporting auction-based procurement for new wind and solar capacity and creating a clearer route-to-market for utility-scale renewables.
In 2026, ANRE tightened execution discipline around new-build projects through amendments to the licensing and authorization regulation, advanced via a second phase of public consultation (April 2026), and by introducing or strengthening financial guarantee requirements. These include a 30 EUR/kW guarantee tied to construction authorizations and a 20,000 EUR/MW guarantee for capacity allocation for 2026. In parallel, government measures extending end-user protection and price interventions during 1 April 2025 to 31 March 2026 continued to shape PPA bankability and the merchant risk profile, while grid-access rule changes aimed to reduce speculative grid bookings that contribute to connection backlogs.
Competitive Landscape
Romania's power market competition intensified after Hidroelectrica's EUR 1.3 billion IPO in July 2024, which funds a 1.4 GW wind-solar pipeline and signals a shift from hydro-only dominance toward integrated renewables. OMV Petrom's 50% stake in Electrocentrale Borzești added a 1 GW green portfolio, illustrating oil majors' rapid pivot into low-carbon assets. Independent power producers such as Tinmar and nextE differentiate by bundling storage and offering sub-EUR 60/MWh long-term corporate PPAs.
Technology now underpins strategic advantage: developers that integrate batteries or commit to synthetic inertia win grid-connection priority. Nuclearelectrica's EUR 20 billion roadmap includes two CANDU expansions and a Doicești SMR, promising 1.9 GW of zero-carbon baseload toward decade-end. Meanwhile, CEZ Romania expanded Europe's largest onshore wind complex to 733 MW, bolstering scale economies.
White-space exists in virtual power plants and offshore wind. Aggregators plan to pool 500 MW of distributed storage once ANRE finalizes VPP rules, while Verbund and BSOG advance Black Sea leases requiring capital-intensive subsea connections. Market incumbents, therefore, confront a dual challenge: defend retail margins as prosumers grow, and secure grid access ahead of capacity auctions that may penalize projects lacking firming capabilities.
Romania Power Industry Leaders
Hidroelectrica SA
OMV Petrom SA
Nuclearelectrica SA
PPC (PPC Renewables/ former Enel)
CEZ Romania
- *Disclaimer: Major Players sorted in no particular order

Market Opportunities and Future Outlook
Hybrid renewable-plus-storage builds and grid-side flexibility programs are the most visible areas of whitespace in Romania's power market. The 2024 CfD program (5 GW awarded across wind and solar) offers a bankable offtake route for utility-scale projects, while corporate PPAs (including NextE's 42.9 MW on-site solar deal signed in 2024 at around EUR 50/MWh) are supporting demand for behind-the-meter generation and co-located batteries. On the networks side, Transelectrica's EU-supported pilot to deploy solar-plus-storage at 29 high-voltage substations (EUR 56.2 million awarded in 2024) and distribution digitalization programs, including smart-meter rollouts backed by Electrica and financing for PPC's distribution arm, create room for storage integrators, aggregators, and grid automation vendors, particularly where curtailment risk is higher in southern counties.
Investors are also targeting firm and flexible capacity additions as coal units retire and system balancing requirements increase. In 2026, Romania has multiple large gas projects with defined commissioning targets, including Romgaz stating its commitment to commission the 430 MW Iernut gas-fired plant by end-2026, and government-level engagement around the 1,700 MW Mintia gas-fired plant, with commissioning tests scheduled for 2026 and production estimated to start in September 2026. Offshore wind provides another medium-term opening following Law 128/2024 in the Black Sea, with developers such as the BSOG consortium and Verbund advancing positions, but the lack of a pre-built offshore grid keeps subsea cable delivery and transmission upgrades central to project economics and timelines.
Recent Industry Developments
- May 2026: Hidroelectrica awarded and signed a contract worth about 151.2 million lei with Enevo Group SRL to build the 45.94 MWp Tudor Vladimirescu photovoltaic plant in Braila County. The project supports Hidroelectrica's shift from a hydro-dominated portfolio toward integrated renewables and adds execution momentum to its post-IPO renewables pipeline.
- September 2025: Nuclearelectrica and a banking syndicate led by J.P. Morgan SE signed financing agreements covering two strategic projects: refurbishment of Cernavoda NPP Unit 1 and development work for new nuclear capacity at Cernavoda (Units 3 and 4). Securing structured financing supports multi-year capital programs that underpin Romania's firm, low-carbon generation base and reduces schedule risk for large nuclear milestones.
- June 2024: Nuclearelectrica and Canadian nuclear partners signed a framework agreement for the Cernavoda NPP Unit 1 refurbishment project. The agreement strengthened the supplier and engineering collaboration for extending Unit 1's operating life, reinforcing the role of nuclear in Romania's reliability and decarbonization pathway.


Research Methodology Framework and Report Scope
Market Definition and Coverage
This market is defined as Romania's installed electricity generation capacity, measured in gigawatts (GW), across main grid-connected power sources that supply electricity to end users.
Scope exclusions: We exclude electricity trading value, retail billing value, transmission and distribution service value, fuel supply, and power EPC contracting value.
Segmentation Overview
- By Power Source
- Thermal (Coal, Natural Gas, Oil and Diesel)
- Nuclear
- Renewables (Solar, Wind, Hydro, Geothermal, Biomass & Waste, Tidal)
- By End User
- Utilities
- Commercial and Industrial
- Residential
- By T&D Voltage Level (Qualitative Analysis only)
- High-Voltage Transmission (Above 230 kV)
- Sub-Transmission (69 to 161 kV)
- Medium-Voltage Distribution (13.2 to 34.5 kV)
- Low-Voltage Distribution (Up to 1 kV)
Data Sources, Market Sizing, and Validation
Desk Research
Desk work was used to map Romania's power system and set a clean base year for installed capacity by technology. We relied on public time series so that capacity additions, retirements, and reclassifications could be tracked in a consistent way across years.
Key references included non paywalled sources such as Romania's energy regulator publications, the national TSO and market operator statistics, Eurostat energy balances, IEA electricity datasets, and ENTSO-E transparency data. We also reviewed company annual reports and investor presentations for asset additions and closures, and reputable press releases for commissioning dates and policy changes. Where needed, we used paid subscription databases for company financials and for news and filings to cross check ownership and timeline details. These examples are not exhaustive, and many other public documents were also used for data collection, validation, and clarification.
Primary Interviews and Surveys
We conduct interviews and surveys with generators, utilities, project developers, grid specialists, suppliers, and large electricity users within Romania. Responses help confirm commissioning dates, coal retirement plans, connection delays, utilization expectations, and the effect of CfD support. We compare these findings with secondary data and recheck unusual answers before finalizing assumptions.
Distribution of primary research fieldwork respondents
| Company type | Respondent position |
|---|---|
| Top tier: 28% | CXOs: 15% |
| Mid tier: 52% | Functional/Unit leaders: 30% |
| Smaller Players: 20% | Managers: 55% |
Market-Sizing & Forecasting
Sizing starts with a top-down reconstruction of installed capacity by technology, using official capacity registers and grid level statistics to anchor the base year, then layering additions and retirements year by year. To keep totals realistic, we corroborate the output with selective bottom-up approximations, such as rolling up a sample of known plants in the development pipeline and validating typical unit sizes and timing through channel feedback.
The model uses practical inputs that can be tracked and refreshed, including grid connected capacity by source, announced projects with expected COD, retirement and refurbishment schedules for older thermal units, and grid connection constraints that affect realizable builds. Demand and peak load direction are also used to inform capacity needs. When project level detail is missing, the gap is handled through conservative timing shifts and technology averages, then corrected once commissioning signals appear in public updates.
For forecasting, scenario analysis is applied around policy and execution variables such as permitting speed and grid readiness, and then the most likely path is selected based on what primary experts see as deliverable. The result is an installed capacity forecast tied to observable system events that can be reproduced using the same input series.
Data Validation & Update Cycle
Outputs are checked through triangulation across independent signals, so the final capacity curve aligns with what is visible in system statistics and with known plant events. Analysts run variance checks versus historical build rates, technology share shifts, and publicly tracked commissioning and closure timelines. Any large deviation triggers a re-check of assumptions, followed by targeted expert follow ups.
Before sign off, the model and key inputs go through multi step reviews focused on unit consistency, definition alignment, and year to year continuity. Reports are refreshed annually, with interim updates when major commissioning, retirement, or regulatory events materially change the expected capacity path. Right before delivery, an analyst completes a final pass so clients receive the latest updated view.
Mordor Intelligence's Romania Power Market Size Compared With Other Published Estimates
Published estimates for Romania's power market can differ because some sources size installed generation capacity, while others size the wider electricity value chain in revenue terms, and these do not measure the same thing. The gap is larger when transmission, distribution, and retail service value are included, since those add monetary totals that sit outside a GW capacity measure.
By tracking technology-wise capacity additions and retirements, checking commissioning dates against grid level updates, and keeping currency conversion out of the core metric, Mordor Intelligence produces a capacity-anchored view that will naturally diverge from revenue based totals.
Benchmark comparison
| Source | Market Size | Gaps in Research Methodology |
|---|---|---|
| Mordor Intelligence | USD 25.29 B (2025) | |
| Industry Publisher A | USD 14.70 B (2026) | This estimate is presented as a revenue style power sector value, and it bundles generation with transmission, distribution, and retail services, which inflates totals versus an installed capacity style measure. |
| Industry Publisher B | USD 19.62 B (2025) | This number appears closer to a capacity snapshot converted into a monetary figure, where the assumed price basis and the timing of capacity registers can move the result if late year connections or reclassifications are not captured. |
The spread is mainly explained by unit choice, scope boundaries, and the timing of the underlying inputs. When the market is held to generation capacity signals and each yearly change is tied back to commissioning and retirement updates, the result stays transparent and easier to replicate during refresh cycles.


Key Questions Answered in the Report
How large is the Romania power market in 2026?
The Romania power market size stands near 27.17 GW in 2026, on track with the 7.42% CAGR that points toward 38.86 GW by 2031.
How fast is renewable capacity growing in the Romania power market?
Renewable installations are forecast to rise at an 8.48% CAGR through 2031, lifting their share above 70% of total capacity.
What role do corporate PPAs play in new project financing?
Long-term PPAs priced near EUR 50/MWh give industrial buyers price certainty and supply certificates, anchoring financing for on-site and utility-scale solar projects.
Will offshore wind meaningfully diversify Romania's generation mix?
Yes, the Black Sea framework targets 3-7 GW by 2035, offering capacity factors above 45% and lowering reliance on onshore resources.
How are grid constraints being addressed?
EU-funded upgrades include 400 kV line reinforcements, substation-level batteries, and a 2.8 million smart-meter rollout to handle bi-directional flows.
Is nuclear power expanding in Romania?
Nuclearelectrica plans to add 1,448 MW at Cernavoda and a 462 MW SMR at Doicesti, securing carbon-free baseload for the early 2030s.
What is the outlook for coal plants?
All lignite units are slated for retirement by 2032, making room for gas-fired flexibility and accelerating renewable deployment.
Page last updated on:


 Your data is secure and never sold or shared.


