
Rodenticides Market Size and Share
Market Overview
| Study Period | 2021 - 2031 |
|---|---|
| Market Size (2026) | USD 6.29 Billion |
| Market Size (2031) | USD 7.94 Billion |
| Growth Rate (2026 - 2031) | 4.78 % |
| Fastest Growing Market | Asia Pacific |
| Largest Market | North America |
| Market Concentration | High |
Major Players *Disclaimer: Major Players sorted in no particular order Image © Mordor Intelligence. Reuse requires attribution under CC BY 4.0. | |
Rodenticides Market Analysis by Mordor Intelligence
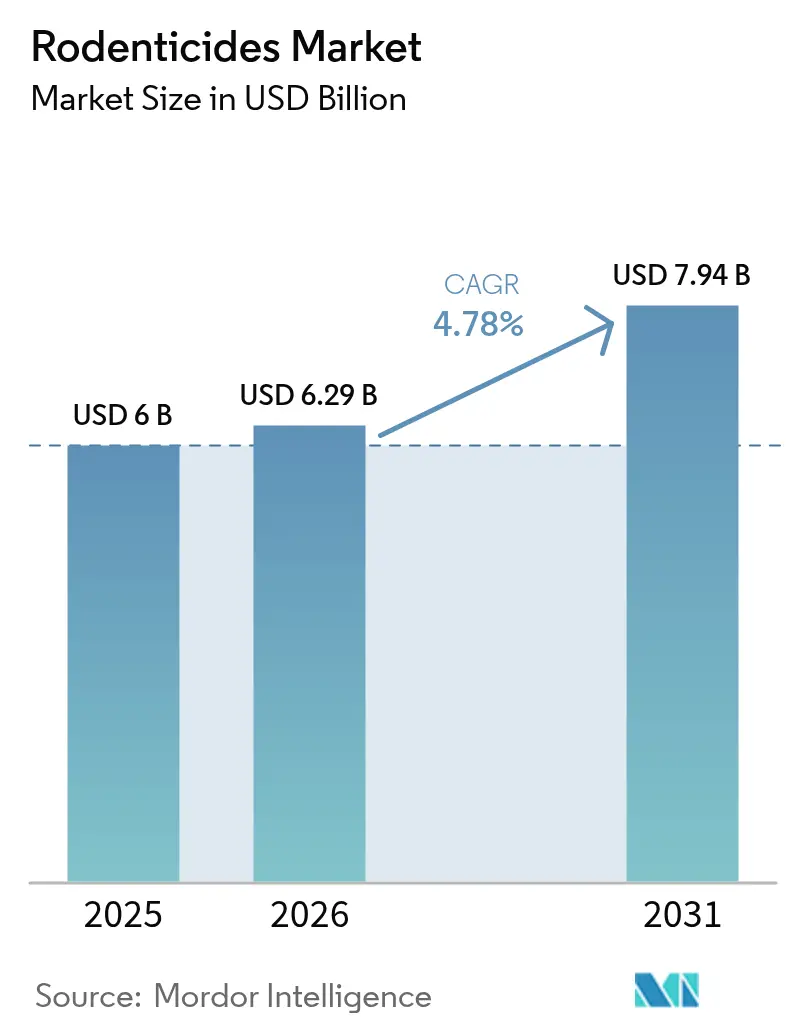
The rodenticides market size is expected to grow from USD 6.0 billion in 2025 to USD 6.29 billion in 2026 and is forecast to reach USD 7.94 billion by 2031 at 4.78% CAGR over 2026-2031. Rising climate-driven rodent populations, widening food-security gaps, and tightening public-health standards keep demand resilient across agricultural, commercial, and residential settings. Stringent sanitation rules in global food trade, combined with extended breeding seasons in warmer urban environments, amplify the need for reliable chemical and non-chemical solutions. Regulatory shifts restricting second-generation anticoagulant rodenticides (SGARs) in California and the United Kingdom accelerate innovation in low-toxicity flocoumafen and fertility-control products. Digital monitoring, including IoT-enabled bait stations, is lowering labor costs for pest-control operators while giving manufacturers new avenues to differentiate offerings.
Key Report Takeaways
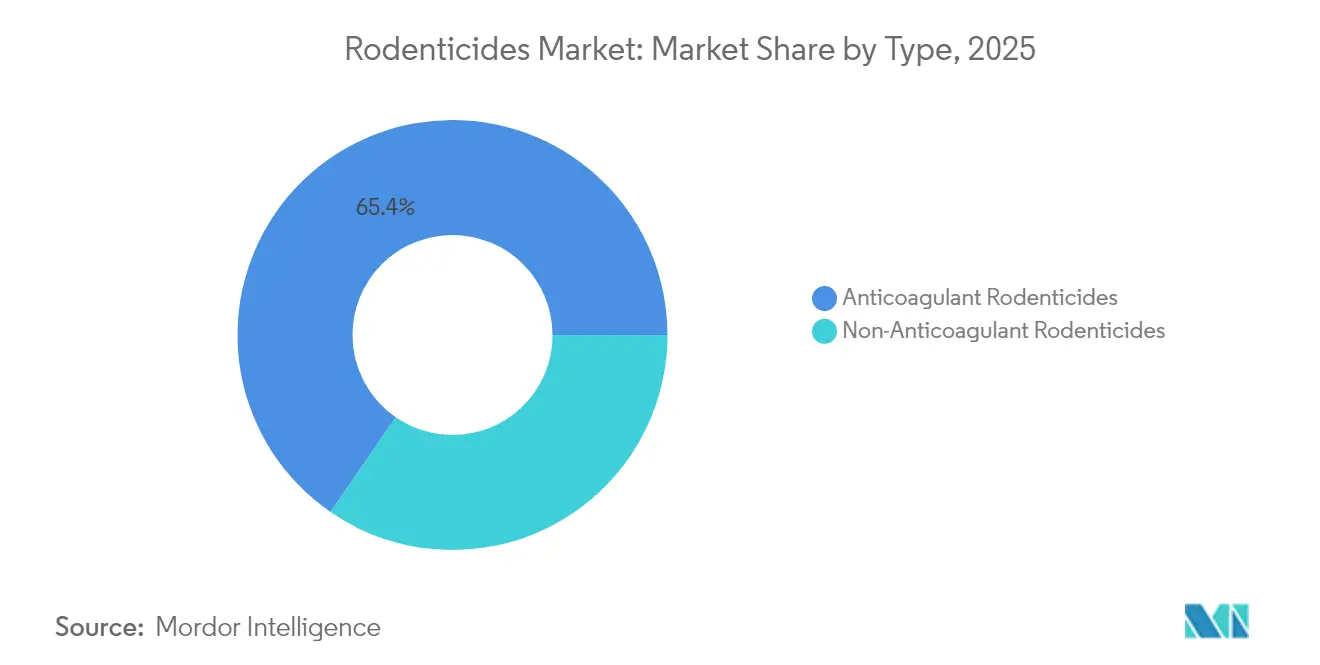
- By type, anticoagulants captured 65.40% of the 2025 rodenticide market size, and non-anticoagulants are projected to grow fastest at a 7.35% CAGR to 2031.
- By form, blocks led with 44.30% of the rodenticides market share in 2025, whereas liquid concentrates are set to expand at a 7.05% CAGR through 2031.
- By application, commercial and industrial premises held a 37.40% share of the rodenticides market size in 2025, while residential buildings are projected to rise at a 6.25% CAGR to 2031.
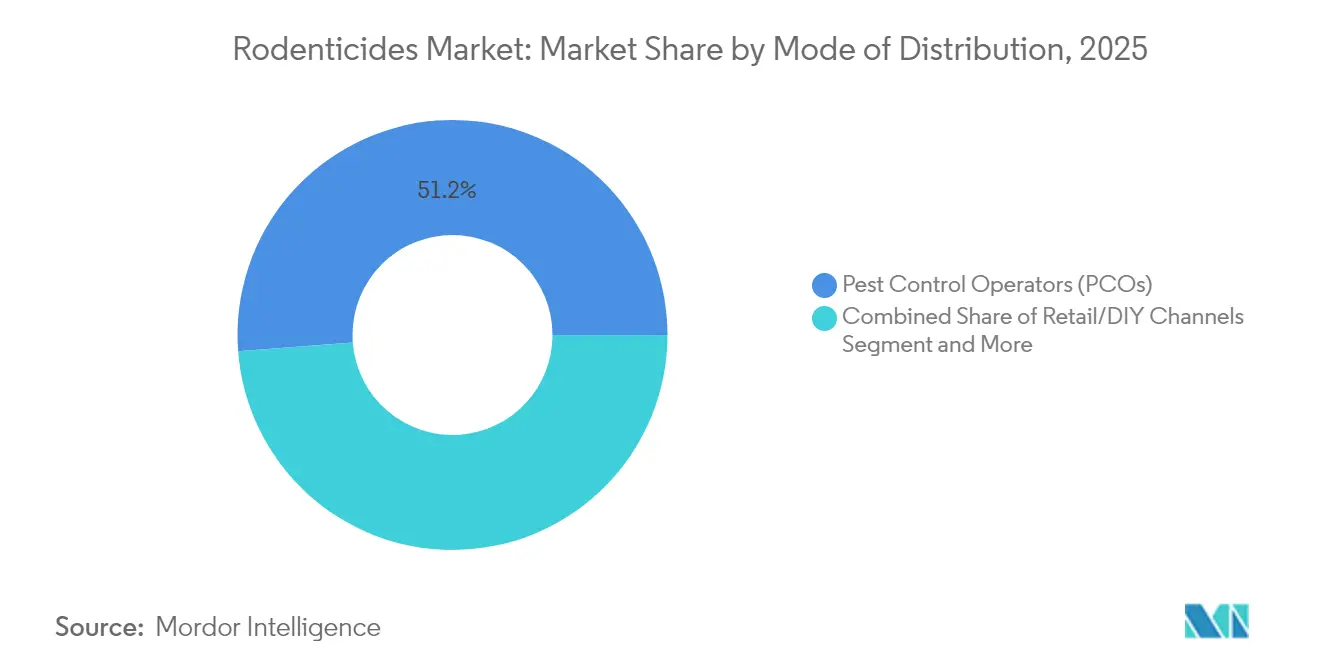
- By distribution, pest-control operators accounted for 51.20% of 2025 sales. Government vector-control programs are projected to show the highest CAGR at 7.02% through 2031.
- By geography, North America led with 35.60% of the 2025 rodenticide market share, while the Asia-Pacific region recorded the fastest growth rate of 5.95% between 2026 and 2031.
Note: Market size and forecast figures in this report are generated using Mordor Intelligence’s proprietary estimation framework, updated with the latest available data and insights as of 2026.
Market Trends and Insights
Drivers Impact Analysis of Rodenticides Market*
| Driver | (~) % Impact on CAGR Forecast | Geographic Relevance | Impact Timeline |
|---|---|---|---|
| Surge in bio-secure commodity trade standards | +0.8% | Global, strongest in North America and Europe | Medium term (2-4 years) |
| Increasing demand for food and agricultural productivity | +1.2% | Global, highest in Asia-Pacific and Africa | Long term (≥ 4 years) |
| Proliferation of large-scale, vertically-integrated farming | +0.6% | Asia-Pacific core, spill-over to South America | Medium term (2-4 years) |
| Rapid urban rodent infestations linked to climate change | +0.9% | Global, concentrated in major metropolitan areas | Short term (≤ 2 years) |
| Adoption of single-dose, eco-labeled second-generation anticoagulants | +0.4% | North America and Europe, expanding to Asia-Pacific | Medium term (2-4 years) |
| Subsidized rodent-borne zoonosis prevention programs | +0.5% | Middle East, Africa, and South America | Long term (≥ 4 years) |
| Source: Mordor Intelligence | |||
Surge in Bio-secure Commodity Trade Standards
Trade agreements are increasingly requiring certified rodent-control protocols to prevent the transmission of pests across borders, compelling grain terminals, warehouses, and shipping lines to adopt professionally applied rodenticides and integrated pest-management (IPM) plans. Parallel mandates in the European Union and North America tie export eligibility to pest-free storage certificates, prompting exporters to deploy tamper-resistant bait boxes that comply with stewardship codes for second-generation anticoagulant rodenticides (SGAR). These measures shield multi-million-dollar consignments from quarantine holds, making professional-grade rodenticides a frontline tool in safeguarding trade continuity. The economic incentive widens as the Organisation for Economic Co-operation and Development and Food and Agriculture Organization (OECD-FAO) Agricultural Outlook anticipates 1.3% annual growth in consumption through 2032, intensifying pressure on already-stretched logistics networks [1]Source: Organisation for Economic Co-operation and Development, “OECD-FAO Agricultural Outlook 2023-2032,” oecd.org.
Increasing Demand for Food and Agricultural Productivity
Rising calorie needs and climate-induced yield volatility expose grain and horticulture systems to heavier post-harvest losses, which can reach 30-40% in emerging markets when rodent control is inadequate. Field studies across Asia-Pacific rice belts show ecologically based rodent management lifting yields 6-15% and farm incomes beyond 15%, a compelling return on rodenticide investments. In Africa, multimammate rats shave as much as 48% from maize harvests, pushing governments to subsidize broad-acre zinc-phosphide campaigns. The Food and Agriculture Organization confirms that combining structural silo upgrades with targeted chemical control sharply curtails storage losses[2]Source: Food and Agriculture Organization of the United Nations, “Integrated Rodent Management in Grain Storage,” fao.org . As climate shifts stretch breeding seasons, growers scale up from spot treatments to programmatic applications, reinforcing long-run volume growth in the rodenticides market.
Proliferation of Large-scale, Vertically Integrated Farming
Mega-farms standardize pest-management protocols across multiple sites, often outsourcing to certified pest-control operators to ensure compliance and consistent service quality. German pig-production research found that 70% of farms contract professionals, gaining both cost savings and higher efficacy. Bulk purchasing leverages pricing and secures the supply of advanced formulations like cholecalciferol blends, giving the rodenticides market a predictable baseline demand. Precision-agriculture platforms integrate rodent activity sensors, guiding bait placement and optimizing consumption, which amplifies the value proposition of digital-ready products.
Rapid Urban Rodent Infestations Linked to Climate Change
Heat-island effects and erratic precipitation favor longer breeding spells for commensal rodents, with Washington D.C. posting the world’s steepest surge in urban rat sightings during 2024. Similar spikes in Paris, Sydney, and Jakarta force municipalities to escalate baiting programs and citizen education. Cities now pair sanitation drives with real-time tracking of bait stations, compelling suppliers to deliver formulations that stay palatable despite outdoor temperature swings and moisture.
Restraints Impact Analysis of Rodenticides Market*
| Restraint | (~) % Impact on CAGR Forecast | Geographic Relevance | Impact Timeline |
|---|---|---|---|
| Rise in the number of resistant pests | -0.7% | Global, most severe in developed markets | Medium term (2-4 years) |
| Environmental and human-health hazards | -0.9% | North America and Europe, expanding globally | Long term (≥ 4 years) |
| Tightening restrictions on outdoor SGAR use | -0.6% | North America and Europe primarily | Short term (≤ 2 years) |
| Growing availability of fertility-control alternatives | -0.3% | North America and Europe, limited elsewhere | Long term (≥ 4 years) |
| Source: Mordor Intelligence | |||
Rise in the Number of Resistant Pests
Genetic mutations, particularly in the Vkorc1 gene, undermine first- and second-generation anticoagulants, raising treatment costs and prolonging infestation timelines. Lebanese fieldwork confirmed resistance in house mice and rats despite limited oversight of rodenticide sales. New Zealand studies detected brodifacoum tolerance in isolated populations lacking prior exposure, hinting at spontaneous resistance via genetic drift[3]Source: Commonwealth Scientific and Industrial Research Organisation, “Brodifacoum Resistance Study,” csiro.au . California ground squirrels now survive diphacinone and chlorophacinone pulses, compelling rotation to zinc-phosphide or cholecalciferol mixtures. Resistance inflates service calls and drives investment in diagnostics, tempering volume growth for legacy chemistries.
Environmental and Human Health Hazards
North American raptor necropsies revealed anticoagulant residues in 951 carcasses spanning three decades[4]Source: Society of Environmental Toxicology and Chemistry, “Anticoagulant Rodenticide Residues in Raptors,” setac.org . In South Africa, 92% of tested caracals carried SGAR traces, with proximity to vineyards identified as a key factor. The United States Environmental Protection Agency suspended dimethyl tetrachloroterephthalate (DCTP) in 2024 due to concerns about its impact on thyroid [5]Source: Office of the Federal Register, “Emergency Suspension of DCPA Registrations,” federalregister.gov . Heightened media coverage fuels consumer pushback, increasing demand for fertility control or mechanical traps in residential segments.
*Our forecasts treat driver/restraint impacts as directional, not additive. The impact forecasts reflect baseline growth, mix effects, and variable interactions.
Rodenticides Market Segment Analysis
By Type:
Anticoagulants Dominate Despite Innovation PressureAnticoagulants secured 65.40% of 2025 revenue, underpinning the rodenticides market leadership story. Their single-dose lethality against resistant strains anchors usage in warehouses and food plants even as regulators trim permissible concentrations. Second-generation molecules, such as brodifacoum, remain favored among professionals, while non-anticoagulant classes are projected to grow at a 7.35% CAGR to 2031, drawing demand toward zinc phosphide and cholecalciferol hybrids. Studies show that zinc phosphide reduced field populations by 58.15%, surpassing traditional first-generation outcomes.
In parallel, bromethalin and strychnine hold niche utility for burrow systems where anticoagulant resistance soars. Regulatory developments against metal phosphides in low-income regions temper broader adoption, yet specialized needs sustain modest demand. Overall, portfolio diversification lets market leaders buffer exposure to any single regulatory clampdown, keeping the rodenticides market adaptable.


By Form:
Blocks Lead While Liquid Concentrates SurgeBlocks retained a 44.30% share of the 2025 market size demand due to weather resistance and compatibility with tamper-proof stations mandated under Second-generation anticoagulant rodenticides (SGAR) stewardship. Professionals appreciate their longevity outdoors, limiting call-backs. Pellets followed, favored for mechanical broadcast across rice paddies and row crops. The rodenticides market size attributable to liquid concentrates is forecast to grow 7.05% CAGR, outpacing overall sector expansion as precision-spray rigs and bait baggers gain traction.
Fieldwork shows that paraffin blocks kept 100% active-ingredient recovery in open air, although 50% detached within five weeks, prompting innovation in anchor systems. Pastes and gels have a growing demand in high-visibility retail and hospitality settings, where discreet application is crucial. Powders are declining due to drift concerns, but retain relevance for fumigant burrow dusting in grain facilities. Ready-to-use sachets meet the demand among homeowners for convenience, but rising licensing barriers on Second-generation anticoagulant rodenticides (SGARs) are tilting the DIY aisle toward first-generation actives or fertility tablets. The move toward internet-connected bait boxes amplifies demand for formulations stable under sensor rigs that log consumption. Manufacturers of engineering denser blocks that resist fragmentation stand to capture incremental volume as service contracts specify reduced site visits.
By Mode of Distribution:
PCO Channel Strength Amid Retail ExpansionPest-control operators (PCOs) held 51.20% of the 2025 distribution, signifying that professional delivery remains central to modern pest management. PCOs utilize route density and telemetry-enabled bait stations to reduce revisit frequency by up to 40%, resulting in an attractive total cost of ownership for clients. Government vector-control programs are projected to chart a 7.02% CAGR to 2031, as public health departments intensify proactive campaigns against hantavirus and leptospirosis.
The mix of retail and DIY stores is shifting from SGARs toward first-generation actives or botanical repellents due to packaging and licensing regulations. Texas’s 16-pound minimum SGAR pack mandate effectively directs casual buyers to alternative options, nudging households toward service contracts. Online platforms emerge as a niche channel, yet most jurisdictions still limit direct-to-consumer sales of professional concentrations.
By Application:
Commercial Dominance Amid Residential GrowthCommercial and industrial premises accounted for 37.40% of 2025 consumption, solidifying their position as the largest rodenticides market application segment. Food processors, pharmaceutical plants, and logistics hubs commit to year-round Integrated Pest Management (IPM) contracts that bundle surveillance tech, sanitation audits, and staged bait rotations. Agricultural fields followed at 36.4%, where seasonal surges in rodent pressure dictate campaign-style applications ahead of harvests.
Warehouses and cold-chain nodes are expanding bait programs as global e-commerce compresses delivery cycles, making infestation a zero-tolerance issue. Post-harvest losses of up to 40% in developing economies underscore the link between effective rodent control and food security outcomes. Residential buildings, although smaller today, are projected to post the fastest 6.25% CAGR through 2031. Urban densification and climate-driven rat booms increase call volume for municipal health departments, prompting city budgets to shift toward integrated rodent control that combines public education with strategic baiting.
Geography Analysis
North America Rodenticides Market
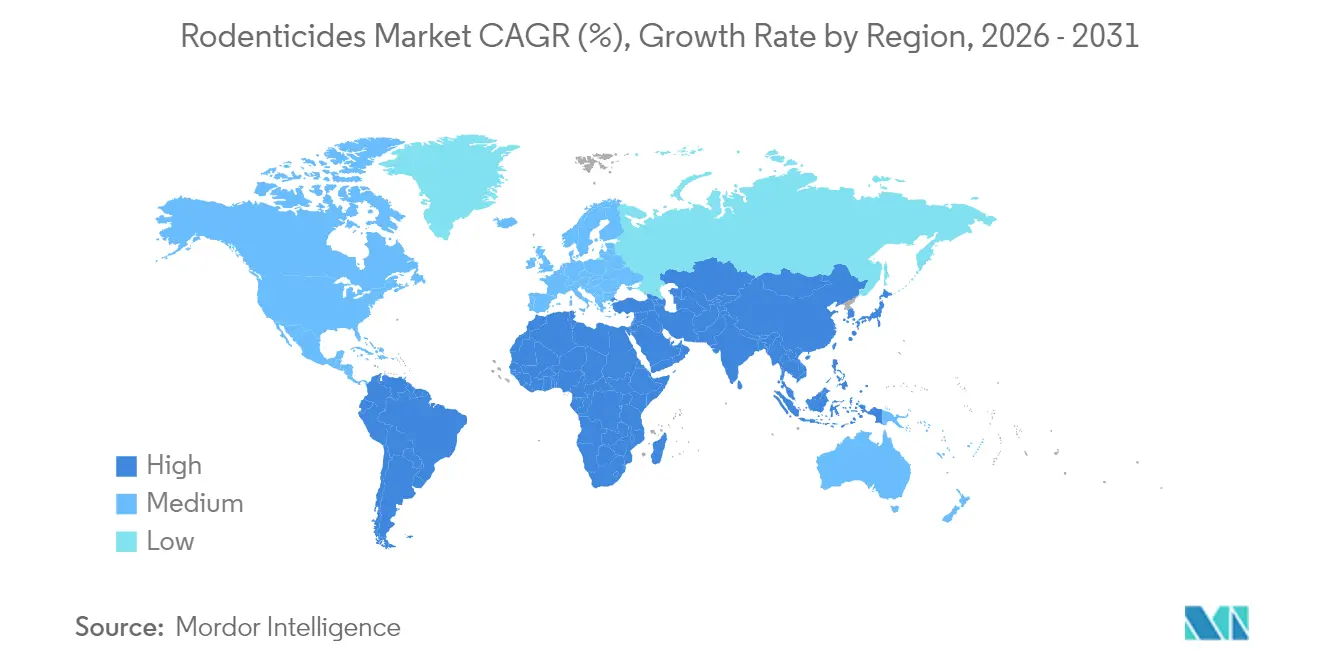
North America maintained the largest regional market share at 35.60% in 2025, reflecting mature regulatory frameworks, high adoption of professional pest control services, and substantial commercial and industrial applications. The region’s leadership stems from stringent food-safety regulations in warehousing and processing facilities, extensive agricultural operations requiring systematic pest management, and urbanization patterns that create ideal conditions for rodent infestations. Growth is projected at 3.98% CAGR through 2031, constrained by environmental regulations yet supported by climate-driven urban rodent population rises and advances in application technology. The Environmental Protection Agency’s comprehensive rodenticide strategy, released in November 2024, delivers regulatory clarity while adding targeted mitigation measures for endangered-species protection.
APAC Rodenticides Market
Asia-Pacific represents the fastest-growing regional segment at a 5.95% CAGR to 2031, propelled by rapid urbanization, agricultural expansion, and heightened food security awareness in developing economies. China’s rodent programs rely heavily on diphacinone for commensal species and zinc phosphide for field pests, with provincial agencies coordinating large-scale campaigns across urban and rural zones. Ecologically-based rodent management has lifted cereal yields by 6-15% and farm income by more than 15% across multiple nations, reinforcing adoption momentum.
EMEA and South America Rodenticides Market
Europe is expected to advance at a 3.65% CAGR through 2031, as harmonized EU rules encourage standardized product labeling and spur the development of eco-friendly formulations. The United Kingdom’s ban on outdoor bromadiolone and difenacoum, effective July 2024, shifts product portfolios toward cholecalciferol and flocoumafen. Africa and the Middle East are projected to post CAGRs of 5.25% and 4.72%, respectively, driven by urban growth, expanding agriculture, and public health measures aimed at controlling rodent-borne diseases. South America is projected to advance at a 5.02% CAGR, with Brazil’s biosecurity-centered trade rules underpinning steady demand. A gradual shift toward ecologically based rodent management in Sub-Saharan Africa signals a strategic evolution, yet acute outbreaks still necessitate conventional rodenticides.
Note: Segment share of all individual segments available upon report purchase

Regulatory Landscape
Rodenticide market access and use conditions are being tightened through endangered-species risk mitigation and state or national stewardship controls. In the United States, the Environmental Protection Agency (EPA) released its rodenticide strategy and final biological evaluation in November 2024, covering 11 rodenticide active ingredients. The agency linked label mitigation measures to Endangered Species Act protection, which is already influencing permitted use patterns across professional and non-professional channels.
At the state level, Maine implemented new restrictions effective June 16, 2026, moving certain pesticide active ingredients (including rodenticides in scope) into Restricted Use Pesticide status. That change requires a valid applicator license for purchase or use. In Europe, the EU Biocidal Products Regulation (BPR) 528/2012 continues to govern rodenticide authorizations for product-type 14, including comparative assessment requirements for anticoagulant products. The European Commission extended the approval timelines for major anticoagulant actives (including brodifacoum, bromadiolone, and difenacoum) through December 31, 2026 via implementing measures during 2024. This keeps products on the market while renewal decisions progress. Parallel legislative activity in US states such as Washington and Vermont has also advanced proposals that identify anticoagulant rodenticides and bromethalin for additional restrictions. Washington outlined a pathway to a January 1, 2027 use moratorium, while Vermont drafts reference limits around environmentally sensitive areas beginning mid-2026, reinforcing the shift toward higher-compliance baiting practices and alternative modes of control.
Competitive Landscape
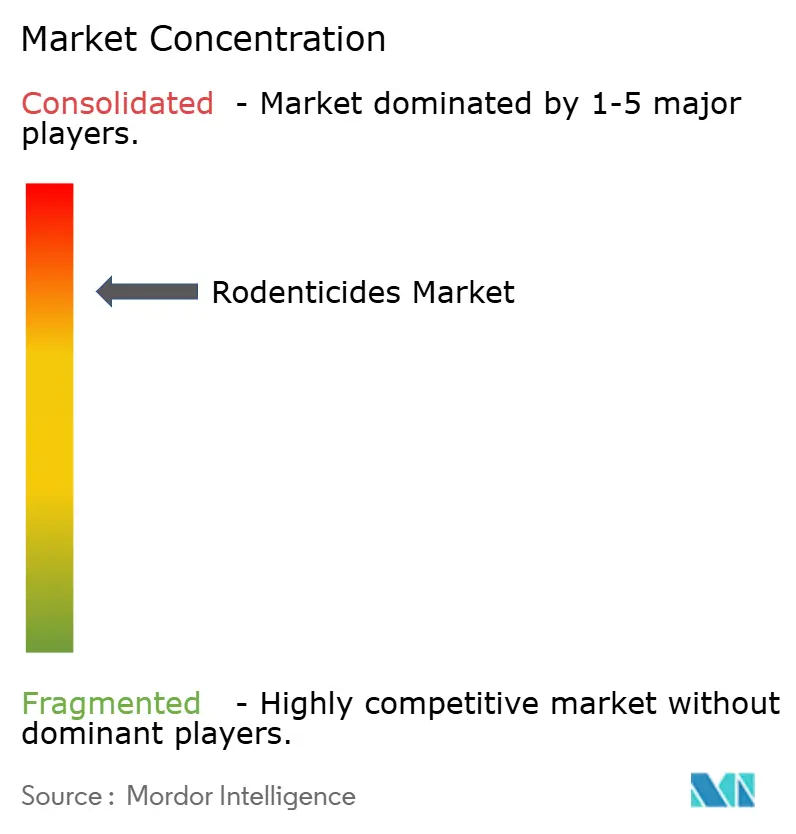
The top five suppliers account for a significant share of the 2024 rodenticide market size revenue, resulting in a highly concentrated market structure for rodenticides. BASF SE leads with the strength of the Selontra (cholecalciferol) and Storm (flocoumafen) brands, while Bayer AG leads through the Racumin (coumatetralyl) lines. Syngenta Group captures a significant share with the Talon and Weatherblok franchises, while Rentokil Initial plc secures a prominent share through service bundling. Liphatech rounds out the group with its advances products, including Rozol and FirstStrike.
BASF announced plans in 2023 to exit difenacoum and redirect research and development toward greener actives, signaling the industry's commitment to lower toxicity profiles. Bayer funnels pipeline capital into formulation technologies that enhance palatability at reduced active loads, doubling as stewardship and cost-of-goods strategies. Syngenta reports mixed sales as channel inventories linger, yet continues to trial data-logging bait stations to integrate chemistry with analytics.
Small entrants focus on niche segments, such as fertility control, with SenesTech’s ContraPest gaining municipal pilots but facing adoption hurdles tied to re-baiting frequency and cost. IoT start-ups supply hardware that lowers operator labor by automating route prioritization, partnering with chemistry majors eager to embed proprietary sensors in bait stations. Patent filings focus on calcium-based matrices and anti-crumble binders that resist fragmentation in high-humidity environments, highlighting formulation science as a durable competitive advantage.
Rodenticides Industry Leaders
BASF SE
Bayer AG
Rentokil Initial plc
Liphatech
Syngenta Group
- *Disclaimer: Major Players sorted in no particular order
Rodenticides Market Companies Covered in this Report
- BASF SE
- Bayer AG
- Syngenta Group
- Liphatech
- Rentokil Initial plc
- Neogen Corporation
- JT Eaton
- Bell Laboratories
- SenesTech Inc.
- PelGar International
- Impex Europa
- Russell IPM
- Truly Nolen
- Vebi Istituto Biochimico
- Fumakilla
- UPL Limited
- Detia Degesch GmbH

Market Opportunities and Future Outlook
Regulatory constraints on outdoor SGARs and documented resistance are creating more room for non-anticoagulant rotations and fertility-control programs within integrated pest management (IPM), particularly where professional service contracts are central to distribution. In June 2026, published research on urban rodents in the US Northeast reported a high prevalence of Vkorc1 mutations linked to anticoagulant resistance in house mice. That finding supports wider adoption of active-ingredient rotation strategies and is adding momentum to alternatives such as zinc phosphide, cholecalciferol-based offerings, and non-lethal fertility control in sensitive use areas.
Agricultural outbreak response and emergency authorizations are also opening near-term commercialization lanes for acute field-use formulations in key grain regions. In May 2026, Australia’s APVMA issued an emergency permit for double-strength zinc phosphide mouse baits (50 g/kg) for grain paddocks in Western Australia and South Australia during mouse-plague conditions, showing how episodic pressure can shift product mix toward fast-acting actives and accelerate uptake of compliant deployment practices. In parallel, telemetry-ready baiting programs offer another opportunity vector. As pest-control operators and large farms adopt data-driven monitoring to reduce labor-intensive inspections, manufacturers that align formulations and packaging with tamper-resistant, trackable bait-station workflows can differentiate within the professional channel that already accounts for the majority of sales.
Recent Industry Developments in Rodenticides Market
- July 2026: SenesTech reported results from a 400-acre farming operation in Dalhart, Texas where its Evolve Rat Birth Control program was associated with an 80% reduction in rodent activity and less damage to underground irrigation infrastructure. The update highlights fertility control as a practical complement to conventional baiting in agricultural settings where infrastructure losses drive purchasing decisions.
- May 2025: Syngenta entered a licensing and supply agreement with Neogen Corporation granting Neogen exclusive rights to market and sell Talon-G and Talon Weatherblok XT rodenticides in the United States and Canada. The agreement reshapes go-to-market execution in North America by shifting two established brands to a specialized partner with channel reach in pest control and animal safety.
- November 2024: The US EPA released its final biological evaluation for 11 rodenticide active ingredients and outlined mitigations under its rodenticide strategy focused on protecting listed endangered species and critical habitat. The action reinforced a compliance-led operating environment for manufacturers and pest-control operators through tighter label use patterns and stewardship requirements.


Rodenticides Market Report Scope and Research Methodology
Market Definition and Coverage
This market covers rodenticide products sold to control commensal rodents in agriculture, food storage and handling sites, industrial and commercial facilities, and households. We size the market in value terms based on sales of rodenticide formulations used for killing or sterilization.
Scope exclusions: Traps, electronic repellents, monitoring devices, and live-capture systems are excluded from this market sizing.
Segments Covered in This Report
- By Type
- Non-Anticoagulant Rodenticides
- Bromethalin
- Cholecalciferol
- Zinc Phosphide
- Strychnine
- Anticoagulant Rodenticides
- First-Generation
- Warfarin
- Chlorophacinone
- Diphacinone
- Coumatetralyl
- Second-Generation
- Difenacoum
- Brodifacoum
- Flocoumafen
- Bromadiolone
- First-Generation
- Non-Anticoagulant Rodenticides
- By Form
- Blocks
- Pellets
- Powders
- Pastes and Gels
- Liquid Concentrates
- By Application
- Agricultural Fields
- Warehouses and Storage Facilities
- Commercial and Industrial Premises
- Residential Buildings
- By Mode of Distribution
- Pest Control Operators (PCOs)
- Retail/DIY Channels
- Government Vector-Control Programs
- By Geography
- North America
- United States
- Canada
- Mexico
- Rest of North America
- Europe
- Germany
- United Kingdom
- France
- Russia
- Spain
- Rest of Europe
- Asia-Pacific
- China
- Japan
- India
- Australia
- Rest of Asia-Pacific
- South America
- Brazil
- Argentina
- Rest of South America
- Middle East
- Saudi Arabia
- United Arab Emirates
- Rest of Middle East
- Africa
- South Africa
- Egypt
- Rest of Africa
- North America
Data Sources, Market Sizing, and Validation
Desk Research
Desk research starts by mapping where rodenticides are legally used and how demand shows up across farm and non-farm settings, so the model does not treat broader pest control spending as rodenticide value. We anchor definitions and adoption context using public sources, including US EPA pesticide registration and reregistration documents, EU regulatory and biocide guidance pages, FAOSTAT crop and production statistics, UN Comtrade trade flows, and peer-reviewed toxicology and pest management journals.
We also review manufacturer annual reports, investor presentations, product labels and safety data sheets, and credible press coverage to confirm formulation trends, channel mix, and price direction. Where needed, paid subscriptions that track company financials, patent filings, and shipment-level trade data are used to cross-check volumes and pricing signals. These desk sources are illustrative only, and additional references are used during the study for data collection, validation, and clarification.
Primary Interviews and Surveys
Primary work focuses on validating what is actually being purchased and applied, then translating that into a realistic price-per-unit and volume picture. We interview manufacturers, formulators, distributors, pest control stakeholders, and large end users across key regions, which helps close gaps on mix shifts (anticoagulants versus non-anticoagulants), compliance-led substitutions, and typical discounting by channel.
Distribution of primary research fieldwork respondents
| Company type | Respondent position | Region |
|---|---|---|
| Top tier: 34% | CXOs: 17% | APAC: 46% |
| Mid tier: 48% | Functional/Unit leaders: 39% | EMEA: 31% |
| Smaller Players: 18% | Managers: 44% | Americas: 23% |
Market-Sizing & Forecasting
The sizing model begins with a top-down build where regulatory-allowed use, crop and grain storage footprint, and urban infestation intensity are translated into an addressable demand pool, which is then converted into value using category-level pricing. To keep the estimates grounded, we use selective bottom-up approximations as cross-checks, such as rolling up a sample of supplier revenues, then sanity-checking implied volumes using typical pack sizes and application frequencies.
Key inputs that shape the model include rodent pressure indicators (seasonality and outbreak reports), acreage and harvested volume for key crops, growth in food warehouses and cold chain capacity, shifts in anticoagulant stewardship rules, and the pricing mix across blocks, pellets, pastes, and concentrates. When country detail is limited, we handle gaps using trade and regulatory proxies, then adjust with interview feedback on local channel structure and price ladders.
For forecasting, we run scenario analysis using a short list of drivers, followed by an exponential smoothing step to avoid overreacting to one-off events. Assumptions on price progression are built from observed inflation, formulation mix changes, and channel discount patterns, then checked again through expert feedback before finalizing the run.
Data Validation & Update Cycle
We check outputs against independent signals such as import and export trends, regulatory actions that can remove or restrict actives, and implied spend per application across major end-use settings. Any large variances are reviewed, and underlying assumptions are revisited. Follow-up calls are triggered when price or volume logic looks inconsistent across regions.
Before sign-off, the model goes through multi-step analyst reviews, including consistency checks across years, currency conversions, and category definitions. Reports are refreshed annually, and interim updates are added when material events occur, such as major regulatory changes or supply disruptions. Right before delivery, we complete a final review pass so clients receive the latest updated view.
Mordor Intelligence's Rodenticides Market Estimate Compared With Other Published Estimates
Published market sizes for rodenticides do not always match because each publisher makes different calls on what to include, which year to treat as the anchor, and how fast prices are assumed to move. Differences also come from currency timing, since average exchange rates versus year-end rates can shift a global total even when underlying volumes are similar.
In this study, extra attention is placed on how ASPs are stepped forward and how outliers are rechecked during refreshes, since rodenticide mix and discounts can change quickly after stewardship actions or label changes, and this refresh-led discipline is applied by Mordor Intelligence.
Benchmark comparison
| Source | Market Size | Gaps in Research Methodology |
|---|---|---|
| Mordor Intelligence | USD 6.00 B (2025) | |
| Global Consultancy A | USD 6.20 B (2025) | Uses a base year anchor that appears to rely more on historical revenue extrapolation, with less explicit adjustment for channel discounting and formulation mix, which can lift the 2025 value versus a price-normalized view. |
| Industry Publisher B | USD 6.60 B (2025) | Likely applies a more aggressive price progression and currency conversion timing, and may include adjacent pest control spends or broader rodent management services, which pushes the 2025 figure higher. |
Overall, the spread is largely explained by how tightly scope is kept to rodenticide product sales, how pricing is normalized across forms and channels, and how currency and timing choices are treated. When those items are defined up front and then revalidated during updates, the resulting market number stays easier to trace back to clear demand and pricing drivers.


Key Questions Answered in the Report
What is the current size of the global rodenticides market?
The market is worth USD 6.29 billion in 2026 and is projected to reach USD 7.94 billion by 2031.
Which region holds the largest revenue share?
North America led in 2025 with a 35.60% share, supported by strict food‐safety regulations and widespread professional pest-control services.
Which region is growing the fastest?
Asia-Pacific posts the quickest expansion at a 5.95% CAGR through 2031, driven by rapid urbanization and rising food-security investments.
What product type dominates global sales?
Anticoagulant rodenticides accounted for 65.40% of 2025 revenue owing to their single-dose efficacy against resistant rodent species.
How are regulations shaping market dynamics?
Measures such as the United Kingdom’s 2024 outdoor SGAR ban tighten use conditions and push manufacturers toward eco-labeled flocoumafen and cholecalciferol formulations.
What technological trends are influencing the sector?
IoT-enabled bait stations that log consumption data are lowering service costs and helping pest-control operators optimize treatment routes.
Page last updated on:


 Your data is secure and never sold or shared.


