
Robotics Market Size and Share
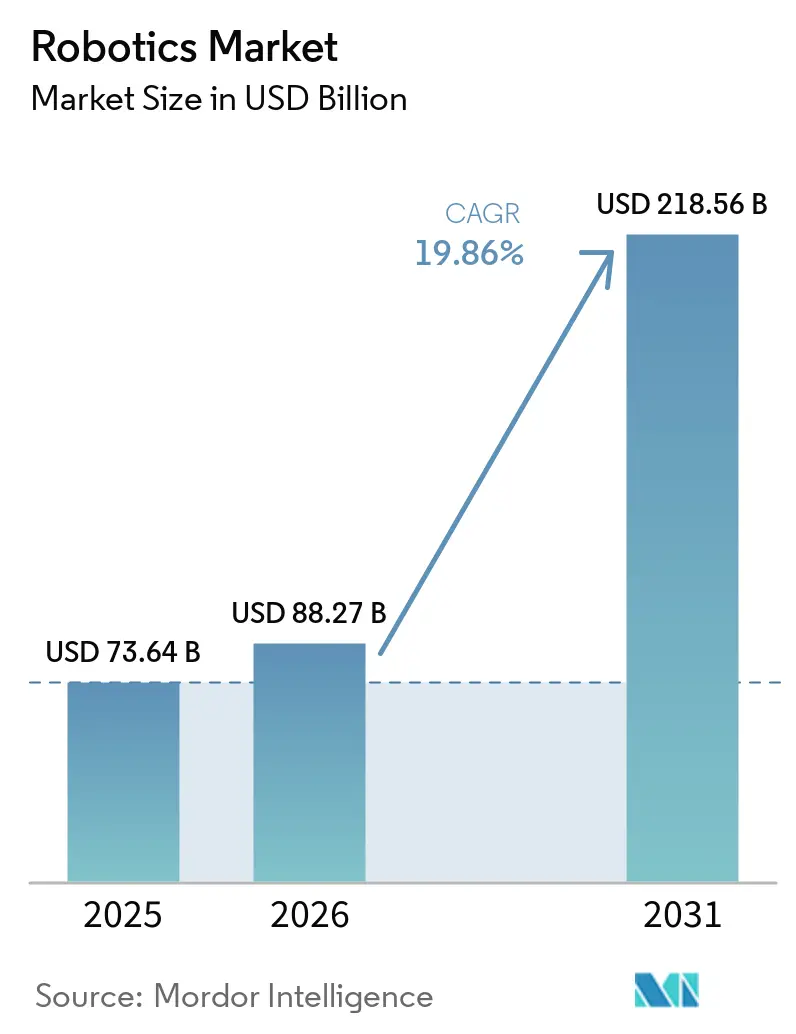
Robotics Market Analysis by Mordor Intelligence
The Robotics Market size is projected to expand from USD 106.69 billion in 2026 and USD 119.5 billion in 2027 to USD 223.28 billion by 2032, registering a CAGR of 13.32% between 2027 and 2032.
Persistent labor shortages are strengthening the case for automation in precision processing and high-mix assembly. The Robotics market is also gaining from wider use in logistics, medical care, agriculture, and security rather than from factory demand alone. Lower hardware costs and simpler programming are making deployments more practical for smaller users and flexible production sites. Warehouse automation, reshoring incentives, and virtual commissioning are changing vendor priorities toward integrated systems, software, and services. Component supply risks and cybersecurity gaps may raise project costs or delay adoption in regulated applications.
Key Report Takeaways
- By robot type, service robots held 52.32% of the Robotics market share in 2026, while cobots are projected to expand at an 18.18% CAGR through 2032.
- By component, hardware accounted for 68.97% of the Robotics market share in 2026, while software is projected to expand at a 13.53% CAGR through 2032.
- By geography, Asia-Pacific held 58.60% share of the Robotics market in 2026 and is projected to expand at a 13.67% CAGR through 2032.
Note: Market numbers in this report are based on Mordor Intelligence's proprietary estimation framework, which combines nine months of actuals with Q4 projections for base year 2026.
Market Trends and Insights
Drivers Impact Analysis of Robotics Market*
| Driver | (~) % Impact on CAGR Forecast | Geographic Relevance | Impact Timeline |
|---|---|---|---|
| Rising Labor-Shortage-Led Automation Demand | +3.2% | Global, most acute in North America, Europe, Japan, and South Korea | Long term (≥ 4 years) |
| Declining Average Robot Price per Functional Hour | +2.5% | Global, with early gains in high-wage economies including the United States, Germany, and Japan | Medium term (2-4 years) |
| Warehouse AMR Rollouts by E-Commerce 3PLs | +2.0% | North America and Europe, with expansion into Asia-Pacific and the Middle East | Short term (≤ 2 years) |
| Fiscal Incentives for Reshoring Manufacturing in G-7 | +1.8% | North America and Europe, with early gains in the United States Midwest and Ontario | Short term (≤ 2 years) |
| Proliferation of Low-Code Robot-Programming Platforms | +1.2% | Global, particularly in SME-dense markets in Europe and Southeast Asia | Medium term (2-4 years) |
| Nation-Level Humanoid R&D Missions | +1.0% | Asia-Pacific, particularly China, Japan, and South Korea, with spillover into North America | Long term (≥ 4 years) |
| Source: Mordor Intelligence | |||
Rising Labor-Shortage Led Automation Demand
Labor shortages are affecting manufacturing roles that require repeatable precision and consistent output. The OECD Skills for Jobs Database identifies continuing occupational imbalances across 38 member countries, including shortages in roles that use specialized technical skills.[1] The International Federation of Robotics reported 38,428 industrial robot installations in the United States during 2025, up 12% from the prior year. This pattern supports investment in inspection, assembly, and other tasks where shortages are more acute than overall labor figures suggest. The Robotics market benefits when manufacturers treat automation as a way to maintain throughput instead of simply replacing headcount. This is especially relevant where quality inspection and dexterous assembly depend on precision that remains difficult to staff consistently.
Declining Average Robot Price per Functional Hour
Lower equipment costs are widening the range of facilities that can justify automation projects. Hardware price declines have particular value when a system can operate across several shifts and perform the same task consistently. Continuous food, chemical, and pharmaceutical operations can therefore obtain faster returns than single-shift sites. The Robotics market also benefits when users adopt flexible equipment for changing product runs rather than dedicating a cell to one task. Low-code tools can reduce programming effort, although safety validation and cell design still require skilled support. ABB stated that collaborative robots are moving beyond fixed task execution toward adaptive paths and natural-language-guided training. These capabilities can shorten the effort required to adapt a system when product mixes, work instructions, or operating conditions change.[2]
Fiscal Incentives for Reshoring Manufacturing in G-7
Manufacturing incentives are encouraging capital investment in advanced production equipment. Ontario enhanced its Manufacturing Investment Tax Credit from 10% to 15% in 2025, with eligible corporations able to receive up to CAD 3 million, or USD 2.2 million, annually. OECD research shows that industrial-policy spending through grants and tax incentives has increased in major economies since 2019. Time-bound support can lead manufacturers to choose turnkey cells and certified integrators instead of purchasing equipment in separate phases. This favors vendors that can combine hardware, programming, safety documentation, and installation. The Robotics market is supported when reshoring projects require higher automation intensity to offset higher labor costs. It also rewards suppliers that can deliver an installed, documented production cell within the period required by an incentive program.
Warehouse AMR Rollouts by E-Commerce 3PLs
Third-party logistics providers are using autonomous mobile robots to make warehouse labor costs more predictable. ODW Logistics deployed Zebra Symmetry Fulfillment AMRs in October 2025 and expected a 42% improvement in pick rates.[3] Zebra expanded its fulfillment solution in January 2025 with coordinated AMRs designed to improve throughput while reducing the required robot count by up to 30%. These deployments support a service model that can lower the initial capital requirement for mid-sized warehouses. The Robotics market is gaining a broader customer base as logistics operators pay for deployment and operation through recurring contracts. This approach also increases demand for fleet management, integration, maintenance, and support services. It allows operators to align automation costs with warehouse activity while retaining access to specialist operational support.
Restraints Impact Analysis of Robotics Market*
| Restraint | (~) % Impact on CAGR Forecast | Geographic Relevance | Impact Timeline |
|---|---|---|---|
| Persistent SME Integration Skill Gap | -2.0% | Global, most acute in Europe and Southeast Asia | Long term (≥ 4 years) |
| Geopolitical Export Controls on Advanced Servos | -1.5% | North America and Europe, which depend on Asian component supply chains | Medium term (2-4 years) |
| Rare-Earth Magnet Price Volatility | -1.0% | Global, most acute for buyers outside China, including Europe and North America | Medium term (2-4 years) |
| Cybersecurity Vulnerabilities in ROS Deployments | -0.7% | Global, particularly in defense, health care, and logistics deployments | Medium term (2-4 years) |
| Source: Mordor Intelligence | |||
Persistent SME Integration Skill Gap
Integration requirements remain a major barrier for small and medium-sized enterprises. A 2025 Manufacturing Technology Centre study identified 47 competencies needed for successful robot adoption among UK metalworking SMEs. These capabilities span procurement, safety validation, programming, maintenance, and operating procedures. The same study makes clear that buying a robot does not remove the need to design and validate the wider production cell. WorldSkills Europe also describes systems integration as a specialized discipline with technical, safety, and commissioning requirements. The Robotics market may lose potential SME demand when low-code programming does not address the costlier gaps in cell design and safety validation. Small facilities also need clear maintenance procedures and practical support after installation, not only a simpler programming interface.
Geopolitical Export Controls on Advanced Servos
Precision motion systems rely on components such as harmonic drives, cycloidal reducers, and high-resolution servo motors. The United States Section 232 review of robotics and industrial machinery has raised concerns that trade restrictions could increase the cost of imported equipment and parts. Suppliers and integrators may face margin pressure if fixed-price contracts cannot absorb higher component costs. Rare-earth magnet volatility adds a related exposure for servo systems and actuator manufacturers. These pressures can delay automation purchases even where labor shortages favor investment. The Robotics market needs more resilient supply arrangements if users are to maintain predictable project budgets. Long lead times and changes in component availability can be difficult for integrators that have committed to fixed implementation schedules.
*Our forecasts treat driver/restraint impacts as directional, not additive. The impact forecasts reflect baseline growth, mix effects, and variable interactions.
Robotics Market Segment Analysis
By Robot Type:
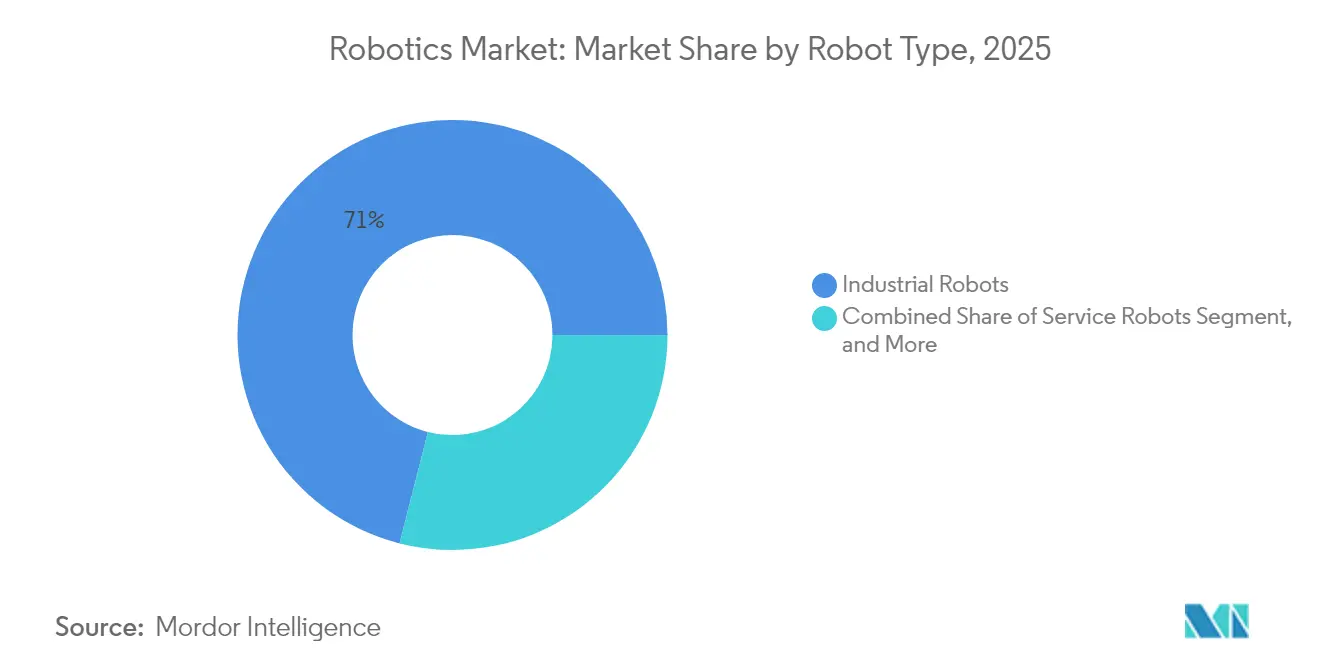
Service Platforms Lead While Cobots Reshape Factory FloorsService robots accounted for 52.32% of the Robotics market size in 2026, supported by uses in logistics, medical care, agriculture, inspection, and security. These applications extend demand beyond traditional factory environments. Industrial robots remain essential for high-throughput precision operations. Global industrial robot installations reached 603,307 units in 2025, an 11% increase from the previous year. Electronics and automotive each installed more than 138,000 industrial robots during the year. This installed base supports continuing demand for controllers, safety systems, integration, and aftermarket services.
Cobots are projected to expand at an 18.18% CAGR through 2032, the highest rate among robot types in the Robotics industry. Their appeal comes from flexible deployment in shared workspaces and smaller production cells. ABB describes collaborative robots that can learn autonomously, adjust paths, and use natural-language-guided training. Safety rules for AI-enabled behavior in human-robot workspaces remain important procurement considerations. Autonomous mobile manipulator robots combine a cobot arm with a mobile platform, allowing users to automate linked production and intralogistics steps. This category makes the distinction between mobile and stationary systems less clear. The Robotics market can gain from this overlap because customers can automate more of a workflow with one coordinated system.



By Component:
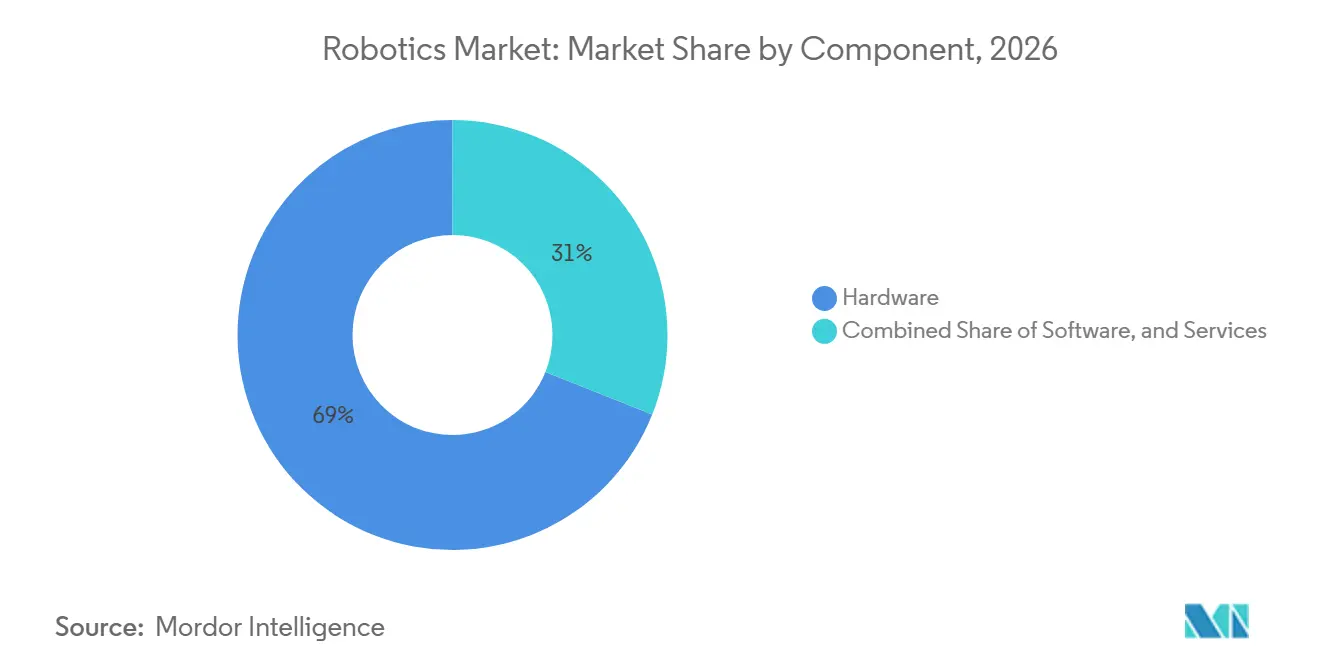
Hardware Anchors Revenue While Software Gains ImportanceHardware held 68.97% of the Robotics market size in 2026, reflecting the cost of robot bodies, actuators, controllers, and sensors. Precision joints and reducers remain central to performance and equipment cost. Hardware vendors also face exposure to supply availability for advanced motion components and magnet-based servo systems. Industrial users still require durable equipment that can meet cycle-time, payload, and safety needs. This keeps physical systems at the center of capital spending in the Robotics industry. The global operational stock reached 5 million industrial robots in 2025, showing the scale of equipment already in service. The installed base creates demand for replacement parts, field support, and controller upgrades.
Software is projected to expand at a 13.53% CAGR through 2032 as fleet management, digital twins, simulation, and AI inference gain wider use. In March 2026, NVIDIA announced that ABB, FANUC, KUKA, and YASKAWA were integrating Omniverse libraries and Isaac technologies into their robotics work. Virtual commissioning allows manufacturers to test layouts and robot behavior before deployment. Software can also create recurring revenue through subscriptions and support contracts. These capabilities make programming and simulation part of the commercial value of a robot system. Services are expanding alongside software as users seek integration and robots-as-a-service arrangements. The Robotics market is shifting toward a wider mix of equipment revenue and recurring operational revenue.

Geography Analysis
Asia-Pacific
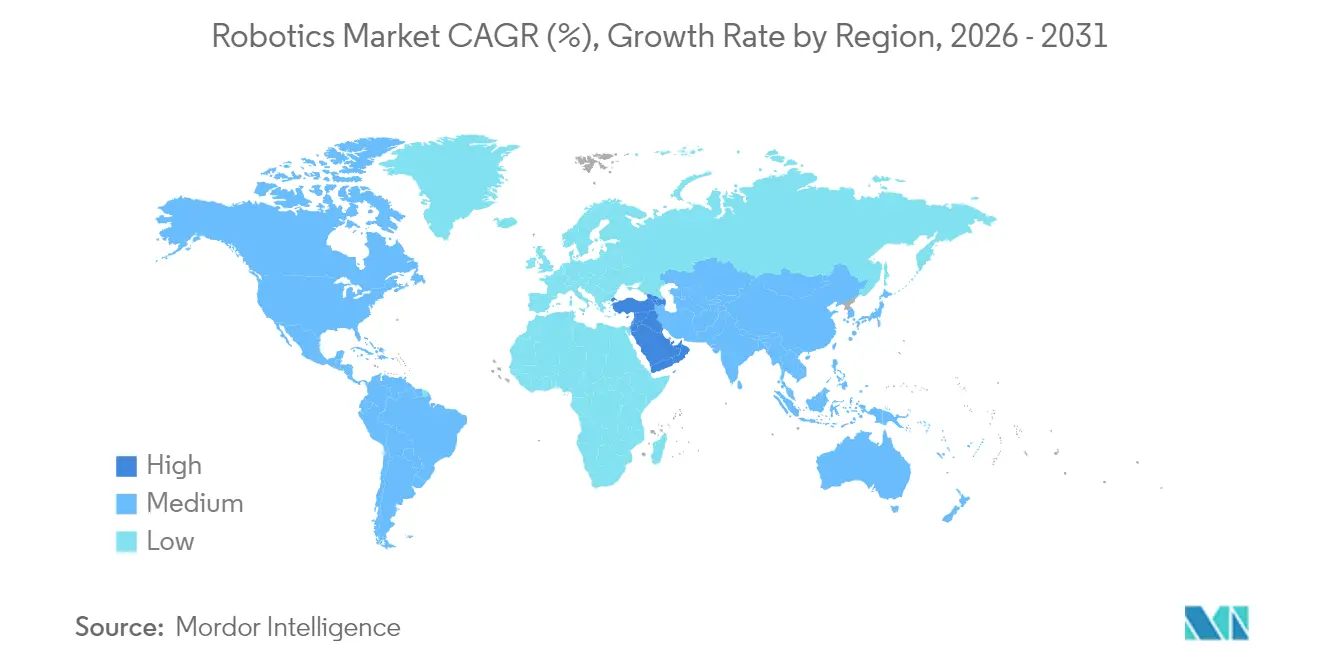
Asia-Pacific held 58.60% of regional revenue in 2026 and is projected to expand at a 13.67% CAGR through 2032. China accounted for 59% of global industrial robot deployments in 2025, installing 354,226 units, up 20% from the previous year. Domestic Chinese brands represented 55% of installations in China, indicating stronger local participation in the country’s automation base. India installed 10,500 robots in 2025, a 15% increase, and recorded a 27% installation CAGR from 2020 to 2025. India’s robot density of 67 units per 10,000 manufacturing workers remained below the global average. Japan’s installations declined 19% to 36,219 units during 2025, while South Korea recorded near-flat activity at 30,000 units. China is also developing standards for humanoid robots, which may support common expectations for product development and use.
North America
The United States installed 38,428 industrial robots in 2025, up 12%, which was the third-highest annual total in the IFR series. Automotive represented more than one-third of United States installations, while food-industry installations increased 30% in 2025. Reshoring and labor shortages are increasing the automation intensity needed at facilities returning from lower-wage regions. The Robotics market in North America also benefits from logistics deployments that favor mobile robots and fleet software. Canada recorded a 5-6% installation increase in 2025, supported by investment conditions that include the Ontario Manufacturing Investment Tax Credit. Mexico declined for a third consecutive year as trade-policy uncertainty weighed on automotive and electronics investment. Robots-as-a-service models can make adoption more accessible to mid-market manufacturers by spreading costs through monthly payments. This financing structure supports demand for integration and maintenance services as well as equipment.
Europe, South America, the Middle East, and Africa
Europe installed 73,054 industrial robots in 2025, a 14% decline, as automotive softness, energy costs, and economic uncertainty constrained capital spending. Germany installed fewer than 25,000 units after an 8% decline, although its 2020-2025 installation CAGR of 2% retained its importance in precision and automotive-related work. Brazil’s installations increased 38% to 4,300 units in 2025, with automotive installations rising 212% as Chinese automakers invested in the country. Argentina and other South American markets recorded more modest gains amid macroeconomic pressure. In the Middle East, Boston Dynamics and Abu Dhabi-based Analog announced an alliance in 2026 to deploy Spot robots for urban-infrastructure inspection and preventive maintenance. This deployment points to demand that is tied to infrastructure programs rather than factory production. Africa remains an early-stage market, with South Africa as its principal industrial-robot center and interest emerging in agricultural and construction applications. Different economic conditions across these areas require vendors to adapt finance, integration, and service models.
Mordor Intelligence provides coverage of the robotics market across other key regional markets. Detailed country-level analysis extends to Indonesia incorporating local coverage and market participation, as required.
Regulatory Framework and Outlook
The comparison reviews selected jurisdictions from the perspective of employers selecting and operating industrial robot cells. Manufacturer conformity requirements affect employers' equipment choices, while workplace safeguarding duties concern how they operate the resulting cells. EU states must not impede availability of products placed on the market in compliance with Directive 2006/42/EC before January 20, 2027, with Chapter VI replacing Directive Article 11 from July 19, 2023, including existing procedures. The United Arab Emirates column addresses Abu Dhabi employers under its machine-guarding code.
Regulatory Table of Robotics Market
| Decision factor | United States | Germany | China | Brazil | United Arab Emirates | South Africa |
|---|---|---|---|---|---|---|
| Primary authority | Occupational Safety and Health Administration | Federal-state market-surveillance authorities, coordinated by ZLS | State Administration for Market Regulation and national standards authorities | Ministry of Labor and Employment | Abu Dhabi Public Health Centre and sector regulatory authorities | Department of Employment and Labour, Inspection and Enforcement Services |
| Key instruments or direction | 29 CFR 1910.212 machine guarding | Directive 2006/42/EC; Regulation (EU) 2023/1230 applies January 20, 2027 | Mandatory GB 11291.1-2011; replacement being drafted | NR-12 machinery safety and robot-system conformity | Abu Dhabi Machine Guarding Code of Practice, Version 4.1, effective February 27, 2026 | General Machinery Regulations, 1988, for machinery not classified under other regulations |
| Commercial effect | Employers must guard operators and nearby workers from machine hazards | Manufacturer conformity work for 2027 equipment; protected availability for qualifying legacy products | Industrial robot products must meet the mandatory safety standard | Conformity route through ABNT ISO 10218-1, ABNT ISO 10218-2, ISO/TS 15066 and other applicable standards, with international standards used in their absence or omission | Machinery-hazard management duties fall to Abu Dhabi employers | Employers/users safeguard dangerous exposed parts within normal reach unless an inspector grants written permission to omit safeguarding |
| Current policy attractiveness | Medium | Medium | Medium | High | Medium | Medium |
| Future direction of policy attractiveness | No change | No change | No change | No change | No change | No change |
| Source: Mordor Intelligence | ||||||
The United States' guarding duties support Medium attractiveness, while Brazil's recognized standards route supports High attractiveness for employers selecting equipment and its 2026 agenda's absence of an NR-12 topic supports continuity. Germany's Medium attractiveness and No change direction reflect employers' continued access to qualifying Directive-compliant products placed on the market before January 20, 2027, through the manufacturer conformity transition. China's equivalent judgments retain its mandatory standard as the equipment benchmark during replacement drafting, while South Africa's retain applicable safeguarding and written inspector exemptions alongside the replacement proposal whose consultation ended November 22, 2025. Abu Dhabi's effective February 2026 framework supports Medium attractiveness and continuity through established guarding duties, making prevention of access or hazardous movement an operating responsibility that equipment selection alone cannot discharge.
Value Chain Stages
The value chain compares supplier earnings from motion components, complete robots, application integration and supported robot access. A company can participate at more than one stage, as Yaskawa's robot and motion-control offerings illustrate. This overlap gives equipment producers a route to capture component value, while leaving application engineering as a separate commercial role. The central distinction is between supplying a machine and delivering a usable production or warehouse system.
Value Chain Analysis Table of Robotics Market
| Primary activity | Key participants | Value capture | Bottleneck | Resilience response |
|---|---|---|---|---|
| Motion-component supply | Servo and motion-control suppliers such as Yaskawa | Component sales | Qualification for the target robot platform | Qualify component choices before expanding production |
| Robot production | Robot manufacturers such as Fanuc Corporation and Yaskawa Electric Corporation | Robot equipment sales | Matching payload, reach and application requirements | Configure platform families around defined task requirements |
| Application integration | System integrators such as JOT Automation | Application-engineering and integration fees | Combining the robot with the customer's production process | Validate the complete cell before replication |
| Fleet access and operating support | Warehouse RaaS providers such as Locus Robotics | Annual subscriptions and new-site setup fees | Sustaining the bundled software, service and support obligation | Align fleet expansion with deployment and support capacity |
| Source: Mordor Intelligence | ||||
Locus Robotics bundles robots, software, service and support in its warehouse subscription, billed annually per bot in advance, with a one-time setup fee for each new site. That structure brings deployment services and continuing support into the provider's revenue relationship with the customer. Integration specialists retain a separate opening where the production task requires engineering beyond standard robot access. Recurring contracts consequently make the capacity to support installed systems part of the supplier's commercial scalability.
Competitive Landscape
Market Concentration
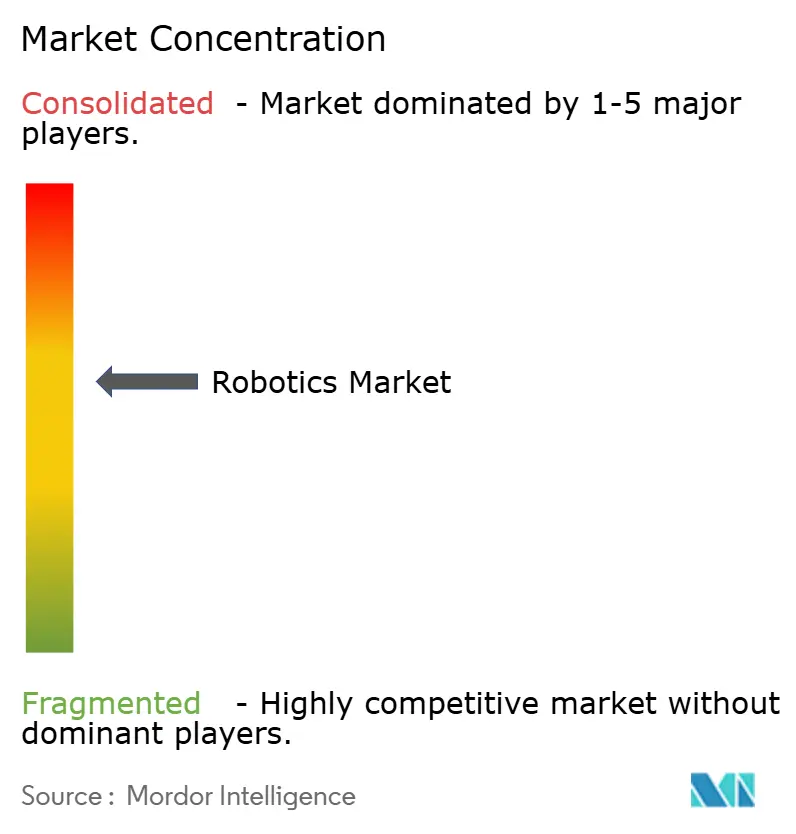
ABB, FANUC, Yaskawa, and KUKA have the largest industrial installed bases, and their combined fleet exceeds 2 million units globally. The Robotics market is moderately consolidated in industrial equipment but has more varied competition in cobots, software, and humanoid systems. Established OEMs are adding controller-level AI inference, simulation, and software tools to retain users beyond a hardware replacement cycle. In March 2026, NVIDIA announced that ABB, FANUC, KUKA, and YASKAWA were integrating Omniverse libraries and Isaac technologies for digital-twin and physical-AI applications. This collaboration shows that virtual commissioning has become a strategic part of system design. Vendors are also seeking recurring revenue from robots-as-a-service partnerships, software, and support.
Software-focused entrants are challenging proprietary controller and programming models. AGIBOT launched Genie Studio Agent in 2026 as a zero-code platform for robot workflow orchestration using drag-and-drop components. These tools can reduce the advantage held by vendors that rely on closed controller languages. Cybersecurity has become a further factor in competitive selection for deployments in health care, defense, and logistics. INCIBE-CERT identified critical vulnerabilities in the Ghost Robotics Vision 60 system in 2025, including a CVSS score of 9.2 where default authentication was absent.The Navigation2 project also disclosed a critical heap out-of-bounds vulnerability triggered through an unauthenticated network packet.
IEC 61508 functional-safety practices and ISO 10218-1 robot-safety requirements are increasingly relevant to procurement in regulated uses. Documented safety cases across hardware and software can favor providers with strong systems-integration capabilities. FANUC introduced its M-1000/550F-46A in September 2025 for heavy-duty applications, with a 550 kg payload and 4.6 m reach. FANUC also introduced the M-800/60-20B in June 2025 for cutting, welding, milling, and drilling applications. Medical robotics and SME-focused deployment tools remain areas where new providers can compete with established OEMs. The market concentration score is moderate as the leading 4 industrial OEMs have a combined installed fleet above 2 million units, while meaningful competition remains across specialized segments.
Robotics Industry Leaders
-
ABB Ltd.
-
FANUC Corporation
-
Yaskawa Electric Corporation
-
KUKA AG
-
DENSO Corporation
- *Disclaimer: Major Players sorted in no particular order
Robotics Market Companies Covered in this Report
- ABB Ltd.
- FANUC Corporation
- Yaskawa Electric Corporation
- KUKA AG
- Kawasaki Heavy Industries, Ltd.
- Universal Robots A/S (Teradyne, Inc.)
- DENSO Corporation
- Mitsubishi Electric Corporation
- OMRON Corporation
- Stäubli International AG
- Epson Robots (Seiko Epson Corporation)
- Comau SpA (One Equity Partners LLC)
- Nachi-Fujikoshi Corp.
- Toshiba Corporation
- Intuitive Surgical, Inc.
- Stryker Corporation
- iRobot Corporation
- Boston Dynamics, Inc.
- Locus Robotics Corp.
- DJI Technology Co., Ltd.
Key Opportunities for Market Participants
The comparison separates hospital transport installation, construction-site inspection and industrial robotics integration funding, with providers respectively delivering equipment, packaging a service or developing an integration framework. The funded integration framework must advance from Technology Readiness Level 4 to 7 and be validated in at least 3 real-world industrial pilots. Horizon Europe participation is limited to entities established in EU member states, Iceland, Norway or eligible associated countries, with additional-country eligibility confirmed at application and association effective by grant signature. Noneligible-country control requires guarantees positively assessed by the applicant's country of establishment, which entities controlled by China or a China-based legal entity cannot submit.
Market Opportunities Table of Robotics Market
| Opportunity | Why now | Buyer / lead segment | Recommended play | Main barrier | Likely beneficiaries |
|---|---|---|---|---|---|
| Hospital AGV/AMR supply and installation | Alexandra Hospital redevelopment procurement pending award | Singapore Ministry of Health hospital project | Align robot supply with the nominated subcontract's installation responsibilities | Bid window has closed | Participating AMR suppliers and installation contractors |
| Packaged construction-site inspection | Open service tender closes November 27, 2026 | Jurong Town Corporation | Offer one packaged AMR inspection service | Delivering a complete inspection proposition | Inspection-service integrators and Boston Dynamics, independently operated within Hyundai Motor Group's portfolio |
| Industrial robotics integration frameworks | Grant topic scheduled to open November 17, 2026, with proposals due March 18, 2027 | Eligible industrial firms and robotics integration teams | Develop modular, interoperable integration frameworks | Coordinating industrial validation across multiple sites | Eligible robot integrators and manufacturing partners |
| Source: Mordor Intelligence | |||||
The strongest service opening is a complete inspection proposition for Jurong Town Corporation (JTC), combining the robot with inspection delivery. Its open service tender seeks one packaged AMR inspection solution for building construction sites, with submissions due November 27, 2026. Delivering a complete inspection proposition is the main barrier, which favors service integrators able to assemble it and gives robot manufacturers a partner channel into the service contract.
Recent Industry Developments in Robotics Market
- October 2026: FANUC and Hitachi announced a strategic partnership combining AI and industrial robotics for autonomous manufacturing operations. The alliance links FANUC's motion-control expertise with Hitachi's enterprise IT and industrial IoT capabilities, targeting integrated factory-intelligence solutions for automotive and electronics customers.
- September 2026: FANUC Europe introduced the next-generation R-2000/E industrial robot series, designed to reduce maintenance requirements and lower total cost of ownership for high-duty-cycle applications. The launch directly addresses cost-per-cycle pressures from customers evaluating AMR and humanoid alternatives for material handling.
- August 2026: FANUC launched the M-810 series machining robot, combining high stiffness and advanced accuracy control to enable robotic milling, drilling, and deburring of large metal components, reducing manufacturer dependence on expensive CNC machine tools.
- March 2026: NVIDIA announced integrations with ABB Robotics, FANUC, KUKA, and YASKAWA for NVIDIA Omniverse and Isaac simulation frameworks, enabling digital-twin-based virtual commissioning across a combined installed base of more than 2 million industrial robots. NVIDIA simultaneously released GR00T N1.7 with commercial licensing for generalized robot intelligence.
Robotics Market Report Scope and Research Methodology
Market Definition and Coverage
The Robotics market measures annual revenue from industrial and service robot platforms sold or deployed globally for work across commercial, industrial, institutional, defense, and consumer settings. It counts robot platform hardware, robot-specific software, integration fees, and robot-as-a-service revenue.
Scope exclusions: Standalone sensors sold separately, generic software licenses unrelated to robot platforms, and non-robot industrial machinery sold outside a robot system sale are excluded.
Segments Covered in This Report
- By Robot Type
- Industrial Robots
- By Application
- Manufacturing (Welding and Soldering) and Assembly and Dispensing
- Painting and Coating
- Machine Tending and CNC
- Other Applications (Material Handling, Packaging, Quality Inspection, among Others)
- By End User Industry
- Automotive
- Electronics, Electrical and Semiconductor
- Food and Beverage
- Pharmaceutical and Healthcare
- Military and Defense
- Other End User Industries (Machinery, Metal, Rubber, etc.)
- By Application
- Service Robots
- By Application
- Logistics and Warehousing
- Agriculture and Field Services
- Medical and Surgical
- Defense and Security
- Inspection and Maintenance
- Cleaning and Sanitation
- Construction and Demolition
- Other Applications (Retail, Hospitality, Customer Interaction, Education and Research, Entertainment, and Leisure)
- By Application
- Collaborative Robots (Cobots)
- By Application
- Manufacturing (Welding and Soldering) and Assembly and Dispensing
- Painting and Coating
- Machine Tending and CNC
- Other Applications (Material Handling, Packaging, Quality Inspection, among Others)
- By End User Industry
- Automotive
- Electronics, Electrical and Semiconductor
- Food and Beverage
- Pharmaceutical and Healthcare
- Military and Defense
- Other End User Industries (Machinery, Metal, Rubber, etc.)
- By Application
- Mobile/AMR
- By Application
- Logistics and Warehousing
- Agriculture and Field Services
- Medical and Surgical
- Defense and Security
- Inspection and Maintenance
- Cleaning and Sanitation
- Construction and Demolition
- Other Applications (Retail, Hospitality, Customer Interaction, Education and Research, Entertainment, and Leisure)
- By Application
- Industrial Robots
- By Component
- Hardware
- Software
- Services (Integration, RaaS)
- By Geography
- North America
- United States
- Canada
- Mexico
- Europe
- Germany
- United Kingdom
- France
- Rest of Europe
- Asia-Pacific
- China
- India
- Japan
- Rest of Asia-Pacific
- South America
- Brazil
- Argentina
- Rest of South America
- Middle East
- United Arab Emirates
- Saudi Arabia
- Rest of Middle East
- Africa
- South Africa
- Nigeria
- Rest of Africa
- North America
Data Sources, Market Sizing, and Validation
Desk Research
Public evidence such as the International Federation of Robotics' World Robotics industrial and service series tracks installations, supplier activity, service robot sales, and robot-as-a-service fleets. The European Commission Joint Research Centre's robotics market-share study explains how industrial and service robot classifications and production and adoption evidence can be reconciled, while Eurostat enterprise indicators and the US Census Bureau's Annual Survey of Manufactures add adoption, purchases, installed equipment, and capital spending context.
Company 10-Ks, annual reports, investor materials, public tenders, and reputable press coverage can cross-check supplier revenue, product pricing, installed fleets, investment plans, and deployment timing. Those records help relate public shipment and adoption signals to the revenue categories in the market definition. The named sources are not exhaustive, and further sources inform collection, validation, and clarification.
Primary Interviews and Surveys
Primary research would draw on structured interviews with robot manufacturers, software and robot-as-a-service providers, system integrators, distributors, and deploying users in manufacturing, logistics, healthcare, defense, and other service settings. Respondents would test secondary evidence on what is counted in bundled system prices, separately invoiced software or integration, deployment volumes, and realized pricing, then identify gaps by segment or geography. When accounts conflict, the analyst would revisit the source definition and seek corroboration from an independent supplier, channel, or end-user signal before carrying the input into the model.
Distribution of primary research fieldwork respondents
| Company type | Respondent position | Region |
|---|---|---|
| Top tier: 25% | CXOs: 20% | APAC: 40% |
| Mid tier: 55% | Functional/Unit leaders: 35% | EMEA: 32% |
| Smaller Players: 20% | Managers: 45% | Americas: 28% |
Market-Sizing & Forecasting
The analyst builds a global revenue estimate from the top down, using the approved market boundary and then checking selected parts against supplier and channel evidence. The model relates industrial robot installations, professional and medical service robot sales, robot-as-a-service fleet growth, average platform prices, and capital spending in factories, warehouses, hospitals, and other deployment settings to the revenue pool. Supplier filings and product disclosures help distinguish platform value from software, integration, and recurring service charges, while shipment and adoption evidence supports the shares for robot type, component, application, end-user industry, and geography.
For 2027-2032, scenario analysis links installation and fleet expansion to prices, service mix, and end-market investment, with primary respondents checking whether each driver is plausible for their part of the value chain. Where a separate value is needed for an unreported segment or country, the analyst uses the nearest relevant adoption, supplier, or industry indicator and records a bounded input until direct evidence is available. Selective bottom-up checks, such as supplier roll-ups and sampled average selling price multiplied by unit volume, test the global total and selected regional estimates. Missing supplier or channel data is handled through documented ranges and overlap checks, especially for hardware bundled with software or service fees.
Data Validation & Update Cycle
Analysts triangulate the estimate against independent supplier revenue, robot shipments, service fleets, end-user adoption, and regional investment signals, then investigate breaks in trend, unusual share movements, and differences between reported and modeled values. When a variance could reflect a changed definition, a bundled charge, or a timing shift, the analyst checks the underlying disclosure and re-contacts the relevant respondent if clarification would change the estimate. A second analyst reviews source coverage, calculations, and segment totals before sign-off, followed by an annual refresh, an interim update after material market events, and a fresh pre-delivery review.
Mordor Intelligence's Robotics Market Estimate Compared With Other Published Estimates
Published estimates can differ in the transactions and products they count and the inputs used to model demand. The Robotics market measures annual revenue from industrial and service robot platforms sold or deployed globally for work across commercial, industrial, institutional, defense, and consumer settings.
Key Gap Drivers include the study's defined coverage and market-specific modeling choices. Where a separate value is needed for an unreported segment or country, the analyst uses the nearest relevant adoption, supplier, or industry indicator and records a bounded input until direct evidence is available.
Benchmark comparison
| Source | Market Size | Gaps in Research Methodology |
|---|---|---|
| Mordor Intelligence | USD 105.8 B (2027) | |
| Global Consultancy A | USD 131.8 B (2025) | At its 2025 base, this estimate is 24.6% above this report's 2027 value of USD 105.8 B, 2 years later. Its technology framing encompasses computer applications and machine-tool designs as well as robot manufacturing and applications, a wider counted category. |
| Global Consultancy B | USD 59.7 B (2026) | At its 2026 base, this estimate is 43.6% below this report's 2027 value of USD 105.8 B, 1 year later. Its published forecast follows a lower 2026 starting estimate and slower subsequent growth. |
Mordor Intelligence's analysts triangulate the estimate against independent supplier revenue, robot shipments, service fleets, end-user adoption, and regional investment signals, then investigate breaks in trend, unusual share movements, and differences between reported and modeled values.
Key Questions Answered in the Report
What is the current size of the Robotics market?
The Robotics market is projected at USD 106.69 billion in 2026 and USD 119.5 billion in 2027. The Robotics market forecast value is USD 223.28 billion in 2032. Labor shortages, broader service-robot uses, warehouse automation, and software-led system design are central to the outlook.
What CAGR is projected for robotics through 2032?
The Robotics market is projected to register a 13.32% CAGR from 2027 to 2032. The forecast reflects continued demand for automation in manufacturing and logistics, together with a growing role for integration, simulation, and recurring software services.
Which robot type holds the largest revenue share?
Service robots held 52.32% of revenue in 2026. Their use spans logistics, medical care, agriculture, inspection, and security, which broadens demand beyond conventional factory automation. Cobots are projected to record the fastest expansion at an 18.18% CAGR through 2032.
Which robotics component is expanding fastest?
Software is projected to expand at a 13.53% CAGR through 2032. Digital twins, simulation, fleet management, and AI inference support this outlook because they help users test systems, manage deployed equipment, and create recurring service relationships.
Which region leads global robot demand?
Asia-Pacific held 58.60% of revenue in 2026 and is projected to expand at a 13.67% CAGR through 2032. Chinas large installation base and Indias lower robot density relative to the global average create different forms of regional demand.
What is holding back broader robotics adoption?
Integration skills, component trade restrictions, rare-earth supply exposure, and cybersecurity risks can increase deployment cost and complexity. Small and medium-sized enterprises are particularly affected when programming tools do not resolve cell design, validation, maintenance, and safety requirements.