
Robotic Waste Sorting System Market Size and Share
Market Overview
| Study Period | 2021 - 2031 |
|---|---|
| Market Size (2026) | USD 3.36 Billion |
| Market Size (2031) | USD 7.78 Billion |
| Growth Rate (2026 - 2031) | 18.27 % |
| Fastest Growing Market | Asia Pacific |
| Largest Market | North America |
| Market Concentration | Medium |
Major Players *Disclaimer: Major Players sorted in no particular order Image © Mordor Intelligence. Reuse requires attribution under CC BY 4.0. | |
Robotic Waste Sorting System Market Analysis by Mordor Intelligence
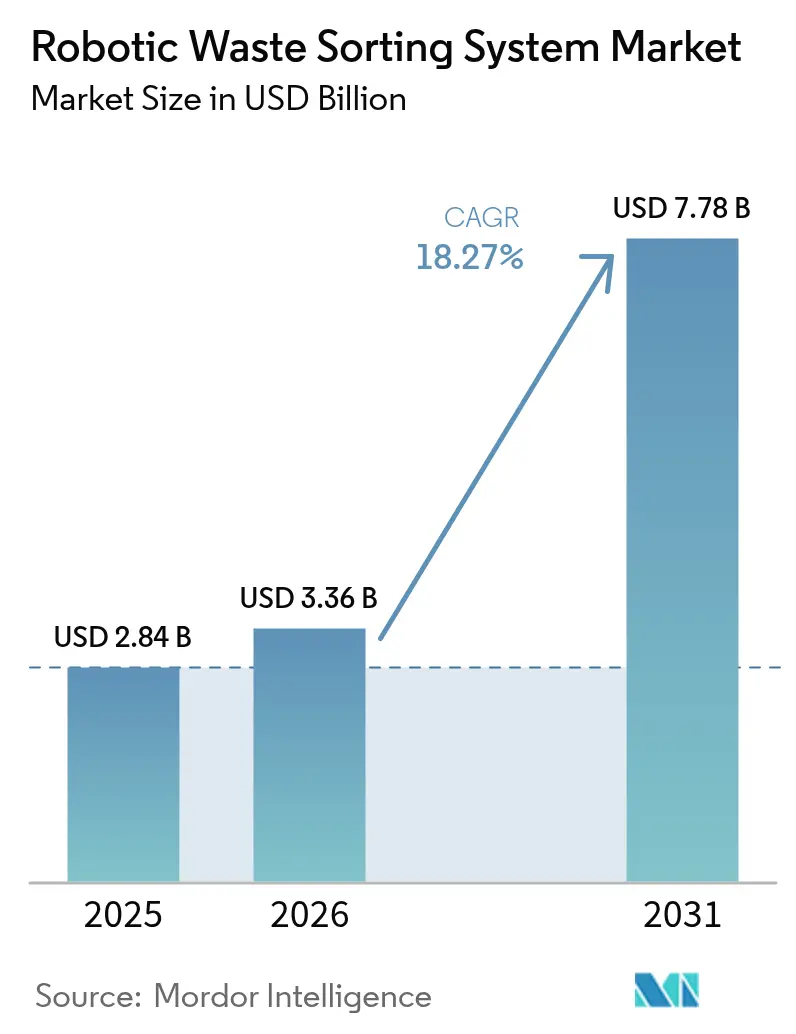
The robotic waste sorting system market size is expected to grow from USD 2.84 billion in 2025 to USD 3.36 billion in 2026 and is forecast to reach USD 7.78 billion by 2031 at 18.27% CAGR over 2026-2031. Growth momentum in the robotic waste sorting system market is driven by tightening landfill-diversion rules, producer responsibility mandates, and sustained investment in artificial-intelligence hardware.[1] Automated sorting has become a strategic response to labor scarcity at Material Recovery Facilities (MRFs) and to China’s restrictions on low-grade imports, both of which have raised the value of high-purity recyclables. Rapid improvements in multi-sensor fusion now allow robots to recognize more than 500 waste categories with 99% accuracy, lifting recovery rates and lowering residual disposal fees. Service-based leasing is gaining traction, easing capital constraints, while cybersecurity spending is rising as interconnected fleets expose facilities to industrial control threats. As a result, the robotic waste sorting system market continues to shift from pilot projects to core infrastructure investment strategies across advanced economies.
Key Report Takeaways
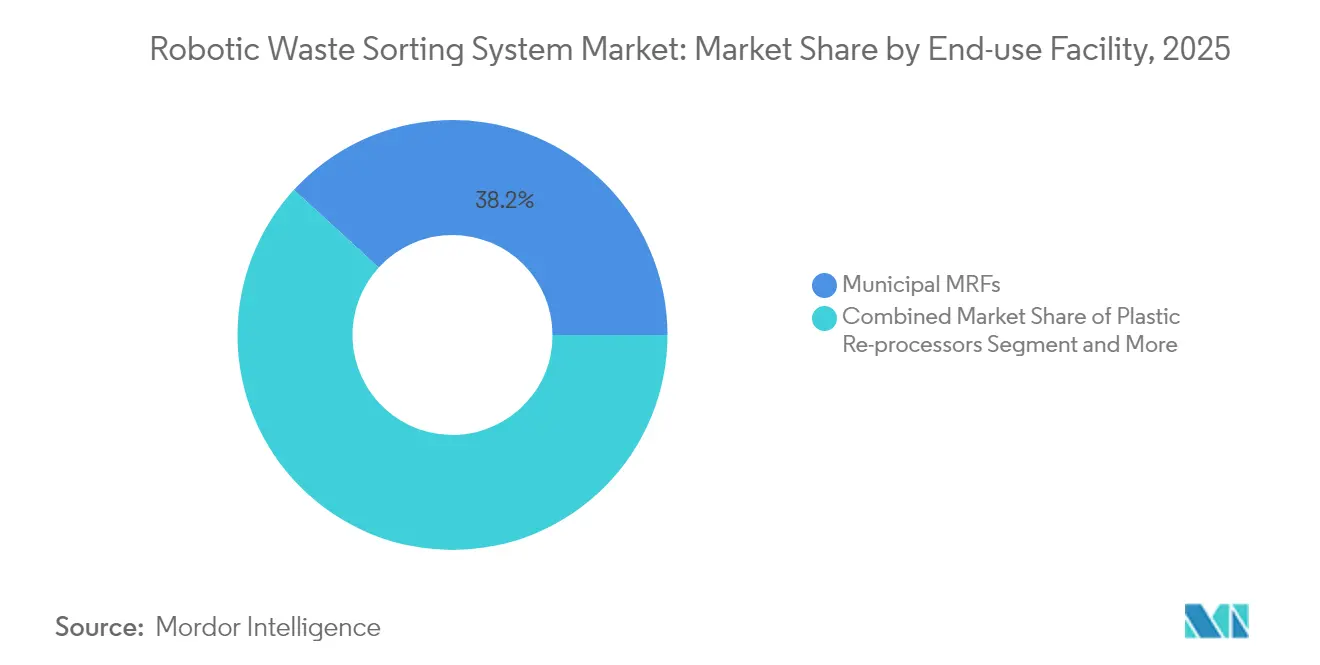
- By end-use facility, Municipal MRFs led with 38.20% of the robotic waste sorting system market share in 2025, while Plastic Re-processors are forecast to expand at a 20.35% CAGR through 2031.
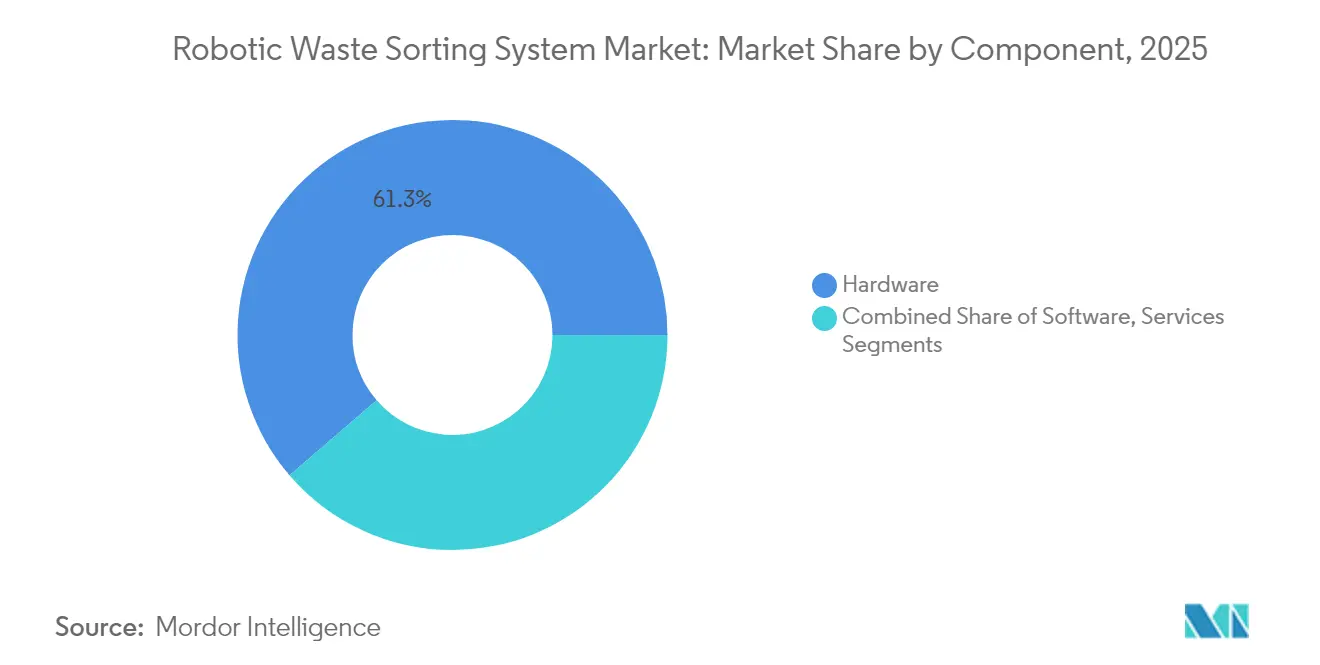
- By component, hardware accounted for 61.30% of the robotic waste sorting system market size in 2025; software is growing at 20.18% CAGR as AI capabilities scale.
- By sorting technology, NIR / hyperspectral optical systems held a 43.40% share of the robotic waste sorting system market size in 2025, whereas AI vision-only solutions are poised for a 19.47% CAGR to 2031.
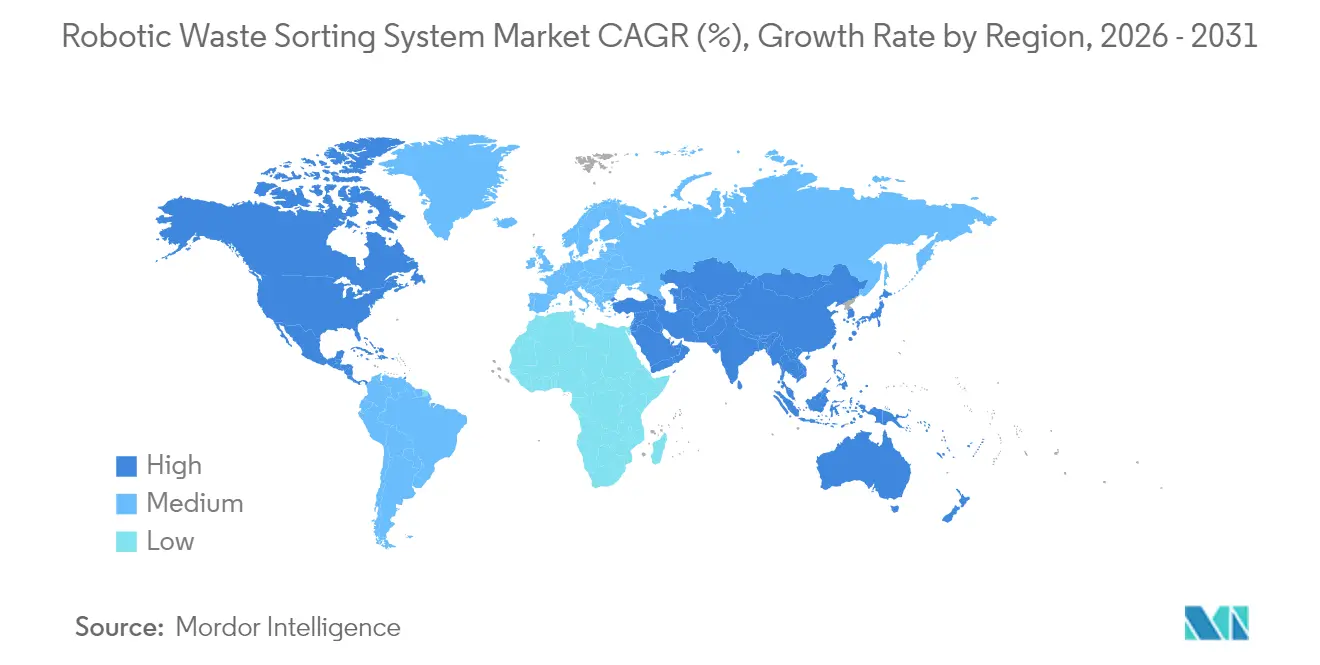
- By geography, North America represented 32.70% of global revenue in 2025, but Asia-Pacific is the fastest-growing region at an 18.15% CAGR to 2031.
Note: Market size and forecast figures in this report are generated using Mordor Intelligence’s proprietary estimation framework, updated with the latest available data and insights as of 2026.
Market Trends and Insights
Drivers Impact Analysis of Robotic Waste Sorting System Market*
| Driver | ( ~ ) % Impact on CAGR Forecast | Geographic Relevance | Impact Timeline |
|---|---|---|---|
| Stricter landfill-diversion and EPR regulations | +4.2% | EU, Asia-Pacific | Medium term (2–4 years) |
| Ban on low-grade waste imports | +3.8% | Global, spillover to Southeast Asia | Short term (≤ 2 years) |
| Labor shortages and rising MRF operating costs | +3.1% | North America, EU | Short term (≤ 2 years) |
| Surge in recycled-content packaging mandates | +2.9% | EU, Global brands | Medium term (2–4 years) |
| Demand for AI-enabled closed-loop data | +2.2% | North America, APAC tech hubs | Long term (≥ 4 years) |
| OEM service-based leasing models | +1.8% | Developed markets | Medium term (2–4 years) |
| Source: Mordor Intelligence | |||
Stricter Landfill Diversion and EPR Regulations
Extended Producer Responsibility rules shift cost burdens from municipalities to brand owners, and the EU’s 2024 packaging measure requires all packaging to be recyclable and to hit specific recycled-content thresholds by 2030 and 2040, accelerating automation adoption. [2] Municipalities and producers now deploy robots to secure higher material purity and avoid EPR penalties. The OECD notes that variable EPR fees reward companies that design recyclable products, which further sharpens demand for precision sortation. Facilities deploying robotic systems report recovery-rate jumps of 20 percentage points within 12 months of commissioning. These returns strengthen the robotic waste sorting system market as new regional mandates replicate the EU model.
Ban on Low-Grade Waste Imports by China and Others
China’s National Sword policy requires sub-0.5% contamination, forcing Western MRFs to upgrade equipment to regain export revenue. Robots provide the accuracy needed to meet the new quality bar, and payback periods have fallen to under 24 months in high-volume plants. Similar bans in Malaysia, Thailand, and Vietnam magnify the driver. Consequently, the robotic waste sorting system market has realigned toward domestic capacity investment, with North American operators adding AI sorters at mixed-plastic lines to recapture commodity margins lost after 2018.
Labor Shortages and Rising MRF Operating Costs
Turnover rates above 100% led managers to automate the most hazardous jobs. Human sorters average 40 picks per minute, whereas robots achieve 80 picks with 99% uptime, doubling throughput and reducing overtime costs. Decision-makers see a direct link between automation and operating-cost avoidance, which underpins capital budgeting for new installations and reinforces expansion of the robotic waste sorting system market.
Surge in Recycled-Content Packaging Mandates
Consumer-goods groups have pledged to use 25–50% recycled plastic by 2030, creating premiums for food-grade pellets. Robots fitted with hyperspectral sensors detect polymer types with 99% accuracy, enabling facilities to supply these premium streams at higher margins. Plastic re-processors therefore record the highest forward orderbooks for automated lines, sustaining double-digit growth in the robotic waste sorting system market.
Restraints Impact Analysis of Robotic Waste Sorting System Market*
| Restraint | ( ~ ) % Impact on CAGR Forecast | Geographic Relevance | Impact Timeline |
|---|---|---|---|
| High capex and payback uncertainty | -2.8% | Emerging markets | Short term (≤ 2 years) |
| Cyber-security exposure of IIoT robots | -1.9% | Global critical infrastructure | Medium term (2–4 years) |
| Source: Mordor Intelligence | |||
High Capex and Payback Uncertainty
Complete robotic lines cost USD 2–5 million, equal to 8–12 months of revenue for a 100,000-tonne MRF. Commodity-price swings elongate payback, delaying investment in emerging markets. Leasing and Robotics-as-a-Service (RaaS) are mitigating this restraint by shifting spending from capex to opex, yet access to dollar-denominated leases remains limited outside developed economies. The robotic waste sorting system industry therefore advances unevenly across regions with different capital-access profiles.
Cyber-Security Exposure of IIoT Robots
Cloud-connected robots widen the attack surface for critical waste infrastructure. Recent studies highlight gaps in user-friendly end-point protections, prompting operators to integrate ISA/IEC 62443 standards and layered network segmentation. [3] Budget allocations for cyber-hardening now form part of total-cost-of-ownership models, adding 3–5 percentage points to lifecycle cost and tempering rollout speed within the robotic waste sorting system market.
*Our forecasts treat driver/restraint impacts as directional, not additive. The impact forecasts reflect baseline growth, mix effects, and variable interactions.
Robotic Waste Sorting System Market Segment Analysis
By End-use Facility:
Municipal MRFs Anchor DemandMunicipal MRFs managed 38.20% of the robotic waste sorting system market in 2025, reflecting the largest installed base and the highest mix-waste volumes. As these plants target contamination thresholds below 1%, managers install AI robots on residual lines to boost purity and reduce landfill levies. The robotic waste sorting system market size for Municipal MRFs is projected to grow at a steady 14.62% CAGR through 2031, supported by state-level funding programs in the United States and provincial grants in Canada.
Plastic Re-processors, while smaller in absolute terms, are accelerating at 20.35% CAGR. The segment captures demand from consumer-packaged-goods brands pursuing closed-loop strategies. Robots specialize in polymer separation, extracting color-sorted PET and HDPE that command price premiums of up to 30% over mixed-bale equivalents. As a result, Plastic Re-processors are expected to hold a 23.10% robotic waste sorting system market share by 2031, narrowing the gap with Municipal MRFs.

By Waste Type Sorted:
Plastics Dominate ComplexityPlastics accounted for 38.60% of revenue in 2025 and continue to exhibit the fastest uptake. AI systems now identify multilayer films and colored PET with near-laboratory precision. In value-chain terms, each percentage-point reduction in plastic bale contamination lifts resale prices by USD 25 per tonne, supporting investment cases. Paper and cardboard remain a stable category as optical scanners adjust for ink and residue. Metals enjoy robust capture using eddy currents, yet robots add value by isolating high-grade aluminum alloys. Glass sorting gains from AI color-detection models that lift recovery from 70% to 85% in Scandinavian plants.
The robotic waste sorting system market size for plastics alone is projected to exceed USD 3.01 billion by 2031, equal to 38.60% of global value. Robots’ ability to sort complex resins positions the segment for sustained double-digit expansion.
By Component:
Software Captures Value PoolsHardware still represented 61.30% of revenue in 2025; however, software is the value-creation engine. Fourth-generation recognition platforms like ZenBrain now account for 35% of total bill-of-materials in new orders, up from 20% in 2022. Predictive-maintenance algorithms reduce unplanned downtime by 40%, while continuous learning extends system life, mitigating obsolescence risk.
The robotic waste sorting system market sees software revenue growing at 20.18% CAGR to 2031, outpacing hardware expansion. Services, including RaaS contracts, are forecast to reach USD 1.12 billion annual revenue by 2031, reflecting a strategic pivot toward outcome-based pricing.
By Sorting Technology:
AI Vision Challenges HyperspectralNIR / hyperspectral optical platforms held 43.40% share, underpinned by a three-decade performance record in polymer identification. Yet AI vision-only is growing at highest CAGR of 19.47% by 2031, while these solutions gain ground where flexibility trumps chemical specificity. These systems process 200 items per frame and can be retrofitted to legacy conveyors at half the cost of full optical rigs.
Hybrid multi-sensor configurations remain the premium solution for construction or e-waste, but procurement teams increasingly deploy pure vision systems on fiber and rigid-plastic lines, accelerating democratization of the robotic waste sorting system market.
Geography Analysis
North America Robotic Waste Sorting System Market
North America accounted for 32.70% of global revenue in 2025, with early robot adopters scaling fleets to offset labor churn and to hit recycling-rate mandates in California, Oregon, and Colorado. Waste Management alone invested USD 1.4 billion in AI-enabled facilities between 2024 and early 2025. The region hosts over 400 AMP Robotics units, and robotic waste sorting system market size in the United States is projected to exceed USD 2.34 billion by 2031.
APAC Robotic Waste Sorting System Market
Asia-Pacific is the fastest-growing region at 18.15% CAGR. China’s domestic policy pivot from importer to recycler triggered a surge in capacity adds, including ZenRobotics construction-waste lines in Shanghai. Japan’s municipal plants deploy AI glass sorters that lift recovery rates for amber and flint cullet, supporting the country’s bottle-to-bottle targets. South Korea’s ATron robots demonstrate 99.3% precision and showcase export potential across ASEAN. Consequently, Asia-Pacific’s share of the robotic waste sorting system market is forecast to rise from 27.40% in 2025 to 33.20% in 2031.
Europe Robotic Waste Sorting System Market
Europe benefits from mature EPR regulations that fund capital investment. Denmark’s autonomous construction-waste plant achieves 98% purity for recycled aggregates, setting new circular-economy benchmarks. Spain’s first AI sorting initiative under Urbaser signals wider Iberian adoption. Although growth is steadier than in Asia-Pacific, the region remains a technology test bed, sustaining a high concentration of pilot projects and patents that inform global standards for the robotic waste sorting system market.
Regulatory Landscape
Regulation is tightening around both materials circularity and the digital controls used inside waste facilities, shaping procurement of robotic sorting systems. In Europe, Directive (EU) 2025/1892 amends the Waste Framework Directive to reinforce waste prevention and high-quality recycling requirements, while the EU AI Act adds compliance obligations for AI systems used in critical services and industrial contexts. For vendors selling AI-enabled sortation into Europe, governance, documentation, and risk-management requirements become a more explicit part of productization as the Act becomes fully applicable on 2 August 2026.
Digital traceability mandates are also moving from voluntary best practice into enforceable requirements. In the United States, the EPA published a proposed rule on 5 March 2026 (Paper Manifest Sunset) to eliminate paper manifests for hazardous waste and move tracking to the electronic e-Manifest system, pushing facilities to strengthen data capture and integration. In the United Kingdom, the Digital Waste Tracking (England) Regulations 2026 mandate use of an electronic tracking system for controlled waste, increasing the value of robotics platforms that can generate item-level logs aligned to compliance reporting. Separately, US procurement requirements can affect technology sourcing for publicly funded projects, as shown by the EPA issuing a Build America, Buy America nonavailability waiver in May 2026 for Lexington-Fayette Urban County Government covering non-domestic optical and robotic sorters due to lack of compliant domestic alternatives.
Value Chain Analysis
The value chain spans upstream components (robot arms, end effectors, conveyors, and sensing stacks such as NIR/hyperspectral, X-ray, and 3D), midstream AI software and controls (vision models, classification, motion planning, and fleet analytics), and downstream integration and lifecycle services (engineering, commissioning, training, spares, and uptime guarantees). System integrators and OEMs package these into turnkey lines for municipal MRFs, plastics re-processors, metals and WEEE facilities, and C&D sorting plants, with distribution increasingly supported by local partners for installation, safety compliance, and after-sales support.
Recent partnerships show how integration capability and safety features are becoming core value-chain differentiators. In April 2026, Danieli Centro Recycling partnered with Bulk Handling Systems (BHS) to integrate Max-AI autonomous sorting modules into metal and WEEE processing lines, reflecting demand for high-speed robotic handling of heavy or hazardous objects. In the UK and Ireland, Kaizen Recycling was appointed as an official WeSort.AI partner in June 2026 and expanded collaboration in July 2026 to scale AI-based sorting and battery fire-prevention capability, underscoring a shift toward X-ray and hazard-detection modules as recyclers face tighter safety and insurance requirements. Commercial models also evolve along the chain, with Robotics-as-a-Service and per-tonne/per-pick pricing reducing upfront capex friction while increasing the emphasis on software updates, cybersecurity hardening, and guaranteed throughput.
Competitive Landscape
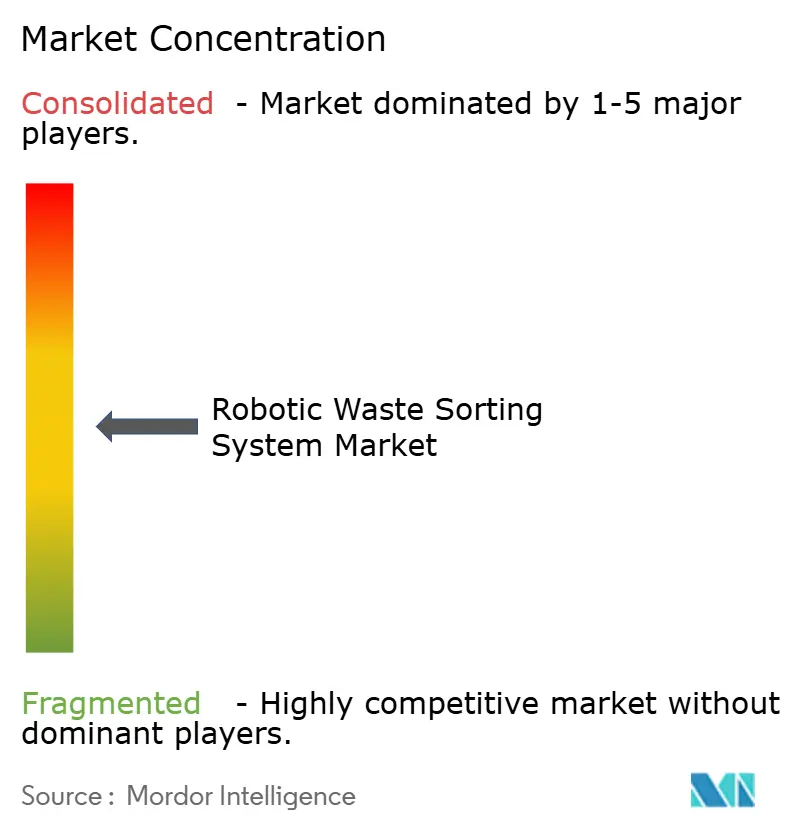
The market is moderately fragmented with top players holding a combined 45% revenue share. AMP Robotics, ZenRobotics (Terex), and TOMRA Systems remain technology leaders, each differentiating by proprietary AI stacks and sensor portfolios. Terex’s 2022 acquisition of ZenRobotics integrated heavy-equipment capabilities with robotic intelligence, enabling cross-selling into metals and demolition segments. TOMRA leverages its installed sensor base to upsell AI modules, while AMP expands its cloud-analytics platform, monetizing performance data for process optimization.
Emerging innovators such as Everest Labs and Greyparrot focus on retrofit vision platforms that lower barriers for mid-tier MRFs. These firms use capital-light business models and RaaS contracts to capture greenfield projects in Latin America and the Middle East. MandA activity is expected to intensify as incumbents seek AI capabilities and regional coverage, driving gradual consolidation within the robotic waste sorting system market. Patent filings around multi-sensor fusion and chemical-composition detection have more than doubled since 2022, underscoring competitive intensity.
Robotic Waste Sorting System Industry Leaders
-
Machinex Industries Inc
-
AMP Robotics Corporation
-
ZenRobotics Ltd
-
Sadako Technologies
-
Bulk Handling Systems (BHS)
- *Disclaimer: Major Players sorted in no particular order
Robotic Waste Sorting System Market Companies Covered in this Report
- AMP Robotics Corporation
- ZenRobotics Ltd
- TOMRA Systems ASA
- Bulk Handling Systems (BHS)
- Machinex Industries Inc
- Waste Robotics Inc
- Sadako Technologies
- General Kinematics
- Pellenc ST
- Green Machine LLC
- STADLER Anlagenbau
- Bollegraaf Group
- Everest Labs
- Glacier AI
- Greyparrot
- JONO Environmental
- FANUC Corp.
- ABB Ltd.
- KUKA AG
- SUEZ Group (AI sorting JV)
- Veolia Environnement (robotic pilots)
Market Opportunities and Future Outlook
A key whitespace is the convergence of robotic pick, optical sorting, and facility-wide AI control into unified platforms that can deliver both purity gains and auditable data for EPR and quality reporting. At IFAT 2026 and PRSE, TOMRA expanded its GAINnext ecosystem with an AI-native platform and new deep learning applications, and it increased its stake in PolyPerception to a majority position, signaling accelerated productization of AI software and analytics as a primary differentiator beyond hardware. This creates opportunity for vendors that can connect robotic classification outputs to plant-wide optimization (line balancing, contamination feedback loops, and predictive maintenance) rather than selling single-station automation.
Deployment activity also points to near-term opportunity in retrofits and niche streams where labor scarcity and safety risks are most acute. Republic Services deployed AI-assisted robot arms from Glacier at a Denver, Colorado facility in 2026 to support waste diversion efforts, while Recycleye installed its QualiBot at SFS in Valencia, Spain, for high-volume quality control, illustrating demand for modular add-ons that upgrade existing lines without full plant redesign. In e-waste, SK tes announced a collaborative AI and robotics initiative with Singapore EDB and Aubotic Technology, aligning automation with higher-value recovery and traceability requirements in regulated streams. Across these use cases, robots that add hazardous-item detection, notably lithium-ion batteries, and produce item-level reporting for compliance and buyer specifications open additional revenue pools in services, software licensing, and performance-based contracts.
Recent Industry Developments in Robotic Waste Sorting System Market
- May 2026: Machinex unveiled the MIND artificial intelligence platform at IFAT Munich 2026, extending AI from individual machines to systemwide optimization across material recovery facilities. The launch also introduced MIND AirPulse, positioning AI-driven controls and real-time decisioning as a lever for higher purity and throughput in mixed-waste lines.
- April 2026: AMP expanded mixed waste processing capacity at its Portsmouth, Virginia facility to 108,000 tons per year under a 20-year partnership with the Southeastern Public Service Authority. The capacity increase strengthens a long-duration operating base for AI-powered sortation and supports larger, more bankable deployments tied to municipal contracts.
- November 2024: AMP entered an agreement with Waste Connections to equip and operate a greenfield recycling facility in Commerce City, Colorado using the AMP ONE system and AMP Smart Sortation. The deal anchored AMP technology into a new-build facility model, accelerating standardized deployments where automation is designed into plant layout from inception.
Robotic Waste Sorting System Market Report Scope and Research Methodology
Market Definition and Coverage
This market covers revenue earned from robotic systems used to identify, pick, and separate solid-waste streams inside sorting and recycling facilities. A system is counted when it combines sensing and vision, AI-based decision software, and robotic picking hardware.
Scope exclusions: Optical sorting machines without robotic pick arms, autonomous waste collection vehicles, and multi-year maintenance-only contracts are excluded.
Segments Covered in This Report
- By End-use Facility
- Municipal MRFs
- Industrial and Commercial Recycling Plants
- Construction and Demolition Facilities
- Plastic Re-processors
- E-waste Recyclers
- By Waste Type Sorted
- Plastics
- Paper and Cardboard
- Metals
- Glass
- Organic and Food Waste
- Mixed CandD Debris
- By Component
- Hardware
- Software
- Services (Installation, OandM, Leasing)
- By Sorting Technology
- AI Vision-only
- NIR / Hyperspectral Optical
- 3-D Laser and X-ray
- Hybrid Multi-Sensor
- By Geography
- North America
- United States
- Canada
- Mexico
- South America
- Brazil
- Argentina
- Chile
- Rest of South America
- Europe
- Germany
- United Kingdom
- France
- Italy
- Spain
- Russia
- Rest of Europe
- APAC
- China
- India
- Japan
- South Korea
- Australia and New Zealand
- ASEAN-6
- Rest of APAC
- Middle East and Africa
- Middle East
- GCC (Saudi Arabia, UAE, Qatar)
- Turkey
- Rest of Middle East
- Africa
- South Africa
- Egypt
- Nigeria
- Rest of Africa
- Middle East
- North America
Data Sources, Market Sizing, and Validation
Desk Research
Desk research was used to build the starting map of demand, operating constraints, and policy signals for robotic sorting in recycling plants. We relied on public materials such as municipal solid waste and recycling statistics from agencies like the US EPA, Eurostat, and the World Bank, plus circular economy references from bodies such as the OECD and the International Solid Waste Association.
To size the addressable installation base, we also reviewed customs and trade statistics for relevant machinery categories, tender notices and project announcements from city and utility procurement portals, and peer-reviewed papers that track MRF performance and contamination rates. Company annual reports, investor decks, and reputable press interviews were used to understand product mix and pricing direction, and paid subscriptions for company financials and patent search were used to cross-check activity and technical focus. These sources are illustrative and not exhaustive, and we used additional public references to clarify, validate, and close data gaps.
Primary Interviews and Surveys
Primary work centered on expert interviews and structured surveys with MRF operators, industrial recyclers, system integrators, and automation and maintenance leaders who manage day to day sorting performance. The fieldwork was balanced across APAC, EMEA, and the Americas, so the deployment pace, utilization patterns, and first-year service attachment used in the model reflect differences in regional policy pressure and labor availability.
Distribution of primary research fieldwork respondents
| Company type | Respondent position | Region |
|---|---|---|
| Top tier: 38% | CXOs: 12% | APAC: 48% |
| Mid tier: 48% | Functional/Unit leaders: 33% | EMEA: 32% |
| Smaller Players: 14% | Managers: 55% | Americas: 20% |
Market-Sizing & Forecasting
Sizing starts with a top-down build that reconstructs the demand pool from facility throughput needs and regulation-driven diversion targets, then applies realistic automation penetration for sorting lines. To keep it grounded, the output is corroborated with selective bottom-up approximations such as sampled system shipment volumes, typical robots-per-line patterns, and average selling price bands discussed with operators and integrators, and totals are adjusted when they drift from practical plant adoption.
Key inputs used in the model include the count and expansion pipeline of MRFs and recycling plants, typical line throughput and operating shifts, contamination levels that trigger upgrades, and capex cycles tied to policy milestones and landfill cost pressure. We also track the split between fixed and mobile deployments, the mix of waste streams commonly targeted first (like plastics and paper), and first-year service attachment, since these factors affect revenue even when unit growth is steady.
Forecasts were built using scenario analysis with a central case, and the scenarios were anchored to variables that can be monitored each year, such as facility investments, procurement activity, and announced capacity additions. Where bottom-up visibility is thinner in smaller geographies, gaps are handled using ratio-based extrapolation from comparable facility density and investment intensity, followed by a sanity check with regional experts.
Data Validation & Update Cycle
Validation is done through several checks that look for internal consistency and alignment with outside signals. We compare modeled deployments and revenue per installed base against indicators such as facility commissioning news, procurement outcomes, and reported recycling performance metrics, and outliers are reviewed before sign-off.
If a policy change, a sharp shift in equipment pricing, or a step-change in facility investment is observed, respondents are re-contacted to confirm what is changing and how quickly it is flowing into orders. Reports are refreshed annually, with interim updates for material events, and before delivery an analyst performs a fresh pass so clients receive the latest updated view.
Mordor Intelligence's Robotic Waste Sorting System Market Estimate Compared With Other Published Estimates
Published market sizes for robotic waste sorting systems can look far apart even when they appear to cover similar applications. The reasons are differences in what equipment is included, how services are treated, and what adoption pace is assumed when installations do not move evenly each year.
The biggest drivers typically show up in three places. Some estimates fold in non-robotic optical sorting equipment into the same total, and others extend revenue to multi-year service and maintenance streams, which increases the number without matching annual unit demand. Currency timing and whether values are kept in constant dollars can also shift the base year, and aggressive assumptions on robots-per-line or faster municipal rollouts can lift near-term values.
Benchmark comparison
| Source | Market Size | Gaps in Research Methodology |
|---|---|---|
| Mordor Intelligence | USD 2.84 B (2025) | |
| Global Consultancy A | USD 3.36 B (2025) | Uses a broader counted pool that can include adjacent sorting equipment and multi-year O&M coverage, which increases reported value beyond newly installed robotic picking systems plus first-year services. |
| Industry Publisher B | USD 1.65 B (2025) | Applies a narrower revenue capture and more conservative uptake rates across facilities, which can understate value in regions where sorting line upgrades are active. |
Procurement awards, facility commissioning updates, and constant-2025-USD normalization are the evidence points that keep Mordor Intelligence tied to newly installed robotic pick systems with embedded software and first-year services, rather than bundling optical-only sorters or longer contract value. When these scope and timing rules are applied consistently, the spread across published values becomes easier to trace back to clear inputs and repeatable checks.
Key Questions Answered in the Report
What is the current size of the robotic waste sorting system market?
The global robotic waste sorting system market size is USD 3.36 billion in 2026 and is forecast to reach USD 7.78 billion by 2031.
Which end-use facility segment leads the market?
Municipal MRFs hold the largest share at 38.20% in 2025 due to urban waste volumes and stringent recycling targets.
Why is Asia-Pacific the fastest-growing region?
China’s domestic recycling build-out, Japan’s precision-sorting initiatives, and South Korea’s AI robot deployments drive an 18.15% CAGR through 2031.
How do Robotics-as-a-Service models affect adoption?
RaaS shifts spending from capital budgets to operating budgets, shortening payback cycles and enabling smaller facilities to adopt automation.
What cybersecurity standards apply to waste-sorting robots?
Operators increasingly adopt ISA/IEC 62443 frameworks to manage cyber-risks associated with cloud-connected industrial robots.