
Robot Software Market Size and Share
Market Overview
| Study Period | 2020 - 2031 |
|---|---|
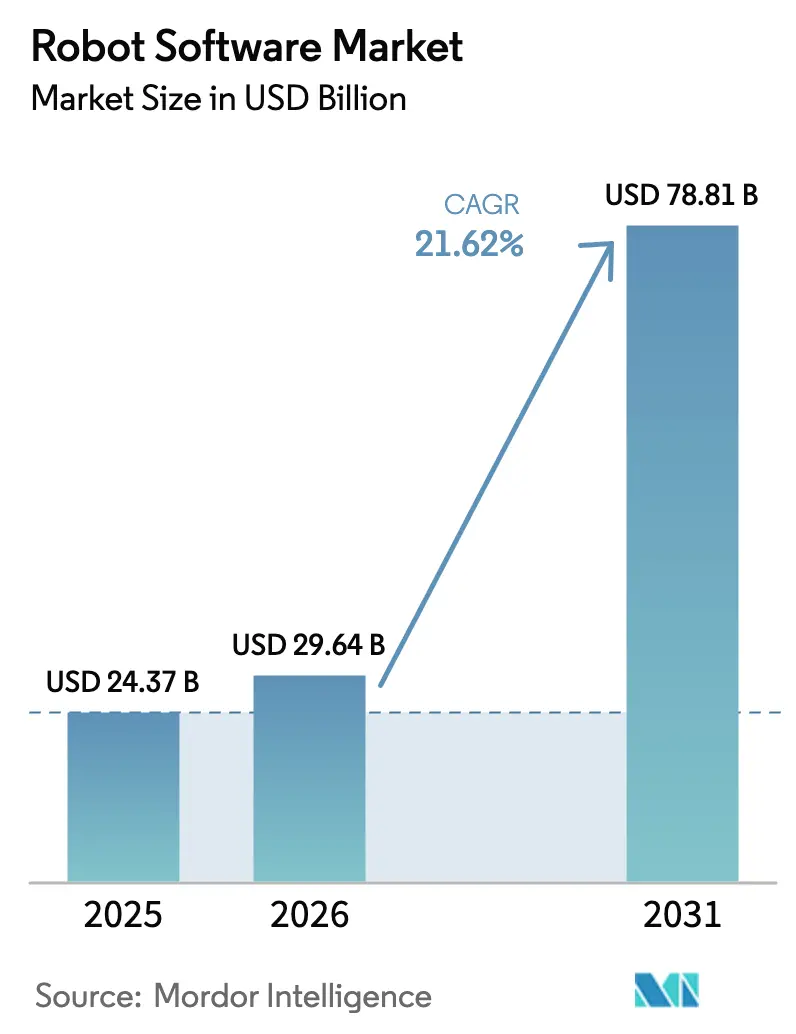
| Market Size (2026) | USD 29.64 Billion |
| Market Size (2031) | USD 78.81 Billion |
| Growth Rate (2026 - 2031) | 21.62% CAGR |
| Fastest Growing Market | Asia Pacific |
| Largest Market | North America |
| Market Concentration | Medium |
Major Players *Disclaimer: Major Players sorted in no particular order Image © Mordor Intelligence. Reuse requires attribution under CC BY 4.0. | |
Robot Software Market Analysis by Mordor Intelligence
The robot software market size is projected to expand from USD 24.37 billion in 2025 to USD 29.64 billion in 2026 and is forecast to reach USD 78.81 billion by 2031, reflecting a 21.62% CAGR, underscoring the momentum behind intelligent automation across factories, hospitals, and warehouses. The transition from proprietary control stacks to open-architecture platforms such as ROS 2 is lowering switching costs, while Robot-as-a-Service contracts convert capital outlays into operating expenses, expanding access for small and medium enterprises. Regulatory tailwinds, notably the European Union Machinery Regulation that mandates virtual safety validation by 2027, are accelerating software demand because compliance now hinges on digital twins and deterministic real-time scheduling. Meanwhile, semiconductor advances exemplified by NVIDIA Jetson Thor are pushing AI inference to the edge, shrinking latency in safety-critical tasks. Venture funding, cloud hyperscaler toolkits, and heightened cybersecurity requirements are collectively reinforcing the value that software adds to physical robots.
Key Report Takeaways
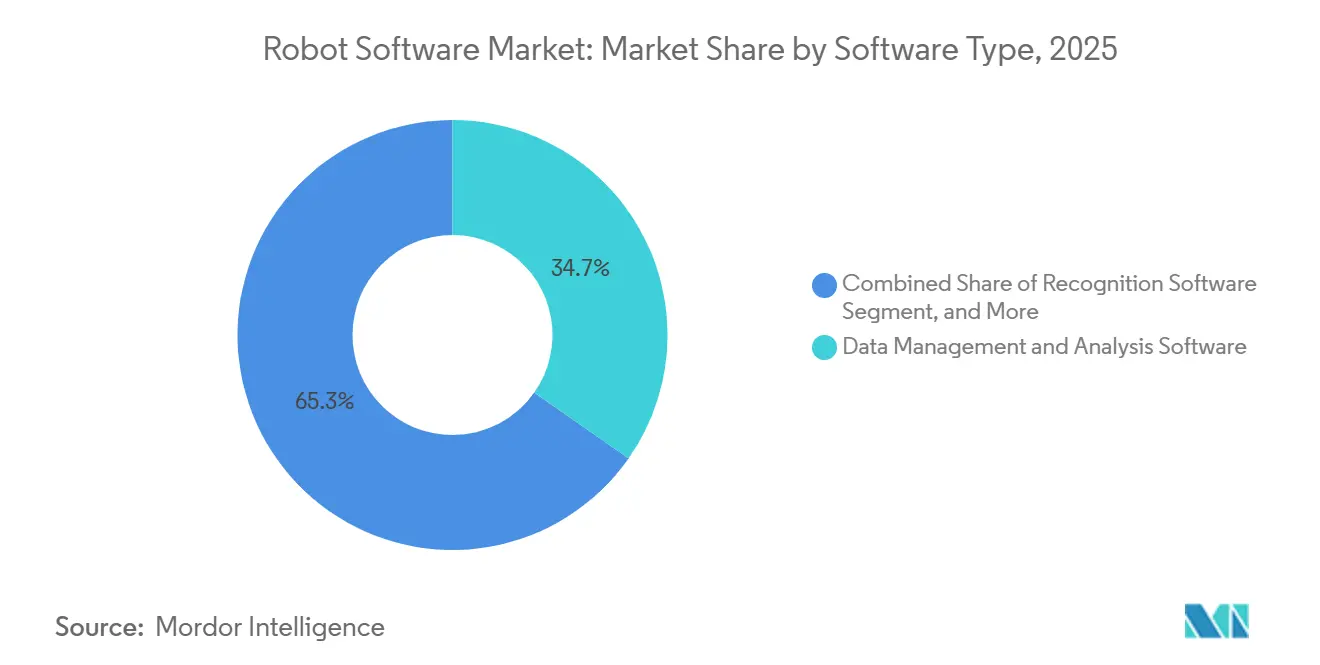
- By software type, data management and analysis led with 34.74% revenue share in 2025, and communication management is projected to expand at a 21.98% CAGR through 2031.
- By robot type, industrial robots accounted for 57.63% of the 2025 base, and service robots are on track for a 23.1% CAGR out to 2031.
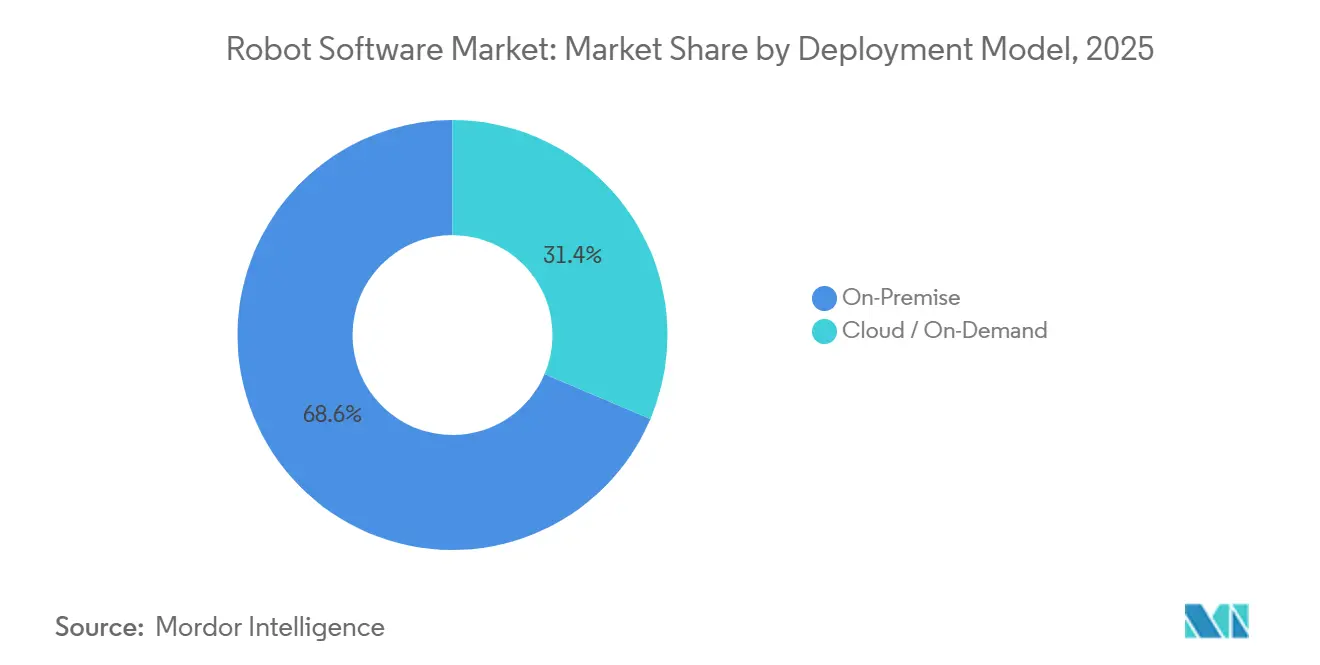
- By deployment model, on-premise installations held 68.62% in 2025, while cloud and on-demand architectures are set to grow at 22.98% through 2031.
- By end-user vertical, manufacturing captured 29.83% in 2025, and healthcare is positioned for a 21.54% CAGR into 2031.
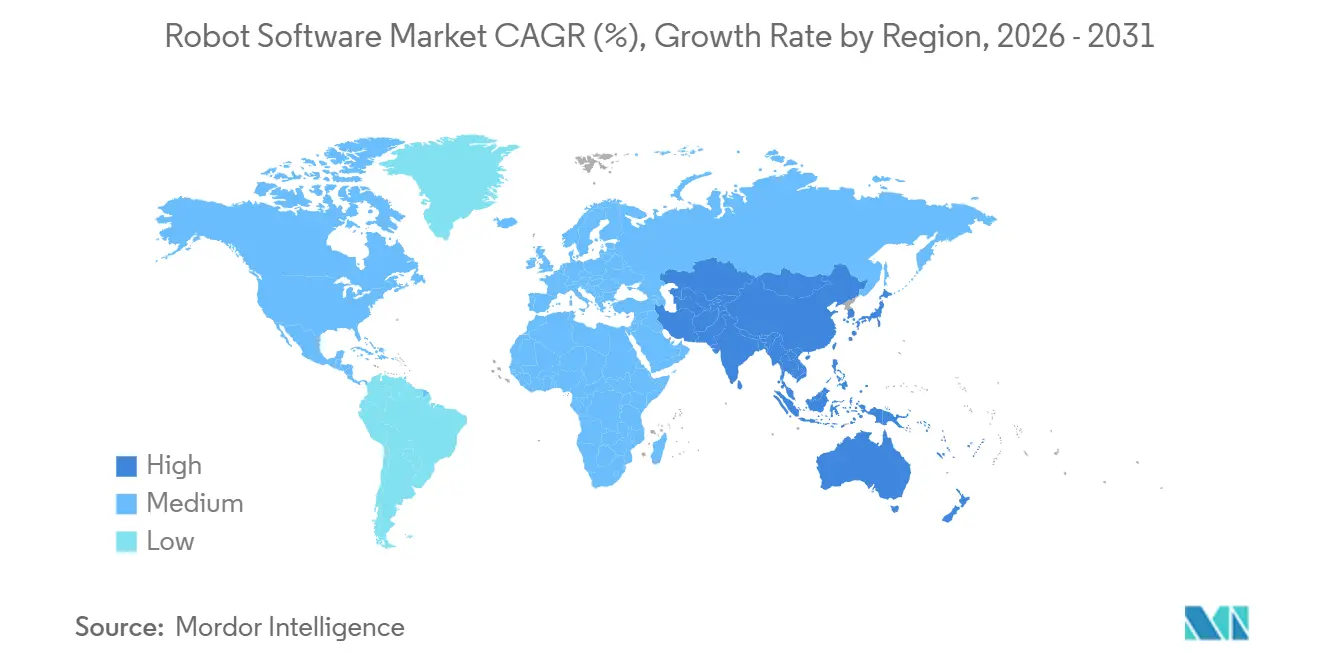
- By geography, North America represented 38.73% revenue in 2025, and Asia-Pacific is forecast to advance at a 22.44% CAGR to 2031.
Note: Market size and forecast figures in this report are generated using Mordor Intelligence’s proprietary estimation framework, updated with the latest available data and insights as of January 2026.
Global Robot Software Market Trends and Insights
Drivers Impact Analysis*
| Driver | (~) % Impact on CAGR Forecast | Geographic Relevance | Impact Timeline |
|---|---|---|---|
| Rising need for automation and safety | +4.2% | Global, with concentration in North America, Europe, and Asia-Pacific manufacturing hubs | Medium term (2-4 years) |
| Rapid SME adoption to cut labor and energy costs | +3.8% | Global, strongest in Asia-Pacific and Europe where labor arbitrage is narrowing | Short term (≤ 2 years) |
| AI and ML integration boosts robot capability | +5.1% | Global, led by North America and China for AI infrastructure investment | Medium term (2-4 years) |
| Low-code and no-code robot-app platforms expand adoption | +3.3% | Global, particularly in SME-dense regions such as Europe and ASEAN | Short term (≤ 2 years) |
| EU safety-driven ROS virtualization mandate (2027) | +2.4% | Europe, with spillover to North America and Asia-Pacific exporters to EU | Medium term (2-4 years) |
| Robot-as-a-Service subscription economics | +4.6% | Global, with early traction in North America and Western Europe | Short term (≤ 2 years) |
| Source: Mordor Intelligence | |||
AI and ML Integration Boosts Robot Capability
Vision language action models now fuse perception and control, allowing robots to follow natural commands and adapt to unseen objects without retraining. The Jetson Thor module provides 2,000 TOPS of on-device compute, enabling humanoid robots to run multimodal models locally and prevent the 100 ms delays that jeopardize surgical precision.[1]NVIDIA Corporation, “NVIDIA Jetson Thor: The Brain for Humanoid Robots,” nvidia.com Intel RealSense SDK added depth-aware segmentation that lets collaborative robots differentiate a human hand from a workpiece, meeting ISO 10218-2 power-and-force thresholds.[2]Intel Corporation, “Intel RealSense SDK 2025 Update: Depth-Aware Object Segmentation,” intel.com Manufacturers benefit because fewer labeled images are required, reducing dataset creation costs. The outcome is faster deployment of flexible cells that can switch product variants within an hour.
Rising Need for Automation and Safety
Aging workforces and low labor participation are structural realities, with Japan reporting a 370,000 manufacturing worker gap in 2025. The updated ISO 10218-1 sets torque and force limits that permit humans and robots to share spaces without cages, thereby increasing software complexity for real-time collision monitoring. UL 3300, the first dedicated safety standard for autonomous mobile robots, mandates redundant braking and lidar-based obstacle detection with a resolution of 0.1 m.[3]UL Solutions, “UL 3300: Standard for Safety of Autonomous Mobile Robots,” ul.com Vendors that embed certified diagnostics and audit logging win share as risk-averse buyers aim to avoid recall costs. Smaller developers lacking compliance budgets are pivoting to platform partners for pre-validated stacks.
Robot-as-a-Service Subscription Economics
Locus Robotics disclosed average monthly fees of USD 3,500 per picking robot in 2025, which now bundle hardware, software, and maintenance. Formic Technologies’ filings show contract terms stretching to 4.2 years, indicating that customers are reluctant to revert once operational. This subscription framing reduces payback anxieties and improves cash flow because payments scale with usage. Vendors update firmware over the air, shortening iteration cycles from quarters to days and ensuring fleets remain security patched. Penetration correlates strongly with reliable broadband, so coverage remains thin in regions where industrial connectivity is sporadic.
EU Safety-Driven ROS Virtualization Mandate (2027)
The EU Machinery Regulation obliges every collaborative robot shipped into the bloc after 2027 to undergo virtual safety validation. ROS 2 adds deterministic scheduling and signed executables, features that simplify auditor sign-off. Gazebo integrated ISO 13849 templates to auto-generate emergency-stop test cases and prove response times below 250 ms. Compliance costs squeeze smaller vendors, prompting acquisitions by larger automation firms that can more easily amortize certification overhead. Exporters to the European market are adopting identical processes, effectively globalizing the mandate.
Restraints Impact Analysis*
| Restraints | (~) % Impact on CAGR Forecast | Geographic Relevance | Impact Timeline |
|---|---|---|---|
| High implementation cost | -3.9% | Global, most acute in price-sensitive SME segments across Asia-Pacific and South America | Short term (≤ 2 years) |
| Cyber-security and malware threats | -2.7% | Global, with elevated risk in North America and Europe due to higher connectivity rates | Medium term (2-4 years) |
| Shortage of safety-certified software engineers | -1.8% | Global, particularly acute in Europe and North America where certification backlogs exceed 18 months | Long term (≥ 4 years) |
| Vendor lock-in from proprietary OS stacks | -1.4% | Global, most pronounced in legacy industrial automation markets with high installed bases | Medium term (2-4 years) |
| Source: Mordor Intelligence | |||
High Implementation Cost
Total ownership often exceeds USD 200,000 per cell once sensors, networks, and integration are counted, which 58% of manufacturers cited as the biggest hurdle in a 2025 survey. Thin-margin SMEs struggle to amortize expenses because they lack scale. Low-code tools shorten programming cycles, yet hardware and sensor bills are largely inelastic. Finance providers demand creditworthy counterparties, limiting leasing uptake in emerging markets. As interest rates trend higher, cash-flow-sensitive firms delay projects unless subsidies or tax credits offset upfront costs.
Cyber-Security and Malware Threats
Dragos recorded a 30% annual rise in malware campaigns targeting robot controllers during 2024, including ransomware that froze 400 mobile robots at a European automotive supplier for 72 hours. The EU Cyber Resilience Act now requires a software bill of materials and 14-day patch windows, yet only a minority of vendors have automated patch pipelines. Runtime anomaly detection from Claroty or Nozomi baselines motion signatures and flags deviations, but adoption lags due to integration effort. Insurance exclusions for unsegmented networks introduce financial risk, prompting buyers to opt for platforms with built-in security analytics.
*Our forecasts treat driver/restraint impacts as directional, not additive. The impact forecasts reflect baseline growth, mix effects, and variable interactions.
Segment Analysis
By Software Type: Data Orchestration Anchors Largest Share
Data management and analysis software held 34.74% of the 2025 base, demonstrating that users value fleet-wide telemetry aggregation for uptime and energy insights. This slice equated to roughly USD 10.3 billion of the robot software market size in 2025. Predictive maintenance algorithms reading vibration and current signatures now forecast bearing failures weeks ahead, letting procurement plan parts without expedite premiums. Standardized interfaces, such as OPC UA, simplify data extraction from mixed fleets, while transformer models detect anomaly patterns that were previously hidden in high-frequency time series. Communication management is expanding at a 21.98% CAGR because heterogeneous fleets dominate logistics centers where AMRs from several makers negotiate right of way in real time. VDA 5050, released in 2024, underpins this surge by defining a common message taxonomy. Recognition software is converging with transformer vision, enabling robots to achieve human-level detection accuracy. Simulation tools incorporate ISO safety templates, which shorten virtual commissioning. Edge inference is now compulsory in uptime-critical factories because cloud round trips breach deterministic budgets.
Product strategies are coalescing into platform bundles that merge orchestration, recognition, and predictive analytics. Vendors price these suites on a per-robot per-month basis, mirroring SaaS norms. Stand-alone point applications risk marginalization unless they integrate via open APIs. As competitive intensity rises, mergers focus on uniting simulation assets with runtime engines to control the full software lifecycle. The robot software market continues to reward products that convert raw sensor logs into actionable dashboards for line supervisors who lack data-science backgrounds.


By Robot Type: Service Robots Outpace Industrial Growth
Industrial robots owned 57.63% of deployments in 2025, equal to around USD 17.1 billion of robot software market size at that time. The share reflects deep entrenchment in automotive welding, painting, and battery pack assembly. Yet service robots are expanding at 23.1% annually, propelled by healthcare logistics, hospitality, and retail scanning. Intuitive Surgical’s da Vinci platform performed more than two million procedures in 2024, validating clinical acceptance of machine assistance. Service robots must navigate unstructured spaces, interpret social cues, and comply with GDPR. Boston Dynamics’ Spot quadruped now runs autonomous inspection in chemical plants via lidar and stereo fusion, highlighting how perception stacks migrate from labs to hazardous field sites.
Industrial units increasingly feature force-torque sensing, enabling safe human collaboration without cages. Modular designs decouple motion libraries from task logic so engineers swap end effectors without rewriting core code. Service platforms integrate cloud-based language models to enable voice commands at hotel counters. Cross-pollination is evident as Universal Robots ports its URScript environment to mobile bases, allowing integrators to blend manipulation and navigation within a single IDE. The robot software market benefits because each added use case translates into incremental license or subscription revenue rather than one-off sales.
By Deployment Model: Cloud Gains Despite On-Premise Dominance
On-premise installations accounted for 68.62% in 2025, as automotive and aerospace manufacturers demand ultra-low latency for 1-kHz control loops. That slice equated to about USD 20.3 billion of the robot software market size. Cloud and on-demand architectures are rising at 22.98% as developers push training, simulation, and fleet analytics to hyperscale data centers. AWS RoboMaker can now simulate 10,000 robot hours in parallel, significantly reducing validation timelines and costs. Microsoft Azure pairs managed Kubernetes with ROS 2 containers to streamline deployment. Logistics and retail favor cloud because centralized coordination boosts routing efficiency across multiple warehouses. Hybrid edge-cloud topologies prevail, with inference at the edge and model updates synchronized overnight. Cybersecurity rules drive cloud adoption since over-the-air patching is simpler when robots remain continuously online, but the expanded attack surface demands zero-trust segmentation.
On-premise solutions remain relevant in high-IP environments where data sovereignty and air-gapping mitigate espionage risks. Edge gateways bridge real-time control to cloud dashboards through encrypted, rate-limited channels. Vendors bundle service level agreements that guarantee latency budgets, further easing buyer concerns. As 5G private networks mature, bandwidth constraints ease, allowing high resolution vision streams to reach cloud AI services in near real time. The robot software market therefore shows a gradual but clear shift toward hybrid and cloud-first deployments.
By End-User Vertical: Healthcare Accelerates Amid Manufacturing Maturity
Manufacturing accounted for 29.83% in 2025, equivalent to USD 8.9 billion of the robot software market, while healthcare is expected to compound at 21.54% through 2031. Automotive maintains leadership in manufacturing because electric vehicle battery assembly requires sub-0.1 mm-tolerance vision-guided guidance. Electronics plants leverage inspection robots to spot micro-cracks before costly rework. Healthcare’s acceleration stems from FDA clearances for AI-guided surgical suites and reimbursement codes that now cover laparoscopic robotics. CMR Surgical’s Versius gained CE marking in 2024 and boasts a modular footprint that reduces capital outlay for hospitals with constrained theater space. Logistics adds momentum as e-commerce warehouses deploy AMRs that cut pick cycle times by 40%.
Retail chains pilot shelf-scanning and floor-cleaning robots powered by BrainOS, capturing real-time inventory data. Aerospace uses crawler robots for fuel tank inspection, thereby lowering human entry risks. Government agencies run perimeter patrol units that integrate thermal cameras and loudspeakers. Each vertical requires domain-specific compliance, from HIPAA in healthcare to ITAR in defense, complicating sales cycles. Vendors that package vertical templates in their SDKs ease adoption and command premium pricing.
Geography Analysis
North America held 38.73% revenue in 2025, buoyed by early automotive and semiconductor adoption plus a deep robotics talent pool anchored by MIT and Carnegie Mellon. The United States supplies the bulk of demand, with Mexico’s nearshoring boom pulling in high-mix automation projects. Canada leverages AI research clusters to commercialize reinforcement learning that optimizes robot policy updates.
Asia-Pacific is the fastest climber with a 22.44% CAGR through 2031, propelled by China’s plan to deploy 1 million humanoid robots by 2030 and India’s subsidies covering up to 25% of capex for factory automation. Japan combats demographic headwinds with service robots in eldercare, while South Korea intersects automotive heritage with Boston Dynamics mobility know-how. ASEAN nations such as Vietnam attract electronics relocations, nudging small batch manufacturers toward cloud orchestration to compensate for labor gaps.
Europe’s trajectory is shaped by safety and cybersecurity regulations that mandate virtual validation and prompt patching, thereby advantaging vendors with compliance expertise. Germany’s automotive and machinery sectors still dominate installations, but Italy’s SME-focused schemes favor low-code cobots. The United Kingdom and France channel public funds into simulation and AI labs that inform next-generation perception stacks. South America remains emergent, with Brazilian car plants piloting collaborative welding cells. The Middle East leans on logistics hubs in the United Arab Emirates that run AMR fleets in ports and free zones. Africa sees early pilots in mining and agro-processing, though bandwidth and capital bottlenecks slow scaling. Across regions, public incentives, broadband coverage, and security regimes shape uptake and vendor entry strategies.

Regulatory Landscape
Robot software procurement is increasingly framed by safety, AI governance, and cybersecurity requirements that push validation, traceability, and patchability into the software stack. In the European Union, Regulation (EU) 2023/1230 (Machinery Regulation) raises compliance emphasis for autonomous machinery, and the report context highlights that collaborative robots shipped into the bloc after 2027 require virtual safety validation, which in turn accelerates demand for digital twins, deterministic scheduling, and test-case automation.
AI governance adds another binding layer for AI-enabled robots. The EU Artificial Intelligence Act (Regulation (EU) 2024/1689) classifies certain AI systems used in robotics as high-risk, increasing obligations around risk management, documentation, and conformity processes that translate into software features such as audit logs, model and dataset traceability, and controlled updates. Outside the EU, the UK Automated Vehicles Act 2024 establishes a framework for licensing and monitoring automated transport systems operating in public spaces, while South Korea maintains the Act on the Development and Supply of Intelligent Robots with safety and quality assurance mechanisms supported by bodies such as KIRIA. In the United States, NIST activity, including an April 2026 update to a Humanoid Robot Baseline Performance Benchmark and related robotics test-method efforts, reinforces standardized performance and safety assessment practices that shape qualification and procurement of robot software across industrial and service use cases.
Value Chain Analysis
The value chain begins with enabling software and tools, including operating systems and middleware, increasingly ROS 2-based, real-time control components, simulation and digital-twin environments, perception and AI frameworks, and cybersecurity modules that support connected fleets. Upstream dependencies also extend into compute and developer tooling, where edge AI modules for on-device inference and simulation ecosystems for virtual commissioning influence time-to-deploy and compliance readiness. Integration and validation are a major value capture point, because heterogeneous fleets rely on interoperability layers, such as OPC UA for industrial data exchange and VDA 5050 for AMR fleet communication, plus safety-certified workflows aligned to standards such as ISO 10218 and UL 3300.
Downstream, industrial robot OEMs, AMR and service-robot vendors, hyperscalers, and systems integrators package software into platform bundles and recurring Robot-as-a-Service contracts, shifting monetization toward per-robot subscriptions that include over-the-air updates and analytics. The main bottleneck is less about robot hardware availability and more about multi-vendor integration across controllers, sensors, networks, and safety environments, which increases the value of pre-validated stacks and partner ecosystems. Recent ecosystem moves illustrate this coupling of software, manufacturing scale, and deployment outcomes, including Robust.AI partnering with Foxconn (Hon Hai) to scale manufacturing for its Carter platform (May 2025) and Aptiv cooperating with Robust.AI (November 2025) to co-develop AI-powered collaborative robots integrating Wind River platforms (VxWorks RTOS and Helix Hypervisor) with a robotics stack, reinforcing the role of real-time software and virtualization in industrial deployments.
Competitive Landscape
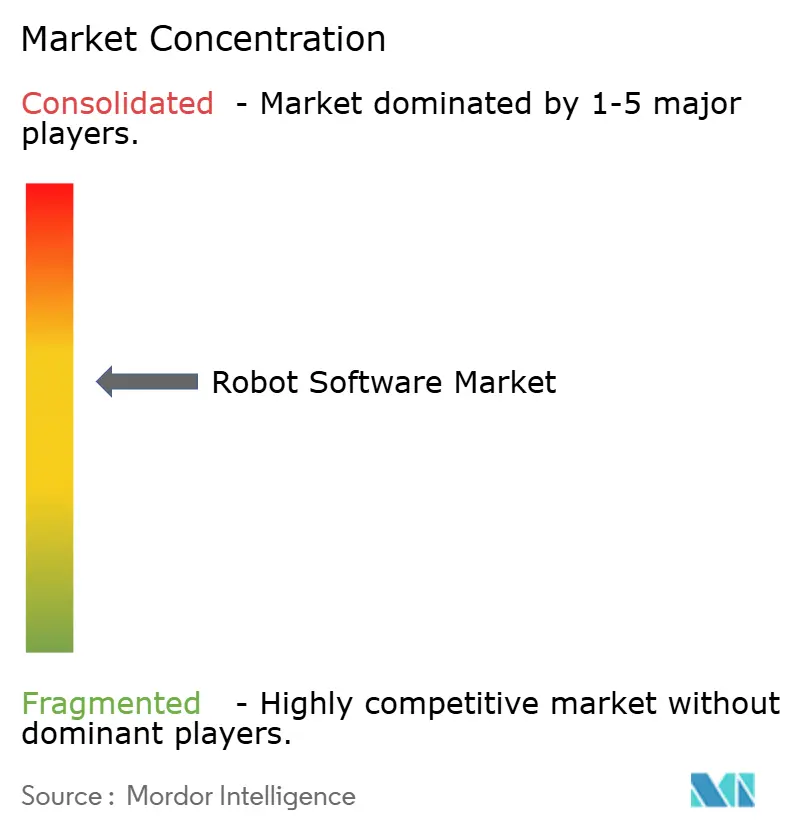
The robot software market is fragmented because simulation experts, vision providers, fleet managers, and cloud hyperscalers each own slivers of the stack, resulting in no firm controlling more than 8% of global revenue. ABB and FANUC extend proprietary controllers with REST and gRPC APIs so customers integrate modern analytics without abandoning installed machinery. Pure-play newcomers such as Clearpath Robotics and Brain Corporation wrap low-code IDEs around ROS 2, enabling technicians to reconfigure workflows without C++ proficiency.
Robot-as-a-Service shifts revenue toward recurring subscriptions, favoring balance-sheet-strong incumbents that can finance hardware. NVIDIA’s multi-agent reinforcement learning patents hint at coordination algorithms for heterogeneous fleets, a potential moat. The scarcity of TÜV-certified software engineers, with 18-month backlog queues, raises entry barriers and tilts share toward firms with in-house compliance teams. Interoperability standards from IEEE and ISO will commoditize basic motion control, pushing differentiation to cognition, perception, and collaborative intelligence. White-space remains in construction, agriculture, and hospitality where software must parse unstructured settings. M&A accelerates as vendors chase end-to-end platform breadth.
Robot Software Industry Leaders
ABB Ltd.
Clearpath Robotics
NVIDIA Corporation
CloudMinds Technology, Inc.
Liquid Robotics, Inc.
- *Disclaimer: Major Players sorted in no particular order

Market Opportunities and Future Outlook
Opportunity is expanding where open-architecture development, simulation-first validation, and recurring service models reduce adoption friction for new user segments and new robot types. The report context already points to the shift from proprietary control stacks toward ROS 2 and to RaaS pricing that broadens access for SMEs, with an in-market reference point from Locus Robotics disclosing average monthly fees of USD 3,500 per picking robot in 2025 that bundle hardware, software, and maintenance. As buyers standardize on hybrid edge-cloud setups, whitespace opens for software vendors that deliver end-to-end lifecycle toolchains, including dataset and telemetry pipelines, digital twins for virtual commissioning and safety validation, fleet orchestration across mixed robots, and embedded security analytics that support faster patching and software-bill-of-materials requirements.
Consolidation and ecosystem alignment around physical AI platforms provide another near-term pathway for software expansion. In February 2026, Alphabet-owned Intrinsic formally joined Google, signaling deeper coupling between robotics software, AI models, and cloud infrastructure that can accelerate developer productivity and deployment scalability. Korea-based telecom and enterprise platforms also show cross-industry adjacency: KT introduced a K RaaS (Robot as a Service) orchestration platform at Mobile World Congress 2026 to link robots with building facilities and legacy IT, and SK Telecom disclosed work on AI-RAN infrastructure with Samsung, Ericsson, and Nokia to support robotic factory operations (July 2026). These moves support opportunities for robot software suppliers that integrate with telecom-grade connectivity, policy management, and orchestration layers, particularly in logistics facilities, smart buildings, and multi-site manufacturing where fleet coordination, security posture, and uptime SLAs are procurement priorities.
Recent Industry Developments
- June 2026: NVIDIA introduced Halos for Robotics, positioned as a full-stack safety system for physical AI. The launch strengthens safety-oriented software layers around perception, planning, and runtime monitoring, supporting vendors that need auditable safety mechanisms as robots become more autonomous.
- October 2025: NVIDIA expanded the Mega NVIDIA Omniverse Blueprint to better support simulation of robot fleets alongside factory digital twin design workflows. This deepens simulation-first development and virtual commissioning, reinforcing demand for robot software that connects digital twins to deployment, monitoring, and continuous optimization.
- October 2024: Clearpath Robotics launched the Husky A300 rugged mobile robot platform with higher speed and payload capability. The release broadens the addressable base for navigation, autonomy, and fleet software in outdoor and industrial environments where payload and durability constraints previously limited software-led deployments.


Research Methodology Framework and Report Scope
Market Definition and Coverage
This market covers revenue generated from software used to program, simulate, orchestrate, monitor, and maintain physical robots across industrial and service settings, including on-premise and cloud delivery.
Scope exclusions: Robot hardware, sensors, actuators, and general IT services that are not directly tied to robot software deployment and operation are excluded.
Segmentation Overview
- By Software Type
- Recognition Software
- Simulation Software
- Predictive Maintenance Software
- Data Management and Analysis Software
- Communication Management Software
- By Robot Type
- Industrial Robots
- Service Robots
- By Deployment Model
- On-Premise
- Cloud / On-Demand
- By End-user Vertical
- Automotive
- Manufacturing
- Healthcare
- Transportation and Logistics
- Retail and E-commerce
- IT and Telecommunications
- Government and Defense
- BFSI
- Aerospace and Defense
- Media and Entertainment
- Other End-user Verticals
- By Geography
- North America
- United States
- Canada
- Mexico
- South America
- Brazil
- Argentina
- Rest of South America
- Europe
- Germany
- United Kingdom
- France
- Italy
- Spain
- Rest of Europe
- Asia-Pacific
- China
- Japan
- India
- South Korea
- ASEAN
- Rest of Asia-Pacific
- Middle East and Africa
- Middle East
- Saudi Arabia
- United Arab Emirates
- Rest of Middle East
- Africa
- South Africa
- Nigeria
- Rest of Africa
- Middle East
- North America
Data Sources, Market Sizing, and Validation
Desk Research
Desk research was used to build the base structure of the market, align terminology, and set realistic ranges for pricing and adoption. We typically start by checking public statistics and standards references that shape robotics software usage, such as IFR publications, ISO documentation, World Bank and OECD industry indicators, and national manufacturing or labor statistics (as signals for automation intensity).
To convert these signals into a working model, we also review company filings and investor presentations, association websites, and peer-reviewed papers on robot simulation and control software, along with trusted press for product releases and deployment patterns. In some cases, a paid subscription for company financials and news intelligence is used to cross-check revenue disclosures and corporate structure, and a patent database is reviewed to understand where development focus is moving. The desk sources mentioned here are illustrative rather than exhaustive, and they were complemented by additional public references used for collection, validation, and research clarification.
Primary Interviews and Surveys
Primary work focused on validating what is actually monetized as robot software, how it is packaged (license, subscription, or usage-based), and how attach rates differ by robot type and end-user environment. We spoke with software suppliers, system integrators, robot OEM channels, and large end users across major regions, which helped close gaps on discounting, deployment mix, and the timing of renewals and upgrades.
Distribution of primary research fieldwork respondents
| Company type | Respondent position | Region |
|---|---|---|
| Top tier: 25% | CXOs: 14% | APAC: 42% |
| Mid tier: 60% | Functional/Unit leaders: 37% | EMEA: 34% |
| Smaller Players: 15% | Managers: 49% | Americas: 24% |
Market-Sizing & Forecasting
Sizing starts with a top-down build where robotics and automation spend is reconstructed into a software demand pool using adoption proxies and software attach rates by robot type and end-user activity. Once the broad total is formed, it is filtered through deployment mix, pricing bands, and the split between new deployments and recurring renewals to arrive at the market value.
To keep estimates grounded, the model relies on a few fingerprints respondents can sanity check, such as installed base growth of industrial and service robots, the share of deployments using simulation or virtual commissioning, cloud and on-demand penetration for robot management layers, typical annual license or subscription pricing, and the cadence of software updates linked to safety, uptime, and productivity needs. Bottom-up approximations are then used as a control, including sampled ASP times volume for common software categories and selective supplier and channel roll-ups where disclosure allows. When direct revenue disclosure is missing, gaps are handled using proxy revenue per deployed robot and ranges for software intensity by use case, then reviewed with interview inputs.
Forecasting is run using scenario analysis supported by short trend lines for key drivers, then adjusted using expert expectations on automation investment cycles. The scenarios mainly shift variables like robot shipments, cloud migration pace, and price progression, and the final forecast reflects the most repeated view from primary feedback.
Data Validation & Update Cycle
Outputs are checked through multiple passes so totals remain tied to real market signals. We compare the modeled value against independent indicators such as robot shipment trends, major end-user automation spending patterns, and shifts in cloud adoption that affect software delivery and renewal timing.
Large variances trigger a deeper review of assumptions, and follow-up calls are done when pricing, deployment mix, or scope interpretation appears inconsistent across sources. Reports are refreshed annually, and interim updates are made when material events occur, such as major policy changes, step-changes in software packaging, or sudden demand swings in key end-user industries. Before delivery, an analyst performs a final review pass so the latest public information is reflected.
Mordor Intelligence's Robot Software Market Sizing Compared With Other Published Estimates
Published market sizes for robot software do not always match because the scope and revenue counting rules can be different, even when the titles look similar. Differences also come from how firms treat recurring subscriptions versus one-time licenses, and how quickly pricing assumptions are refreshed in fast changing software categories.
Implementation and ongoing support services sold alongside robot deployments often inflate totals, and those services sit outside Mordor Intelligence's scope, which keeps the number tied to software licensing and subscription revenue. Another gap driver is the assumed pace of cloud and digital twin adoption, where some estimates apply a single global ramp that is not checked against end-user buying cycles and renewal timing.
Benchmark comparison
| Source | Market Size | Gaps in Research Methodology |
|---|---|---|
| Mordor Intelligence | USD 29.64 B (2026) | |
| Global Consultancy A | USD 35.11 B (2026) | Often broader packaging is counted, where software value can be combined with implementation and support revenues, and pricing is pushed upward using aggressive platform adoption assumptions. |
| Industry Publisher B | USD 24.30 B (2025) | Uses a different base year and may rely on a narrower published dataset for revenue capture, which can undercount cloud subscriptions and renewals that are recognized across multiple years. |
Across the three figures, the main takeaway is that scope and revenue recognition drive most of the difference, more than math errors. By keeping the count tied to clear software line items, using adoption and pricing checks from interviews, and then validating against robot deployment signals, the estimate stays traceable and easier to reproduce when assumptions need to be updated.


Key Questions Answered in the Report
What is the projected value of global robot software revenue by 2031?
Revenue is forecast to reach USD 78.81 billion in 2031, up from USD 29.64 billion in 2026.
Which geographic region is expected to record the fastest growth through 2031?
Asia-Pacific is projected to advance at a 22.44% compound annual rate, the quickest worldwide.
How fast are service robot software deployments growing compared with industrial ones?
Service-focused deployments are expected to expand at 23.1% annually, outpacing industrial growth.
Why are small and medium enterprises turning to Robot-as-a-Service contracts?
Subscription pricing converts large capital outlays into manageable monthly fees that include maintenance and software updates.
What regulation is driving virtual safety validation requirements in Europe after 2027?
The European Union Machinery Regulation mandates that collaborative systems pass virtual safety tests before shipment.
Page last updated on:






