
Road Safety Market Size and Share
Market Overview
| Study Period | 2021 - 2031 |
|---|---|
| Market Size (2026) | USD 5.71 Billion |
| Market Size (2031) | USD 9.66 Billion |
| Growth Rate (2026 - 2031) | 11.09 % |
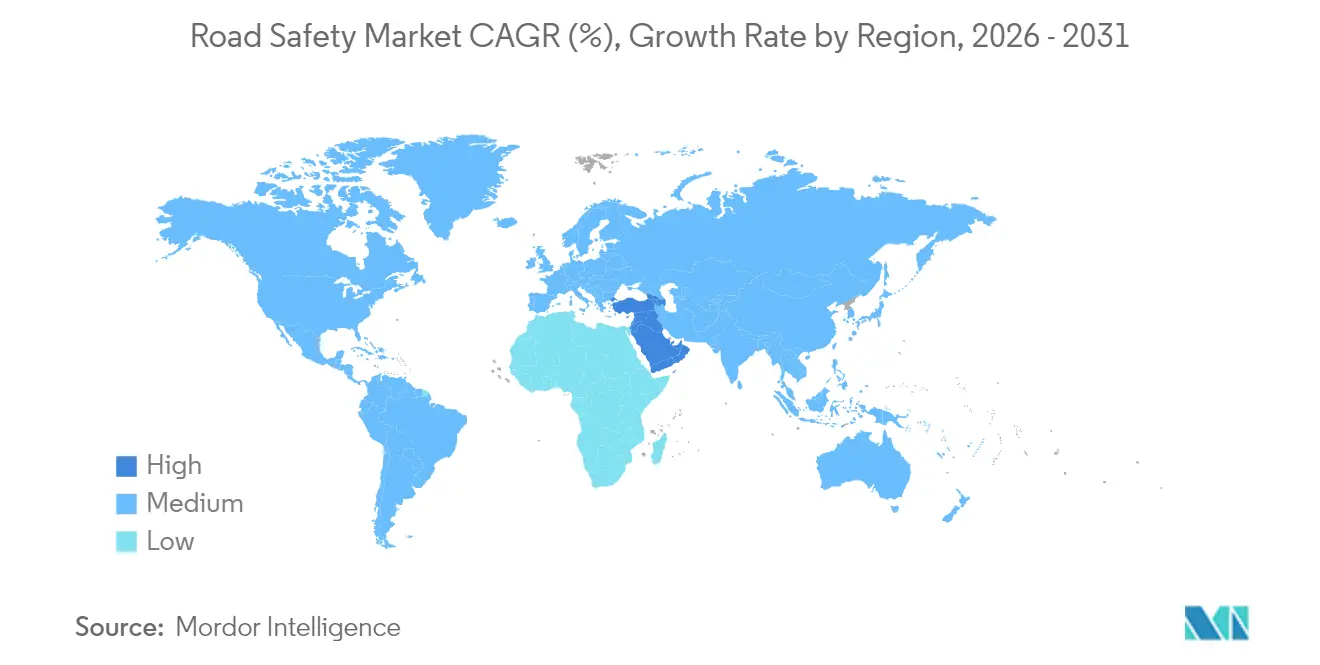
| Fastest Growing Market | Middle East and Africa |
| Largest Market | North America |
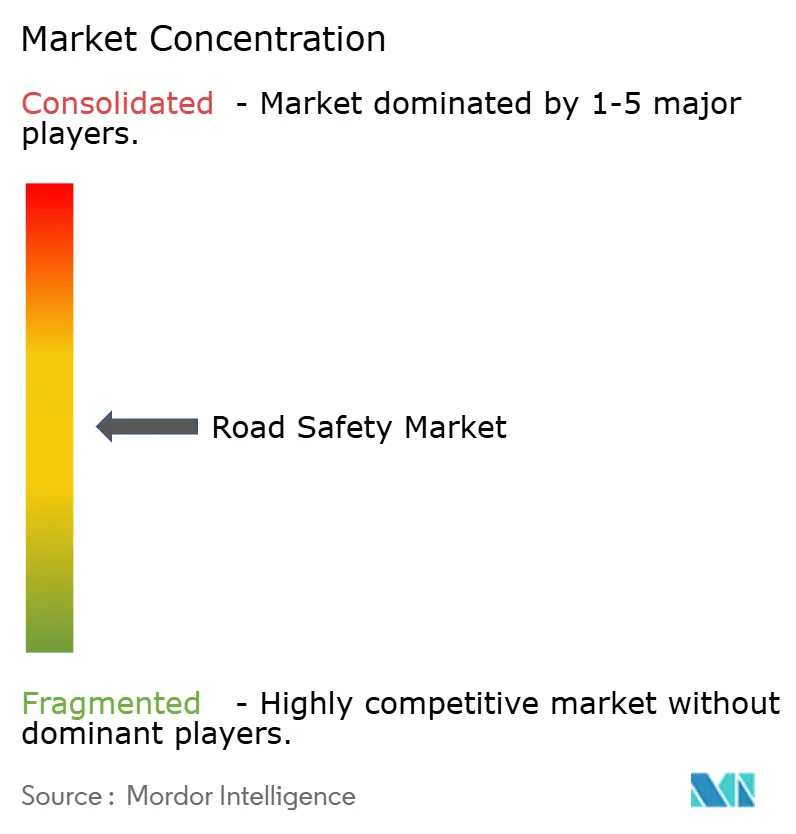
| Market Concentration | Medium |
Major Players *Disclaimer: Major Players sorted in no particular order Image © Mordor Intelligence. Reuse requires attribution under CC BY 4.0. | |
Road Safety Market Analysis by Mordor Intelligence
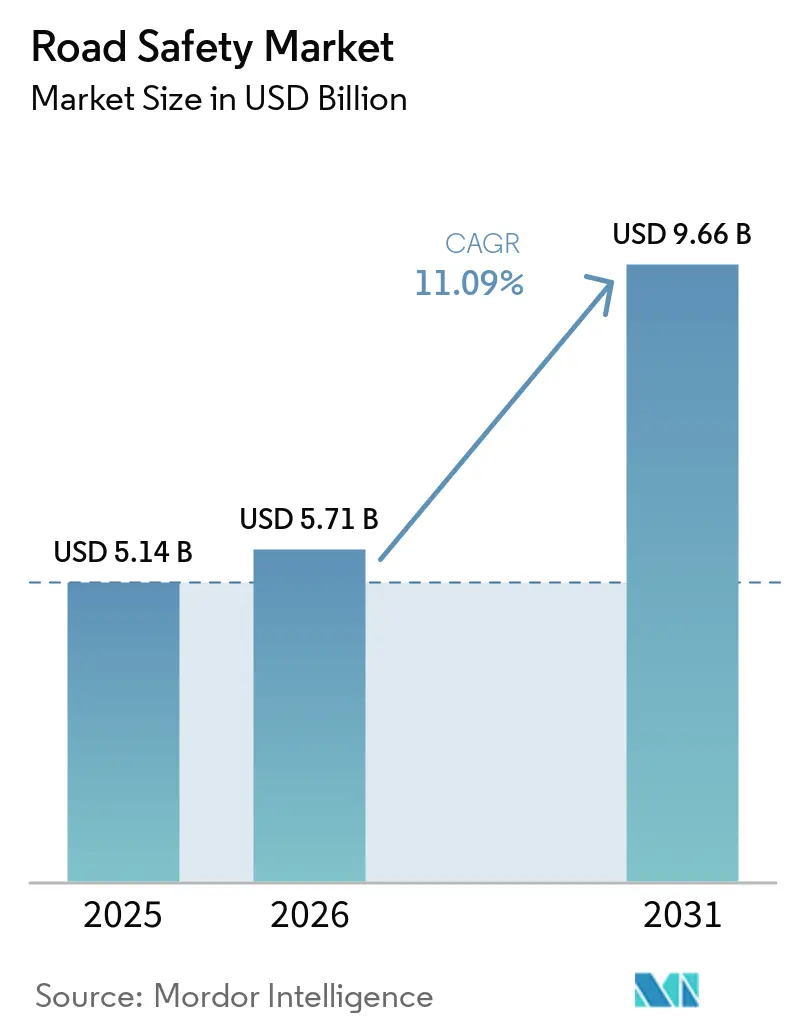
The road safety market size is expected to grow from USD 5.14 billion in 2025 to USD 5.71 billion in 2026 and is forecast to reach USD 9.66 billion by 2031 at 11.09% CAGR over 2026-2031. Investments linked to the EU Regulation 2019/2144, Vision Zero programs in the United States, and state-sponsored ITS funds in Asia have created synchronized demand cycles across hardware, software, and services. Red-light and speed-enforcement upgrades remain the revenue backbone, yet corridor-based monitoring, AI analytics, and V2X integration are redefining procurement specifications. North America’s performance-based contracts and Europe’s privacy-centric architectures are shaping vendor strategies, while Middle East smart-city projects and African corridor modernizations broaden the geographic addressable base. Against this backdrop, hardware refreshes are evolving into data-service annuities, tilting competitive advantage toward suppliers that can wrap analytics and compliance modules around deployed assets.
Key Report Takeaways
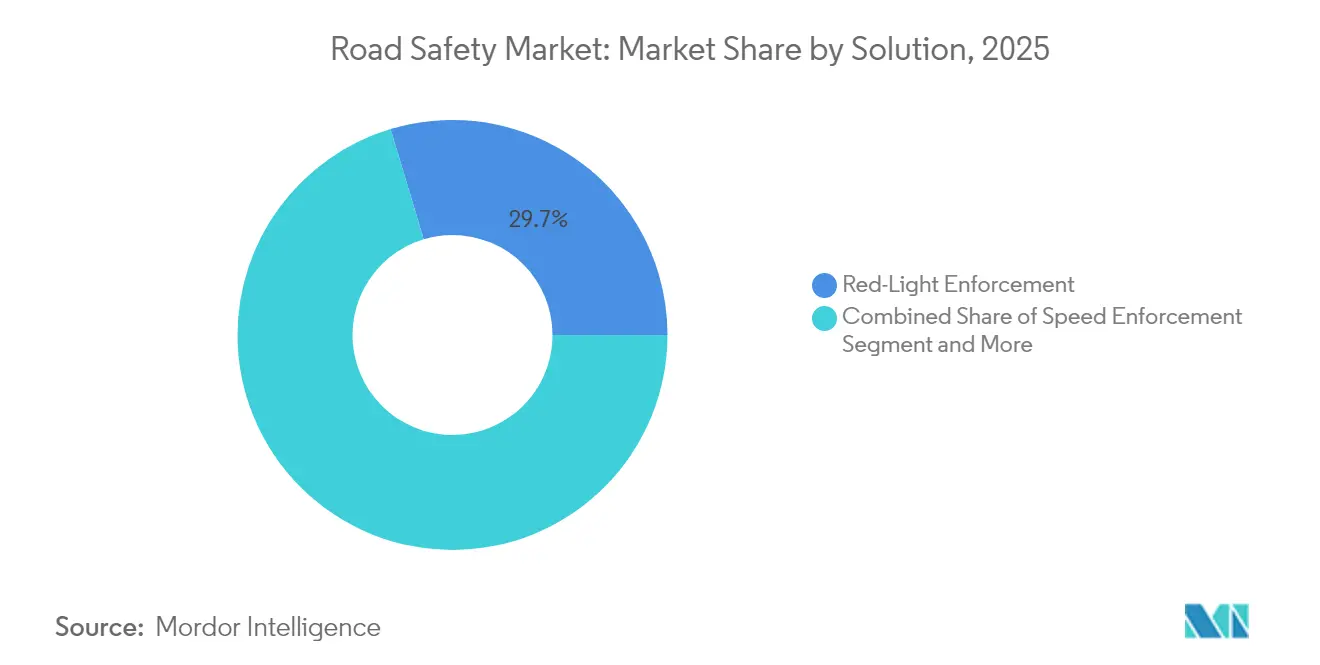
- By solution, Section/Average-Speed Enforcement is expanding at a 12.35% CAGR through 2031; red-light systems retained 29.65% road safety market share in 2025.
- By component, software is expected to expand with 10.8% CAGR during 2026-2031, whereas hardware still held 54.85% of the road safety market size in 2025.
- By enforcement type, fixed installations contributed 61.35% of the road safety market size in 2025; mobile/in-vehicle platforms are growing at 12.1% CAGR.
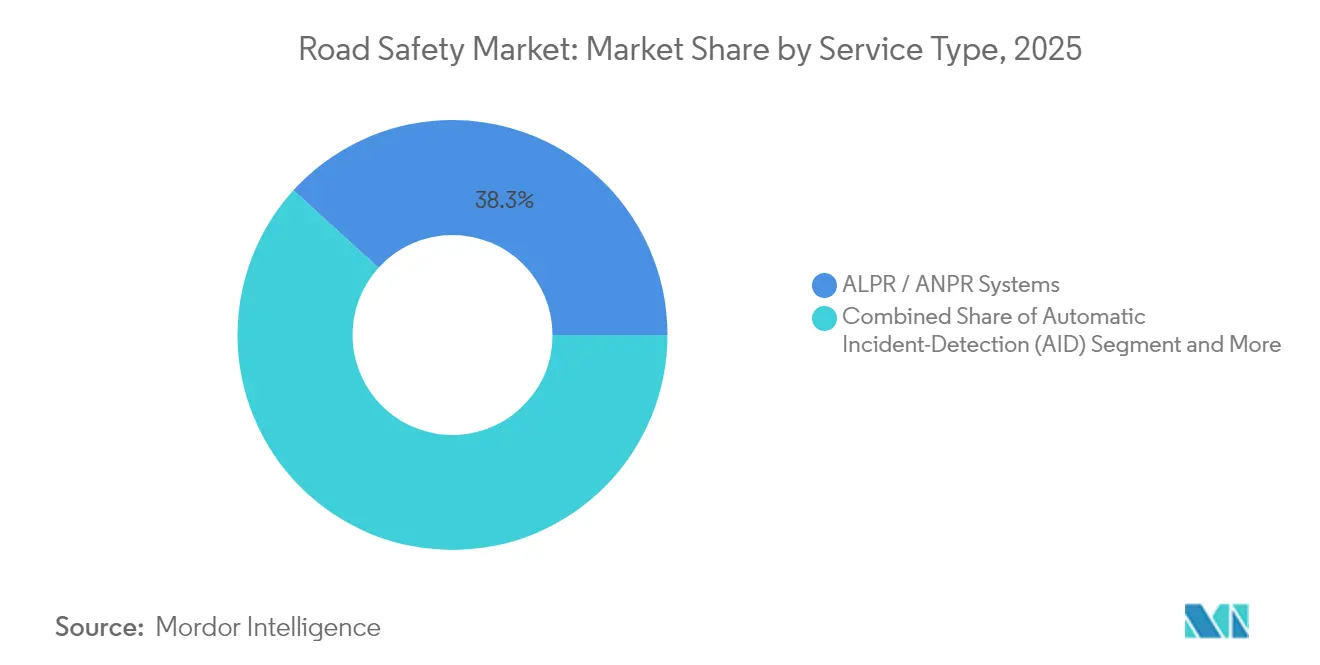
- By system type, ALPR/ANPR solutions commanded 38.25% road safety market share in 2025; automatic incident detection leads growth at 12.75% CAGR.
- By end-user, municipal and urban road authorities accounted for 45.85% of 2025 spend; commercial fleets are advancing at a 12.6% CAGR.
- By geography, North America generated 38.55% of 2025 revenue, while the Middle East and Africa post a 12.3% CAGR outlook.
Note: Market size and forecast figures in this report are generated using Mordor Intelligence’s proprietary estimation framework, updated with the latest available data and insights as of 2026.
Market Trends and Insights
Drivers Impact Analysis of Road Safety Market*
| Driver | (~) % Impact on CAGR Forecast | Geographic Relevance | Impact Timeline |
|---|---|---|---|
| EU 2030 enforcement-camera mandates drive equipment refresh | +2.1% | Europe, spillover to North America | Medium term (2-4 years) |
| Vision Zero plans propel U.S. speed-management budgets | +1.8% | United States | Short term (≤ 2 years) |
| China ITS upgrade fund accelerates ANPR rollout | +1.6% | China | Medium term (2-4 years) |
| India Bharatmala II highway safety corridors | +1.4% | India | Long term (≥ 4 years) |
| Smart-city mega-projects adopt AI road-safety analytics | +1.2% | Middle East focus | Medium term (2-4 years) |
| Insurance-telematics partnerships boost video analytics | +0.9% | North America and Europe | Short term (≤ 2 years) |
| Source: Mordor Intelligence | |||
EU 2030 enforcement-camera mandates drive equipment refresh
Mandatory advanced safety provisions effective July 2024 have forced European municipalities to overhaul legacy cameras and connect them with intelligent speed assistance and emergency-braking systems. Prague’s AI-enabled traffic control rollout by Yunex Traffic shows how enforcement assets migrate toward platform-based, predictive ecosystems.[1] Cross-border suppliers have standardized on EU-compliant firmware, pushing similar refresh programs into export markets. Contract structures are shifting from one-off hardware sales to 7- to 10-year managed-service agreements that lock in analytics subscriptions and cybersecurity updates
Vision Zero plans propel U.S. speed-management budgets
The USD 5 billion Safe Streets and Roads for All grant and USD 96 million in advanced technology awards have re-directed city budgets from reactive citation models to data-driven speed management. [2] Oakland, San Francisco, and New York City have contracted Verra Mobility for turnkey speed-safety programs, specifying performance clauses tied to collision-reduction metrics. This guaranteed outcome model incentivizes vendors to bundle AI analytics, sensor calibration, and cloud evidence management in a single service stack.
China ITS upgrade fund accelerates ANPR rollout
Beijing’s coordinated funding for V2X and ANPR targets the addition of 30 million connected vehicles annually by 2034, establishing a laboratory for predictive violation prevention. Unit economics benefit as domestic production scales, compressing global hardware prices and exporting Chinese protocol standards. Hikvision and Dahua now bid competitively in Latin American and African procurements that historically defaulted to European brands.
India Bharatmala II highway safety corridors
Bharatmala II weaves AI monitoring into greenfield highway construction, proven by Bengaluru’s 165-junction adaptive control network.[3] Embedding safety sensors at the planning stage shortens payback cycles and creates predictable upgrade paths aligned with pavement life-cycle schedules. Vendors able to integrate urban smart-city modules with national corridor projects strengthen cross-domain credibility.
Restraints Impact Analysis of Road Safety Market*
| Restraint | (~) % Impact on CAGR Forecast | Geographic Relevance | Impact Timeline |
|---|---|---|---|
| GDPR and CCPA data-retention limits on enforcement cameras | -1.5% | Europe and North America | Short term (≤ 2 years) |
| High capex for AI multi-sensor systems in LMICs | -1.1% | Asia-Pacific, MEA | Medium term (2-4 years) |
| Litigation push-back on automated speed enforcement | -0.8% | United States, spillover to Europe | Medium term (2-4 years) |
| Cyber-vulnerability in roadside IoT sensors | -0.6% | Global | Long term (≥ 4 years) |
| Source: Mordor Intelligence | |||
GDPR and CCPA data-retention limits on enforcement cameras
Meta’s EUR 1.2 billion (USD 1.296 billion) fine in 2025 underscored regulatory willingness to penalize non-compliance. Road safety operators must now build local processing nodes, avoid cross-border evidence storage, and automate deletion routines that sometimes conflict with evidentiary-chain rules. Compliance overhead tilts the playing field toward multinationals with in-house legal, security, and DevSecOps resources.
High capex for AI multi-sensor systems in LMICs
Intersection-level investments of USD 50,000–100,000 exceed tax revenues in many emerging municipalities. Concessional finance and revenue-share models exist but lengthen procurement cycles, delaying safety benefits. Vendors offering modular, upgrade-ready kits can unlock latent demand without compromising forecasting accuracy.
*Our forecasts treat driver/restraint impacts as directional, not additive. The impact forecasts reflect baseline growth, mix effects, and variable interactions.
Road Safety Market Segment Analysis
By Solution:
Corridor monitoring accelerates safety outcomesRed-light systems retained a 29.65% road safety market share in 2025, indicating that intersection protection remains foundational to municipal safety strategies. However, the corridor-based approach propelled Section/Average-Speed Enforcement to a 12.35% CAGR, demonstrating that continuous driver behavior modulation outperforms point-specific deterrence. That momentum is reinforced by national speed-harm studies feeding Vision Zero dashboards in the United States and speed-camera networks in France. The road safety market size attached to corridor monitoring is projected to expand faster than legacy intersection programs, incentivizing suppliers to bundle radar, lidar, and ALPR across contiguous segments.
The pivot from reactive ticketing to proactive analytics is reshaping revenue mechanics. Agencies now score bidders on crash-reduction forecasts, demanding configurable AI models that adapt to evolving traffic patterns. Vendors capable of integrating violation, congestion, and green-wave metrics into unified dashboards secure higher recurring fees and longer support contracts, mitigating lump-sum hardware margins.

By Component:
Software intelligence transforms asset valueHardware still dominated 54.85% of the road safety market size in 2025 due to camera, radar, and sensor procurement cycles. Yet software’s 10.8% CAGR signals that analytic layers, not steel and silicon, now dictate competitive differentiation. Cloud-native modules provide real-time edge processing, video redaction for GDPR, and fleet-operator APIs, enabling cities to pivot swiftly when grant stipulations evolve. ISS’s IntelliSection embeds computer-vision algorithms that triage intersection conflicts and recommend optimal phasing without civil-works upgrades.
Services revenue, anchored by 24×7 monitoring and KPI compliance reporting, climbs steadily as agencies outsource upkeep to contain payroll overhead. This services glide path erodes traditional pay-per-citation dependencies and drives multipliers on installed base valuation during M&A due diligence.
By Enforcement Type:
Mobile versatility unlocks fleet demandFixed cabinets recorded 61.35% of the 2025 deployment value, but fleet-integrated mobile platforms are trending at 12.1% CAGR, mirroring the insurance-telematics driver. Mobile units embedded in police cruisers or commercial vehicles extend enforcement coverage without expensive civil works, and AI object detection eliminates the need for operator judgment. Portable tripod kits remain the entry point for small towns and construction-zone projects where permanent fixtures lack ROI.
Commercial fleets see ROI through lower insurance deductibles and reduced litigation exposure. Verra Mobility’s in-vehicle enforcement suite illustrates how OEM-agnostic sensors and cloud analytics lower installation friction, nudging procurement toward subscription models
By System Type:
AI detection elevates situational awarenessALPR/ANPR platforms held 38.25% road safety market share in 2025, validating plate recognition as a mature baseline for tolling and enforcement. However, AI-driven incident detection is scaling at 12.75% CAGR as agencies deploy computer vision to pre-empt collisions and trigger dynamic lane controls. Currux Vision’s San José rollout outperformed legacy systems by delivering 90%+ violation detection accuracy and real-time alerting.
Variable message signs and intersection-safety cameras increasingly integrate with AI modules that feed alerts into traffic management centers, linking enforcement with flow optimization. Suppliers conversant with both computer-vision pipelines and secure V2X protocols gain a defensible edge as standards coalesce.
By End-User:
Private-sector adoption rewrites sales funnelsMunicipal and urban road authorities accounted for 45.85% of 2025 spending, but commercial fleets are posting a 12.6% CAGR through 2031. Liability-averse operators install driver-monitoring cameras and forward-collision sensors to unlock premium discounts and mitigate nuclear verdict risks. National highway agencies allocate capital toward corridor programs that sync with tolling and weigh-in-motion upgrades, while toll-road concessionaires embed enforcement within revenue-collection architecture to improve investor IRR profiles.
Vendor roadmaps increasingly feature enterprise-grade APIs and unified asset dashboards, allowing fleet managers to align compliance data with logistics platforms. The resulting stickiness drives multi-year license commitments, converting one-time hardware deals into recurring ARR.
Geography Analysis
North America Road Safety Market
North America generated 38.55% of 2025 revenue, buoyed by Vision Zero mandates and USD 60 million worth of federal V2X grants across Arizona, Texas, and Utah highways. The region continues to favor outcome-based procurements, forcing vendors to underwrite performance guarantees and embed continuous-improvement provisions in service-level agreements. Canada’s ITS-focused infrastructure bank and Mexico’s highway modernization targets extend addressable demand, with NAFTA-wide interoperability requirements driving standards harmonization.
Europe Road Safety Market
Europe’s trajectory remains steady as the 2019/2144 regulation orchestrates synchronized refresh cycles. Privacy and cybersecurity directives are stringent, but they also create export-ready compliance frameworks adopted by Asia and Latin America. Consolidation is accelerating; SWARCO’s Elmore Group purchase and Lacroix bid deepen supply-chain verticalization and broaden software stacks. Eastern Europe benefits from EU-funded smart-mobility corridors, expanding TAM without commensurate competitive intensity.
MEA Road Safety Market
The Middle East and Africa deliver a 12.3% CAGR, the fastest worldwide. Saudi Arabia’s NEOM blueprint and UAE’s ITS Master Plan roll out smart-city infrastructure unconstrained by legacy assets, letting AI-native platforms leapfrog older systems. African Union safety corridors—such as Kenya’s Road Safety Action Plan—attract blended-finance packages that reduce sovereign debt burden, creating predictable pipelines for mid-tier suppliers.
Regulatory Landscape
Road-safety technology demand is being shaped by diverging compliance models and fast-evolving automated-driving rulesets. In Europe, the EU type-approval framework continues to cascade into roadside enforcement and evidence-handling requirements, with Commission Implementing Regulation (EU) 2026/481 (March 2026) detailing technical procedures for type-approval of automated driving systems in fully automated vehicles and supporting broader alignment toward connected, data-rich safety architectures.
In the United States, compliance combines manufacturer self-certification to FMVSS with modernization efforts as NHTSA and the US Department of Transportation advance updates to accommodate autonomous vehicle operations and vehicles without conventional manual controls. At the global level, UNECE GRVA work on a draft Global Technical Regulation for ADS (under preparation for potential review in 2026) adds another standardization layer that affects V2X readiness, cybersecurity, and the auditability of AI-driven detection and enforcement workflows.
Value Chain Analysis
The road safety value chain covers sensing hardware (cameras, radar, lidar, VMS), edge compute and connectivity, core software (video analytics, ALPR/ANPR, incident detection, case and evidence management), and services (design, installation, calibration, operations, and long-term maintenance). Procurement increasingly bundles these layers into managed-service constructs. Sensys Gatso positions Traffic Enforcement as a Service (TRaaS) and has secured public-sector awards through partners such as Engie Solutions, while Kapsch TrafficCom emphasizes platform integration and project delivery across regions.
Upstream dependencies include semiconductor and optics supply, ruggedized enclosures, and secure communications components. Value is realized downstream through integration into traffic management centers and agency IT stacks (identity, payments, adjudication, and records). OECD work on supply-chain resilience highlights the role of digital tools, electronic transaction environments, and technical interoperability, which aligns with road-safety deployments where multi-vendor interoperability, local processing, and secure data exchange drive lifecycle cost and feasibility when scaling from pilot corridors to network-level programs.
Competitive Landscape
The road safety industry is moderately fragmented, . Kapsch TrafficCom booked EUR 539 million (USD 582.1 million) revenue and secured a USD 1.4 million Hawaii tunnel contract, capitalizing on referenceability within North America. Jenoptik leverages lidar IP for hybrid lidar-radar cameras, while Sensys Gatso pushes subscription pricing via managed-service contracts. SWARCO’s inorganic push—ten acquisitions since 2022—builds a diversified traffic technology stack spanning controllers, V2X radios, and analytics.
AI-native challengers such as Currux Vision, Omnisight, and Derq differentiate on computer-vision accuracy and cloud-agnostic deployment. Thales’s partnership with Cubic to launch eSIM vehicle connectivity extends aerospace-grade security into roadside domains. Established incumbents respond by embedding AI modules via internal R&D or bolt-on acquisitions and by creating venture funds to accelerate ecosystem participation.
Road Safety Industry Leaders
-
Kapsch TrafficCom AG
-
Jenoptik AG
-
Sensys Gatso Group AB
-
SWARCO AG
-
Verra Mobility Corp.
- *Disclaimer: Major Players sorted in no particular order
Road Safety Market Companies Covered in this Report
- Kapsch TrafficCom AG
- Jenoptik AG
- Sensys Gatso Group AB
- SWARCO AG
- Verra Mobility Corp.
- Redflex Holdings Ltd.
- FLIR Systems Inc.
- VITRONIC GmbH
- Motorola Solutions Inc.
- Thales Group
- Siemens Mobility
- Cubic Transportation Systems
- Information Engineering Group Inc.
- Clearview Intelligence Ltd.
- Conduent Business Services LLC
- Connected Wise LLC
- Dahua Technology Co. Ltd.
- Hikvision Digital Technology Co.
- Iteris Inc.
- Citilog SA
- AllGoVision Technologies Pvt Ltd.
- FRED Engineering
Market Opportunities and Future Outlook
A whitespace is forming at the intersection of vehicle-safety regulation and roadside enforcement platforms as automated-driving and advanced driver-assistance requirements become more prescriptive. The EU move to enforce new advanced safety rules taking effect on July 7, 2026 (covering functions such as vulnerable-road-user emergency braking and driver distraction warnings for passenger cars and vans) increases the incentive for road authorities and vendors to align enforcement and traffic management systems with richer, higher-frequency safety signals, including evidence workflows that can support mixed traffic of conventional and increasingly automated vehicles.
Another opportunity area involves compliance-ready, privacy- and cybersecurity-conscious architectures that reduce operational friction under tightening data governance, especially for camera and ALPR/ANPR deployments. Alongside this, the US Department of Transportation 2026 regulatory agenda accelerates autonomous-vehicle rulemaking and FMVSS modernization, while UNECE GRVA efforts toward a Global Technical Regulation for ADS support demand for interoperable V2X, secure credentialing, and audit-grade analytics. Vendors that can package edge processing, policy-driven retention, and platform integrations into multi-year service contracts are positioned to sustain recurring revenues as agencies shift from stand-alone hardware refreshes to corridor and network programs.
Recent Industry Developments in Road Safety Market
- June 2026: Kapsch TrafficCom AG announced a EUR 2.975 million, three-year maintenance and modernization contract for traffic systems in León, Spain, including integration of hardware into the EcoTrafiX platform. The deal supports service and maintenance capabilities while advancing a unified software footprint across the installed base. This reflects ongoing Spain enforcement modernization and a push to wrap analytics and compliance modules around deployed assets.
- June 2026: Kapsch TrafficCom AG reported three new video-based tolling projects in New Zealand (Bay of Plenty, Takitimu North Link Stage 1, and Ō Mahurangi - Penlink) awarded between November and December 2025. The projects broaden regional presence and diversify project-based revenue streams. This marks a step in APAC video tolling expansion and reinforces a pipeline-driven growth model.
- May 2026: Sensys Gatso Group AB announced an order valued at over SEK 25 million from a GCC member state to replace aging traffic monitoring infrastructure with speed and red-light enforcement systems. The upgrade strengthens the Middle East enforcement footprint and accelerates the transition to updated enforcement platforms. The action aligns with regional modernization efforts and enhanced asset-level profitability.
Road Safety Market Report Scope and Research Methodology
Market Definition and Coverage
For this study, the road safety market covers solutions and services that help prevent, detect, and enforce safer road use across highways and urban roads, including monitoring, analytics, and enforcement-related systems procured by public agencies and private operators.
Scope exclusions: We exclude general road construction and maintenance work that does not have a direct safety system or enforcement objective.
Segments Covered in This Report
- By Solution
- Red-Light Enforcement
- Speed Enforcement
- Section / Average-Speed Enforcement
- Bus-Lane Enforcement
- Incident Detection and Response
- By Component
- Hardware
- Software
- Services
- By Enforcement Type
- Fixed Systems
- Mobile / In-Vehicle Systems
- Portable / Tripod Systems
- By System Type
- ALPR / ANPR Systems
- Automatic Incident-Detection (AID)
- Intersection-Safety Cameras
- Variable Message / Warning Signs
- By End-User
- Municipal and Urban Road Authorities
- National Highway Agencies
- Law-Enforcement and Police Departments
- Toll-Road / Concession Operators
- Commercial Fleet Operators
- By Geography
- North America
- United States
- Canada
- Mexico
- South America
- Brazil
- Argentina
- Rest of South America
- Europe
- United Kingdom
- Germany
- France
- Italy
- Spain
- Nordics
- Rest of Europe
- Asia-Pacific
- China
- Japan
- India
- South Korea
- ASEAN
- Australia
- New Zealand
- Rest of Asia-Pacific
- Middle East and Africa
- Middle East
- GCC
- Turkey
- Israel
- Rest of Middle East
- Africa
- South Africa
- Nigeria
- Egypt
- Rest of Africa
- Middle East
- North America
Data Sources, Market Sizing, and Validation
Desk Research
Desk research helps us set clear boundaries on what is counted and what is excluded before the numbers are built. We start from publicly available road safety signals, including road fatality and crash statistics, vehicle miles traveled, and enforcement program indicators, using references such as NHTSA and FHWA in the US, and comparable transport ministries in other countries.
To estimate adoption and spending patterns, we also review procurement and budget trail data such as public tenders, project announcements, and safety program plans, along with standards and regulations where they clearly drive purchasing cycles (for example, rules that require specific vehicle safety or infrastructure monitoring features). On the supply side, we use company filings, investor presentations, and reputable press coverage to understand product mix and revenue exposure. Where needed, selective paid subscriptions support company financial intelligence, patent lookups, and tender tracking to reduce gaps and keep time periods aligned. The desk sources named here are illustrative, and other public references were also used to collect, validate, and clarify inputs.
Primary Interviews and Surveys
Primary work is used to test the desk assumptions with people who see quotes, deployments, and renewal cycles in practice. We speak with a mix of solution providers, component suppliers, system integrators, roadway operators, and public-sector buyers, and then we cross-check responses across APAC, EMEA, and the Americas so that no single region dominates the interpretation.
These discussions help us confirm what gets bundled into contracts (hardware, software, and services), how pricing moves with volumes, and which adoption barriers are slowing implementations. Those grounded learnings are then fed back into the model inputs.
Distribution of primary research fieldwork respondents
| Company type | Respondent position | Region |
|---|---|---|
| Top tier: 30% | CXOs: 13% | APAC: 37% |
| Mid tier: 52% | Functional/Unit leaders: 38% | EMEA: 36% |
| Smaller Players: 18% | Managers: 49% | Americas: 27% |
Market-Sizing & Forecasting
Sizing starts from a top-down approach where national and regional demand pools are reconstructed using enforcement and monitoring rollouts, roadway network coverage needs, and public spending capacity, and then translated into market value using typical system mix and contract structure. After that initial view is formed, we corroborate it with selective bottom-up checks, such as sampled contract values from tenders, supplier revenue exposure checks from filings, and simplified ASP times deployment volume calculations for major system types.
A few inputs that matter heavily for road safety include the pace of camera and sensor deployments, renewal cycles for software and maintenance, ticketing and compliance program intensity, smart corridor and ITS project starts, and policy-driven procurement timing in high-spend countries. Where data is thinner for smaller markets, we use proxy indicators like roadway length, urbanization, and known program funding so the estimate does not rely on precision that the available evidence cannot support.
For forecasting, scenario analysis is used, since policy changes and funding releases can shift spending quickly. Assumptions on deployment pace, pricing progression, and service attach rates are adjusted based on expert feedback, and the final outlook is kept consistent with realistic procurement and implementation lead times.
Data Validation & Update Cycle
Validation is done through several checks so that one data stream does not over-influence the outcome. Model outputs are compared against independent signals like tender volumes, program budgets, and observed deployment intensity, and large variances are reviewed before sign-off.
If an anomaly is found, we re-check the scope mapping, currency timing, and whether a one-time project is being treated as steady demand. When the gap is still not explained, we re-contact sources to close the evidence. Reports are refreshed annually, with interim updates when material changes in spending or regulations occur. Before delivery, an analyst performs a final pass so clients receive the latest updated view.
Mordor Intelligence's Road Safety Market Size Compared With Other Published Estimates
Published market values for road safety can look far apart because the underlying scope is rarely the same, and the math behind deployments and recurring services is not always stated clearly. Differences usually trace back to what is counted as road safety, how contract bundles are split, and how quickly pricing and adoption are assumed to move.
The largest gap comes from whether adjacent areas, such as generic ITS modernization, civil works, or vehicle-only safety content, are included. Mordor Intelligence counts road safety only when it is tied to a road safety solution or service with a clear enforcement or monitoring use case, and then validates the boundary against tender flow and renewal timing.
Benchmark comparison
| Source | Market Size | Gaps in Research Methodology |
|---|---|---|
| Mordor Intelligence | USD 5.71 B (2026) | |
| Industry Bulletin A | USD 4.45 B (2025) | Uses an earlier base year and tends to compress software and services into hardware-heavy totals, which reduces recurring revenue capture and shifts timing. |
| Research Note B | USD 3.90 B (2022) | Anchored on an older spend cycle and often includes narrower enforcement solutions only, which can miss corridor monitoring, analytics, and multi-year service contracts. |
The spread in values is mostly explained by scope boundaries and timing, not by arithmetic errors. When counted use cases, contract composition, and year definitions are made explicit, the market value becomes easier to reproduce and track over time using observable deployment and procurement signals.
Key Questions Answered in the Report
What is the current size of the road safety market and how fast is it growing?
The market is worth USD 5.71 billion in 2026 and is forecast to expand to USD 9.66 billion by 2031, reflecting an 11.09% CAGR.
Which geographic region leads road-safety spending today?
North America holds 38.55% of global revenue, supported by Vision Zero programs and federal V2X grants.
Which solution category is expanding the fastest?
Section/Average-Speed Enforcement systems post a 12.35% CAGR through 2031 as agencies shift toward corridor-based monitoring.
How important is software in future procurement cycles?
Software revenues are growing at 10.8% CAGR, signaling a pivot from camera hardware to AI-driven analytics subscriptions.