
Ring Main Unit (RMU) Market Size and Share
Market Overview
| Study Period | 2021 - 2031 |
|---|---|
| Market Size (2026) | USD 3.08 Billion |
| Market Size (2031) | USD 4.26 Billion |
| Growth Rate (2026 - 2031) | 6.72 % |
| Fastest Growing Market | Asia Pacific |
| Largest Market | Asia Pacific |
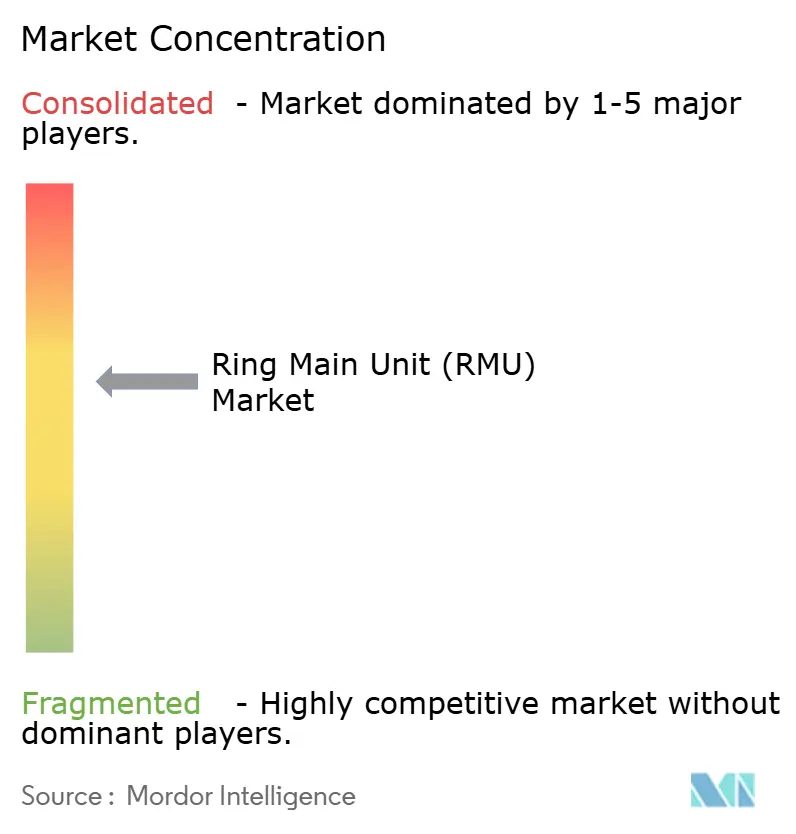
| Market Concentration | Medium |
Major Players *Disclaimer: Major Players sorted in no particular order Image © Mordor Intelligence. Reuse requires attribution under CC BY 4.0. | |
Ring Main Unit (RMU) Market Analysis by Mordor Intelligence
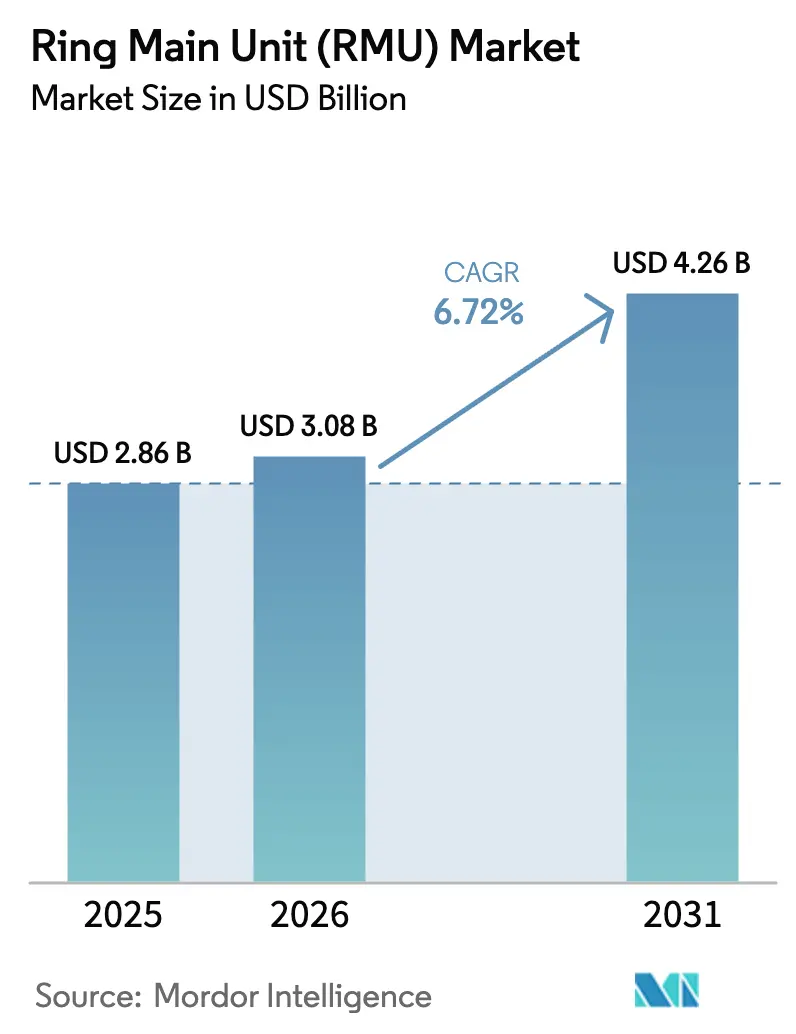
The ring main unit market size reaches USD 3.08 billion in 2026 and is forecast to grow to USD 4.26 billion by 2031 at a 6.72% CAGR, underscoring how medium-voltage distribution architecture is pivoting toward SF₆-free insulation, digital automation, and distributed-generation readiness. Gas-insulated platforms still dominate revenue because of long-lived installed bases, yet impending regulatory bans, particularly Europe’s F-Gas Regulation (EU) 2024/573, are redirecting research and procurement budgets to vacuum and solid-dielectric technologies. At the same time, North American utilities deploy IEC 61850-compliant secondary substations to meet SAIDI targets under NERC, while Asia-Pacific mega-cities bury feeders to free surface space and reduce storm-related faults. End-user behavior reflects these shifts: distribution utilities upgrade aging assets to harden networks, renewable developers specify medium-voltage collector loops for solar and wind parks, and hyperscale data-center owners demand 99.995% uptime. Competitive intensity is moderate, with the top five vendors controlling roughly 55% of 2025 global revenue, but localized manufacturing by Chinese challengers compresses margins in price-sensitive regions.
Key Report Takeaways
- By insulation type, gas-insulated configurations captured 58.2% of 2025 revenue, while solid and SF₆-free variants are projected to expand at a 9.5% CAGR to 2031.
- By installation, outdoor units held a 57.5% share in 2025, whereas indoor designs are forecast to compound at 8.4% through 2031.
- By voltage rating, the up-to-15 kV segment accounted for 43.3% of 2025 demand, but the above-25 kV class is set to grow at 7.7% through 2031.
- By automation level, conventional manually operated RMUs comprised 77.7% of 2025 shipments, yet smart and motorized variants will register a 9.0% CAGR to 2031.
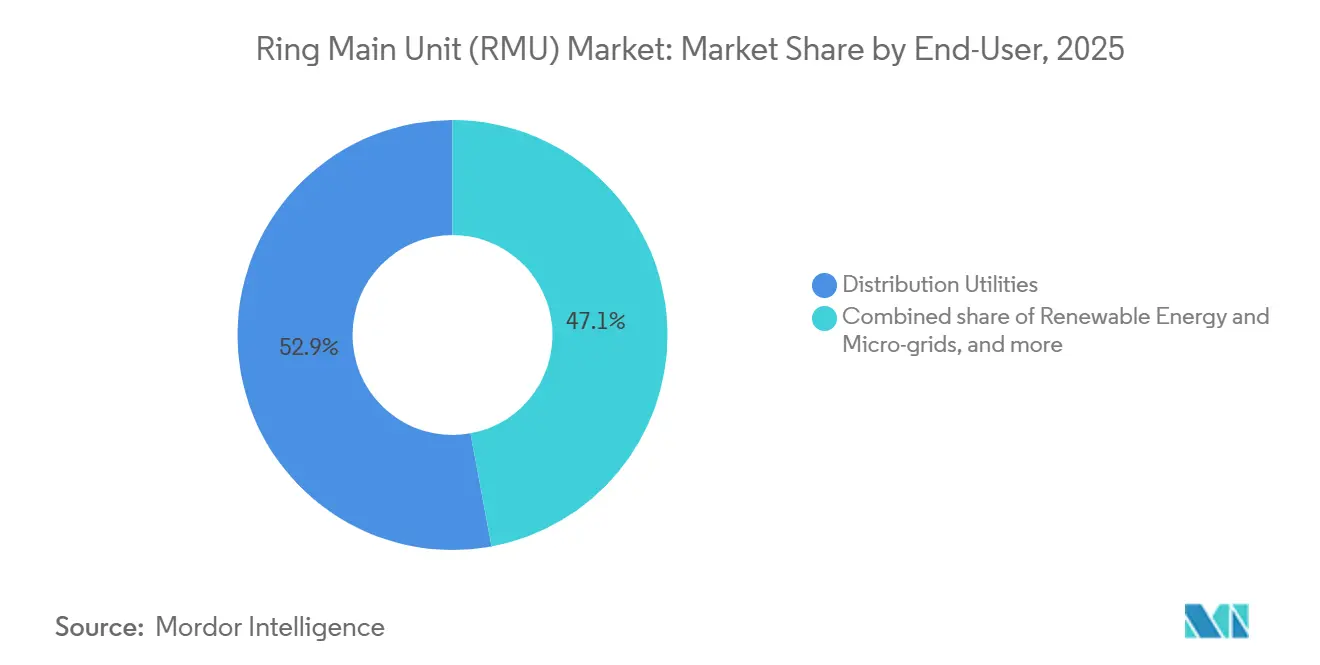
- By end-user, distribution utilities commanded 52.9% of 2025 revenue, while renewable energy and micro-grids represent the fastest-growing bracket at an 8.8% CAGR.
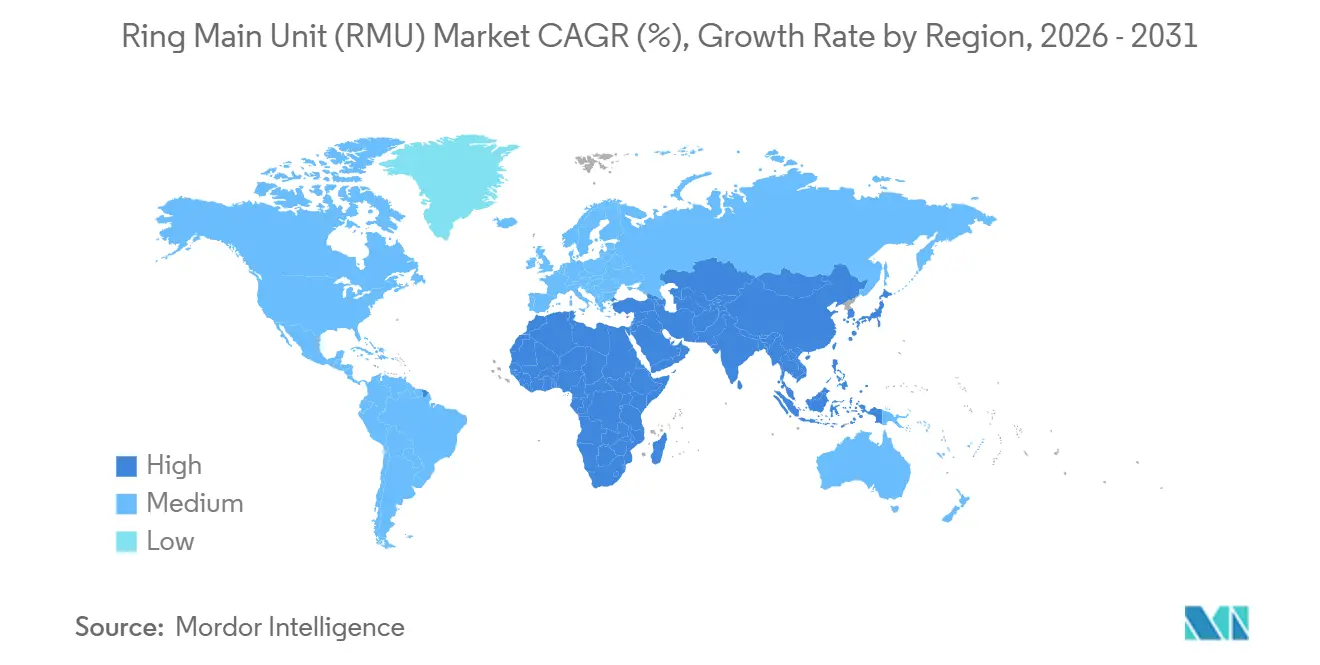
- By geography, Asia-Pacific led with 43.2% of 2025 sales and is expected to advance at an 8.4% CAGR through 2031.
Note: Market size and forecast figures in this report are generated using Mordor Intelligence’s proprietary estimation framework, updated with the latest available data and insights as of January 2026.
Global Ring Main Unit (RMU) Market Trends and Insights
Drivers Impact Analysis*
| Driver | (~) % Impact on CAGR Forecast | Geographic Relevance | Impact Timeline |
|---|---|---|---|
| SF₆-free RMU Adoption Accelerated by EU F-Gas Phase-Out | 1.8% | Europe, North America, APAC (Japan, South Korea) | Medium term (2-4 years) |
| Urban Underground Distribution Upgrades in Asia Mega-Cities | 1.5% | APAC core (China, India, ASEAN), spill-over to Middle East | Long term (≥ 4 years) |
| Grid-Automation Investments by North-American Utilities | 1.2% | North America, Europe | Medium term (2-4 years) |
| Medium-Voltage Collector Circuits in Renewable Parks | 1.0% | Global, with concentration in APAC, Europe, North America | Long term (≥ 4 years) |
| Sub-Transmission Retrofit Programs across GCC States | 0.7% | Middle East (UAE, Saudi Arabia, Qatar, Kuwait) | Short term (≤ 2 years) |
| High-Reliability Demand from Hyperscale Data-Centres | 0.6% | North America, Europe, APAC (Singapore, Hong Kong) | Short term (≤ 2 years) |
| Source: Mordor Intelligence | |||
SF₆-Free RMU Adoption Accelerated by EU F-Gas Phase-Out
Regulation (EU) 2024/573 bans SF₆-insulated switchgear up to 24 kV from January 2026 and up to 52 kV by January 2030, forcing utilities to migrate toward vacuum interrupters and solid dielectrics.[1]European Commission, “Regulation (EU) 2024/573,” europa.eu Suppliers such as ABB and Eaton have already commercialized SF₆-free RMUs that replicate 25 kA short-circuit ratings while removing fluorinated gases. Certification costs for technicians handling residual SF₆ equipment also climb under Regulation 2025/627, accelerating fleet turnover. Across the Atlantic, Pacific Gas & Electric now specifies vacuum technology for any secondary substation commissioned after 2024 in anticipation of future EPA restrictions. Newly revised IEC 62271 series tests assure interoperability across the emerging dielectric mix, further derisking adoption.
Urban Underground Distribution Upgrades in Asia Mega-Cities
State Grid Corporation of China directs CNY 520 billion (USD 73 billion) per year to bury 10 kV feeders in Beijing, Shanghai, Shenzhen, and Guangzhou, curbing visual clutter and storm damage.[2]State Grid Corporation of China, “Annual Investment Plan,” sgcc.com.cn India’s Revamped Distribution Sector Scheme allocates INR 3 lakh crore (USD 36 billion) through 2027 for similar ring-main topologies in Delhi, Mumbai, and Bangalore. ASEAN utilities echo the trend as Singapore enforces 100% underground distribution. Compact indoor RMUs occupy 40–60% less footprint than outdoor enclosures, fitting basements beneath high-rise developments. High downtown land prices of USD 10,000 per m² in Hong Kong and Tokyo make below-grade installations financially rational despite higher switchgear unit prices.
Grid-Automation Investments by North-American Utilities
The U.S. Department of Energy’s Grid Modernization Initiative invests USD 3.5 billion annually to embed sensors and automate distribution gear, targeting a SAIDI below 100 minutes by 2030.[3]U.S. Department of Energy, “Grid Modernization Initiative,” energy.gov Utilities install IEC 61850-enabled RMUs that isolate faults in seconds, slashing truck-roll expenses. National Grid’s 2024 filing earmarked USD 47.7 million for digital ring-main retrofits. Schneider Electric’s EcoStruxure analytics forecast insulation degradation up to 18 months in advance, reducing unscheduled outages by 35% at Duke Energy pilot sites. NERC CIP standards now obligate cybersecurity modules in any IP-connected RMU, adding USD 5,000–10,000 per unit.
Medium-Voltage Collector Circuits in Renewable Parks
Every 100 MW solar farm typically needs 10–15 RMUs to segment inverters into switchable blocks, improving O&M flexibility. IEEE 1547-2018 ride-through rules push suppliers to integrate fast-clearing vacuum interrupters that operate within three cycles. Offshore wind demands IP67-rated enclosures; Siemens Gamesa specifies marine-grade RMUs for 33 kV collector hubs. Battery storage adds bidirectional power flow, so four-quadrant switching logic becomes mandatory, while NREL studies show ring-main topologies lowering balance-of-system cost 8–12% relative to radial schemes.
Restraints Impact Analysis*
| Restraint | (~) % Impact on CAGR Forecast | Geographic Relevance | Impact Timeline |
|---|---|---|---|
| High Cap-Ex & Limited Local Assembly in Sub-Saharan Africa | -0.9% | Sub-Saharan Africa (Nigeria, Kenya, Ghana, Tanzania) | Long term (≥ 4 years) |
| SF₆ Phase-Out Transition-Cost Uncertainty for Utilities | -0.6% | Europe, North America | Short term (≤ 2 years) |
| Lengthy Utility Type-Approval Cycles in South America | -0.5% | South America (Brazil, Argentina, Colombia) | Medium term (2-4 years) |
| Vacuum Interrupter & Semiconductor Supply Volatility | -0.4% | Global | Short term (≤ 2 years) |
| Source: Mordor Intelligence | |||
High Cap-Ex & Limited Local Assembly in Sub-Saharan Africa
Electrification lags at 48% and utilities prioritize generation over distribution, leaving RMU adoption restrained by unit prices of USD 15,000–50,000 versus USD 5,000–10,000 for pole-mounted gear.[4]World Bank, “Tracking SDG 7,” worldbank.org Ninety percent of switchgear is imported, exposing projects to currency swings such as Nigeria’s 40% naira devaluation in 2024. Local assembly remains nascent, with only a few Schneider Electric and ABB facilities serving South Africa and Kenya. Skills shortages prolong commissioning by 6–12 months, eroding investor confidence.
SF₆ Phase-Out Transition-Cost Uncertainty for Utilities
Vacuum and solid-dielectric RMUs carry a 15–20% purchase-price premium, so business cases depend on assumptions around carbon pricing and disposal fees. Regulation 2024/573 allows SF₆ maintenance until 2035, letting operators sweat assets and defer capital outlays. U.S. utility decisions are left to state commissions, causing patchwork adoption: California’s IOUs pledged voluntary reduction targets, while southeastern cooperatives still procure gas-insulated designs. Limited vacuum-interrupter production capacity, expanded only 12% between 2022 and 2024, sustains premiums.
*Our forecasts treat driver/restraint impacts as directional, not additive. The impact forecasts reflect baseline growth, mix effects, and variable interactions.
Segment Analysis
By Insulation Type: Vacuum Technology Reshapes Dielectric Mix
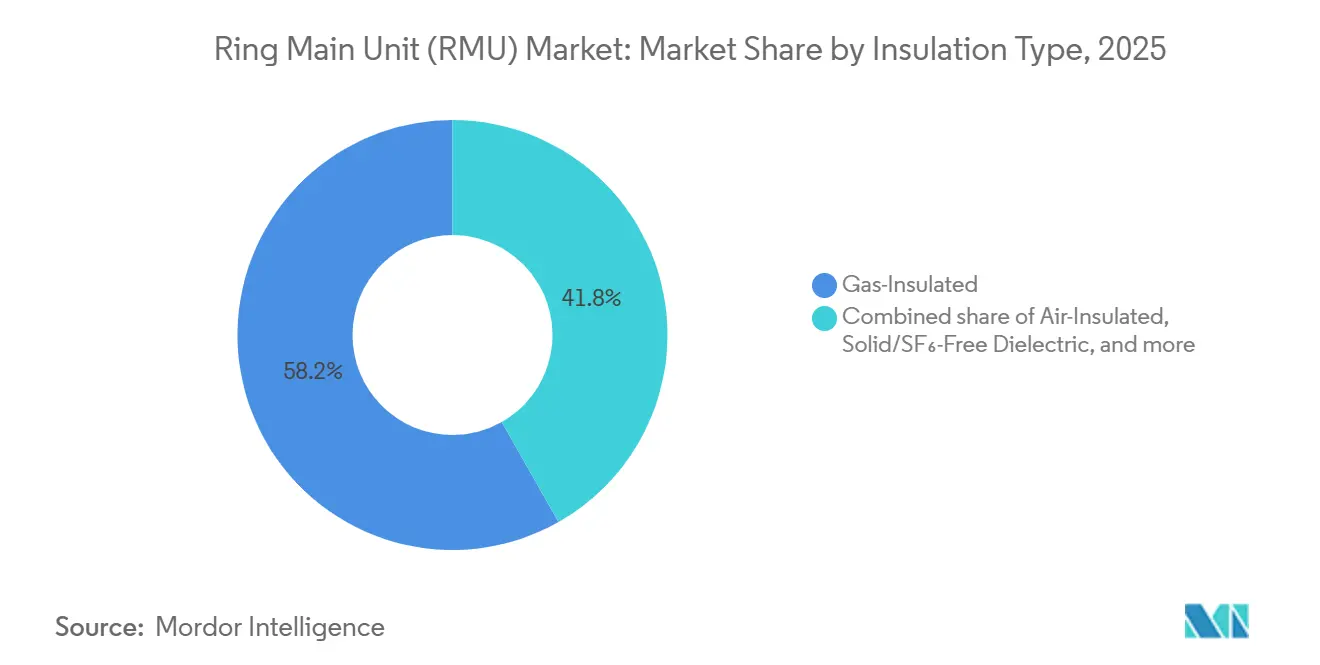
Gas-insulated units held 58.2% of 2025 revenue. Solid and SF₆-free designs, however, will advance at a 9.5% CAGR, pushing gas-insulated share below 50% by 2028. Eaton’s Xiria achieves 630 A continuous current and 25 kA short-circuit within a footprint 20% smaller than gas units, appealing where vault space is fixed. Utilities face retraining costs of USD 10,000–20,000 per maintenance crew for vacuum diagnostics. The ring main unit market share for solid dielectrics is forecast to reach 35% in 2031, up from 18% in 2025.
Gas-insulated incumbency remains strong in high-fault networks up to 40 kA, but voluntary SF₆ bans in California and Japan signal a global pivot. Air-insulated RMUs thrive in dust-free rural networks under 20 kA, while oil-insulated variants edge toward obsolescence. Lifecycle carbon disclosures, now required by many European tenders, are hastening the shift.


By Installation: Space Economics Favor Indoor Configurations
Outdoor RMUs generated 57.5% of 2025 sales, yet indoor installations will compound at 8.4% through 2031, buoyed by real-estate premiums in dense cities. When land acquisition, fencing, and aesthetic mitigation are included, indoor options often undercut the outdoor total installed cost. Singapore already records an indoor penetration above 90%. In contrast, the ring main unit market size for outdoor gear remains higher in the GCC because ventilation and land availability outweigh space constraints.
Schneider’s SM6 series (0.8 m² per feeder bay) exemplifies how compact indoor gear enables retrofit without civil expansion. IEEE C37.20.7 environmental tests add USD 5,000–10,000 certification overhead for outdoor variants exposed to solar radiation, sand, and seismic risk. As urban ordinances ban visible equipment, utilities in Europe, Japan, and South Korea pivot to indoor.
By Voltage Rating: Sub-Transmission Boosts High-Voltage Segment
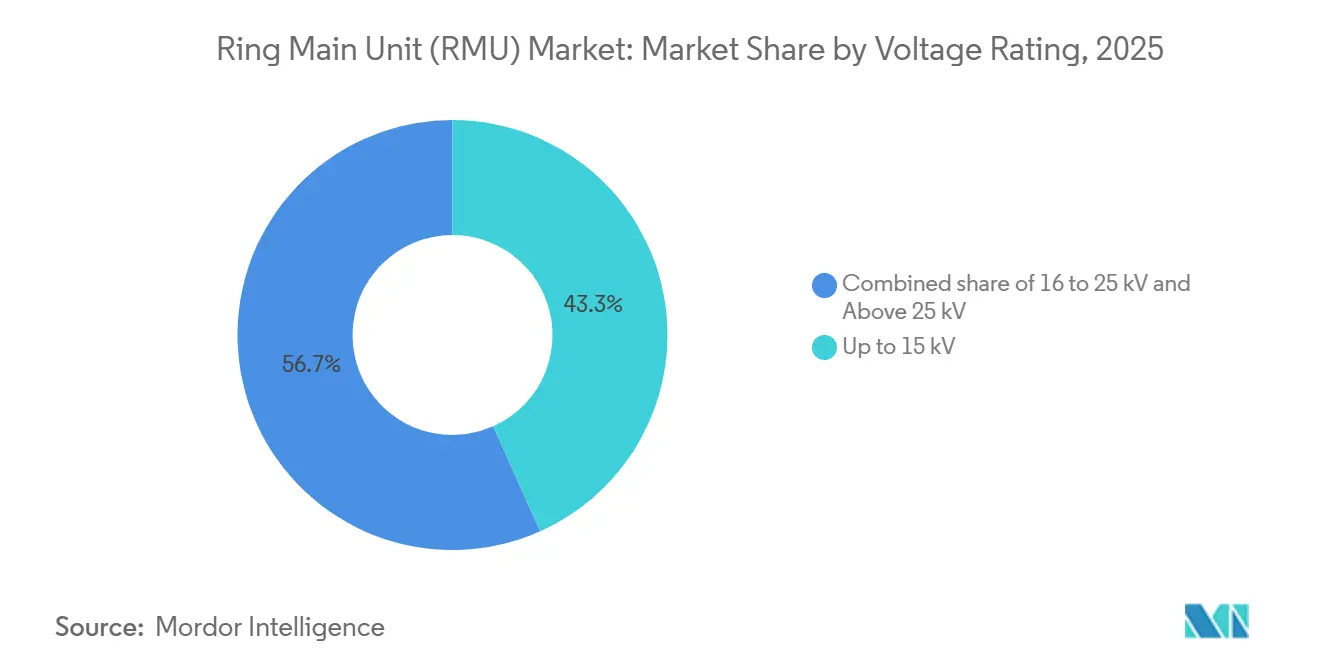
The up-to-15 kV class captured 43.3% of 2025 demand, fueled by residential feeders. Above-25 kV units will, however, log a 7.7% CAGR as cities and heavy industry migrate to 33–40.5 kV loops to curb copper mass and improve voltage drop. A 100 MW data-center campus needs only 8–10 RMUs at 40.5 kV versus 15–20 units at 24 kV, yielding a 12–15% installed-cost gain.
Mining conveyor, arc-furnace, and mega-project applications push short-circuit duties to 31.5 kA, so vacuum interrupters designed to IEC 62271-100 dominate. GCC states, and Australia already specify 36 kV ratings for sub-transmission rings, while European utilities begin piloting 40.5 kV urban feeders.
By Automation Level: Digital Integration Accelerates Smart Adoption
Conventional units still count for 77.7% of 2025 installations, mostly in emerging markets. Smart and motorized RMUs, however, will grow at 9.0% per year. NERC CIP-required cybersecurity modules cost USD 5,000–10,000 per unit but cut outage restoration time by 40% by enabling remote segmentation. The ring main unit market size for smart variants is projected to climb to USD 1.9 billion by 2031.
ABB’s Ability and Siemens SICAM suites link real-time data to asset-management dashboards, lengthening maintenance cycles 10–15%. Asia-Pacific adoption lags at 10–15% penetration because manual switching labor remains cheap, yet regulators are moving to performance-based incentives that reward automation.
By End-User: Renewables Reshape Demand Patterns
Distribution utilities own 52.9% of 2025 revenue, but renewables and micro-grids rise fastest at 8.8% CAGR. A 100 MW solar plant typically deploys 10–15 RMUs to segment collectors; offshore wind requires IP67 durability, adding 30–40% cost. The ring main unit market size for renewable parks is expected to exceed USD 700 million by 2031.
Industrial users such as steel and cement integrate 36 kV RMUs rated 31.5 kA to handle high-fault currents. Commercial complexes select indoor gear for aesthetics and real-estate reasons, with Schneider’s SM6 popular in Singapore malls and European CBDs. IEEE 1547-2018 fully embeds medium-voltage ride-through, tightening component specifications across all renewables.
Geography Analysis
Asia-Pacific generated 43.2% of 2025 revenue and will persist at an 8.4% CAGR, driven by China’s annual CNY 520 billion (USD 73 billion) grid budget and India’s INR 3 lakh crore (USD 36 billion) modernization scheme. Solid and SF₆-free adoption in the region is forecast to reach 25% of sales by 2028. Japan and South Korea retrofit substations with smart RMUs to align with METI guidelines on fluorinated-gas alternatives. Europe, the second-largest market, accelerates due to the 2026 and 2030 SF₆ bans. Germany, France, Spain, and the Nordics already see SF₆-free products capturing 40% of 2025 new installations. Ofgem’s RIIO-ED2 in the U.K. links expenditure to outage penalties, spurring digital RMU uptake.
North America benefits from USD 3.5 billion in annual DOE funding but remains fragmented by state regulation. Mexico’s CFE will spend MXN 80 billion (USD 4.7 billion) in 2024 on ring-main upgrades in urban centers. South America wrestles with 12–18-month certification lags that keep gas-insulated dominance intact. Brazil’s ring main unit market will, however, recover as ANEEL channels R$20 billion (USD 4 billion) into distribution 2024–2025. The Middle East invests heavily, with DEWA allocating AED 86 billion (USD 23.4 billion) and SEC spending SAR 50 billion (USD 13.3 billion) yearly on 33–36 kV loops suited to giga-projects. Sub-Saharan Africa remains constrained by high cap-ex and currency volatility. Yet localized assembly efforts by CHINT and TGOOD, plus IFC-backed electrification funding, could unlock latent demand if cost curves fall.

Regulatory Landscape
RMU design, testing, and acceptance are anchored to the IEC 62271 family for medium-voltage metal-enclosed switchgear, with IEC 62271-200:2021 + AMD1:2024 updating requirements on construction and internal arc-related test descriptions for equipment up to 52 kV. At the same time, decarbonisation policy is shaping RMU insulation choices in Europe through Regulation (EU) 2024/573, which tightens allowable use of fluorinated gases in new medium-voltage switchgear and pushes procurement toward SF6-free options for common distribution voltage classes.
Permitting and network-planning policy is also shifting from project-by-project approvals toward prioritized, plan-led delivery for grid assets that include secondary substations and associated switchgear. In the United Kingdom, National Policy Statement EN-5 (2025) elevates electricity networks infrastructure to Critical National Priority status, and The Electricity Network Connections (Designated Strategic Plans) Regulations 2026 designate strategic plans intended to guide and prioritize grid connections. At the EU level, the Council position on the European Grids Package (26 June 2026) points to streamlined permit-granting for energy network infrastructure, reducing lead-time risk for distribution reinforcement programs that drive RMU tenders.
Competitive Landscape
Five incumbents, ABB, Schneider Electric, Siemens, Eaton, and Larsen & Toubro, control around 55% of the 2025 global revenue. ABB markets the SafeRing vacuum-solid platform up to 24 kV, whereas Eaton’s Xiria offers a 20% smaller footprint. Schneider’s EcoStruxure analytics yielded a 35% drop in unplanned outages during Duke Energy pilots. Chinese entrants CHINT, TGOOD, and Shanghai Electric gain share by localizing assembly and underpricing rivals 20–30% in emerging regions.
Alfanar leverages Vision 2030 local-content rules to secure turnkey Saudi contracts, assembling RMUs with 60% indigenous parts. Hyundai Electric expanded into the Middle East sub-transmission by leveraging KRW 3.2 trillion (USD 2.4 billion) in 2023 revenue. Patent filings center on vacuum-interrupter metallurgy and solid-dielectric formulations, signaling a race toward reliability rather than price.
Ring Main Unit (RMU) Industry Leaders
ABB Ltd.
Schneider Electric SE
Siemens AG
Eaton Corporation plc
Lucy Electric Ltd.
- *Disclaimer: Major Players sorted in no particular order

Market Opportunities and Future Outlook
The SF6 phase-out cycle is creating near-term demand for SF6-free RMUs that can be installed in constrained urban substations without expanding civil footprints, particularly where replacement programs need to preserve existing layouts. One concrete example is Schneider Electric and Southern California Edison announcing SF6-free switchgear deployments (GMAirSeT) at the Great Lakes and Running Springs substations in June 2026, using footprint-preserving upgrades to add grid capacity. This kind of substation reinforcement tends to pull through adjacent needs such as digital monitoring, communication interfaces, and utility qualification testing.
Manufacturers are also adjusting capacity and product roadmaps to match the insulation and voltage mix shift, creating opportunities for vendors that can localize production and qualify new dielectric platforms quickly. Siemens announced a USD 341 million investment in July 2026 to expand switchgear manufacturing capacity in Germany (including a new facility in Offenbach and expansions in Frankfurt), while CG Power inaugurated phase one of an INR 800 crore switchgear capacity plan in Nashik in June 2026 and disclosed development of 33 kV SF6-free RMU and GIS products in July 2026. China-specific standardization is tightening interfaces and performance expectations through SGCCs Q/GDW 11250.2-2025 technical specification for RMUs, which supports scale for suppliers with compliant, standardized designs across large utility procurement frameworks.
Recent Industry Developments
- May 2026: State Grid Changzhou Power completed the first medium-voltage generator parallel operation via a ring main unit (RMU) in Liyang, enabling maintenance activities with zero outage. The project shows how RMUs are being used as operational tools for continuity in distribution networks, supporting automation-ready configurations in utility standards and tenders.
- February 2025: Tata Power and Schneider Electric announced deployment of 11 kV SF6-free RMUs for Mumbai and Delhi using RM AirSeT technology. The deal created a utility-scale reference for SF6-free RMUs in dense urban networks, supporting broader qualification of alternative insulation platforms in high-reliability city feeders.
- October 2024: Schneider Electric launched Ringmaster AirSeT in the United Kingdom, produced at its Leeds facility after a GBP 7.2 million investment. Local production for SF6-free RMUs reduces lead times and supports utility adoption by pairing new products with in-country manufacturing and service capability.


Research Methodology Framework and Report Scope
Market Definition and Coverage
We size the ring main unit market as revenues from new, factory-built medium-voltage RMU switchgear assemblies (typically up to 36 kV) used to distribute power safely in ring or radial networks across grid, industrial, and infrastructure settings.
Scope exclusions: We exclude retrofit panels, spare parts only sales, and after-sales service revenues from the market total.
Segmentation Overview
- By Insulation Type
- Gas-Insulated
- Air-Insulated
- Oil-Insulated
- Solid/SF₆-Free Dielectric
- By Installation
- Outdoor
- Indoor
- By Voltage Rating
- Up to 15 kV
- 16 to 25 kV
- Above 25 kV (incl. 36/40.5 kV)
- By Automation Level
- Conventional
- Smart/Motorized/Digital RMU
- By End-User
- Distribution Utilities
- Industrial Facilities
- Commercial and Residential Infrastructure
- Renewable Energy and Micro-grids
- By Geography
- North America
- United States
- Canada
- Mexico
- Europe
- United Kingdom
- Germany
- France
- Spain
- Nordic Countries
- Russia
- Rest of Europe
- Asia-Pacific
- China
- India
- Japan
- South Korea
- ASEAN Countries
- Rest of Asia-Pacific
- South America
- Brazil
- Argentina
- Colombia
- Rest of South America
- Middle East and Africa
- United Arab Emirates
- Saudi Arabia
- South Africa
- Egypt
- Rest of Middle East and Africa
- North America
Data Sources, Market Sizing, and Validation
Desk Research
Desk research starts by mapping the demand pool and the technical footprint of RMUs in distribution grids, then narrows to value counted as new equipment revenue. Public sources such as the International Energy Agency (grid investment and electrification trends), U.S. Energy Information Administration (electricity data), Eurostat (energy and infrastructure indicators), and World Bank (access and infrastructure spend proxies) are used to anchor macro direction.
We also review grid codes and policy documents, along with utility and manufacturer filings, investor presentations, and reputable trade press, to understand order cycles and product shifts such as SF6-free designs. Where available, we use paid subscriptions for company financials and intelligence, patent databases, and an import/export shipment-level database to cross-check product activity and timing. This list is not exhaustive, and additional sources were used for data collection, validation, and clarification.
Primary Interviews and Surveys
Primary work is used to pressure-test what RMU revenues include in practice, and we focus on pricing, lead times, insulation mix shifts, and tender behavior that is not obvious from public reporting. We speak with a spread of participants such as OEM sales teams, utility procurement and distribution planning staff, EPC contractors, and independent service partners, then validate patterns across APAC, EMEA, and the Americas so one region does not over-steer the model.
Distribution of primary research fieldwork respondents
| Company type | Respondent position | Region |
|---|---|---|
| Top tier: 38% | CXOs: 13% | APAC: 43% |
| Mid tier: 45% | Functional/Unit leaders: 34% | EMEA: 36% |
| Smaller Players: 17% | Managers: 53% | Americas: 21% |
Market-Sizing & Forecasting
Sizing begins from the demand side, where distribution build-out signals are used to reconstruct the likely RMU requirement by geography, followed by an adjustment for replacement needs in aging networks. The result is then corroborated with selective top-down and bottom-up checks, such as sampled average selling price (ASP) by insulation type multiplied by expected unit volumes, plus sanity checks against supplier revenue exposure disclosed in filings.
The model inputs include medium-voltage distribution capex direction, substation and feeder expansion activity, urbanization and electrification indicators, technology mix shifts (SF6 versus alternatives), and tender cadence in utility and infrastructure projects. Because RMUs are bought in project cycles, we use scenario analysis to reflect faster and slower grid investment paths. The final forecast is aligned to what primary experts view as realistic ASP progression and adoption timing. Where supplier coverage or country-level visibility is limited, those areas are filled using proxy ratios from similar grid build profiles and rechecked in interviews before totals are finalized.
Data Validation & Update Cycle
Outputs are checked against independent signals such as grid investment trend lines, announced utility programs, and trade activity patterns. We look for sharp year-over-year jumps that do not match typical procurement cycles. If variances show up by region or insulation mix, assumptions are revisited, and when needed, respondents are re-contacted to confirm what changed and when it changed.
Each estimate goes through a multi-step analyst review so definitions, currency treatment, and year alignment stay consistent. Reports are refreshed annually, and interim updates are made when material policy or supply changes occur. Before delivery, we complete a fresh pass to reflect the latest public releases and confirmed market signals.
Mordor Intelligence's Ring Main Unit Market Size Compared With Other Published Estimates
Published RMU market values often differ because the product boundary is not treated the same way, and because pricing, currency timing, and forecast starting points are not aligned. Differences also show up when one estimate relies more on shipments or broad switchgear totals, while another tries to isolate only RMUs sold as new equipment.
The main gap comes from whether retrofit work, spare parts, and service revenues are included, and how medium-voltage coverage is defined, since some sources blend adjacent switchgear categories into one number. Some estimates also use a single global ASP curve without validating how insulation mix and regional tender pricing change over time, which can inflate or compress the total depending on the year chosen.
Benchmark comparison
| Source | Market Size | Gaps in Research Methodology |
|---|---|---|
| Mordor Intelligence | USD 3.08 B (2026) | |
| Industry Newswire A | USD 2.50 B (2024) | Uses an earlier base year and does not clearly separate new RMU equipment revenue from adjacent switchgear scope, which can shift totals when refurbishment activity is high. |
| Industry Data Publisher B | USD 1.77 B (2023) | Anchored to a historical base year with a different refresh cadence and mixed use of value and volume framing, which can understate current pricing and the recent SF6-free product transition. |
The spread mainly reflects scope and timing choices, rather than a single right or wrong number. The main gap comes from excluding retrofit panels, spare parts only sales, and after-sales service revenues, a scope choice applied by Mordor Intelligence so the value tracks new RMU equipment demand that can be tied back to grid build-out and replacement cycles.


Key Questions Answered in the Report
What is the current ring main unit market size and expected growth?
The ring main unit market size is USD 3.08 billion in 2026 and is projected to reach USD 4.26 billion by 2031, growing at a 6.72% CAGR.
Which dielectric technology is gaining share fastest?
Solid and other SF₆-free designs are forecast to expand at a 9.5% CAGR because of Europe’s F-Gas ban and voluntary North American adoption.
Why are indoor RMUs growing quicker than outdoor units?
Urban land prices and undergrounding mandates push utilities to choose compact indoor RMUs, which are expected to grow at 8.4% annually through 2031.
How are renewables influencing RMU demand?
Utility-scale solar, wind, and battery parks need medium-voltage collector circuits; this end-user bracket is the fastest growing at an 8.8% CAGR.
Which regions lead future RMU installations?
Asia-Pacific leads with 43.2% of 2025 revenue and maintains the highest regional CAGR of 8.4% driven by China and India’s grid modernization budgets.
Who are the key RMU suppliers today?
ABB, Schneider Electric, Siemens, Eaton, and Larsen & Toubro hold about 55% of global revenue, while CHINT and TGOOD are advancing in emerging markets.
Page last updated on:


 Your data is secure and never sold or shared.


