
Market Overview
| Study Period | 2019 - 2031 |
|---|---|
| Market Size (2026) | USD 266.28 Billion |
| Market Size (2031) | USD 513.77 Billion |
| Growth Rate (2026 - 2031) | 14.05 % |
| Fastest Growing Market | South America |
| Largest Market | Asia-Pacific |
| Market Concentration | Medium |
Major Players *Disclaimer: Major Players sorted in no particular order Image © Mordor Intelligence. Reuse requires attribution under CC BY 4.0. | |
Ride-Hailing Market Analysis by Mordor Intelligence
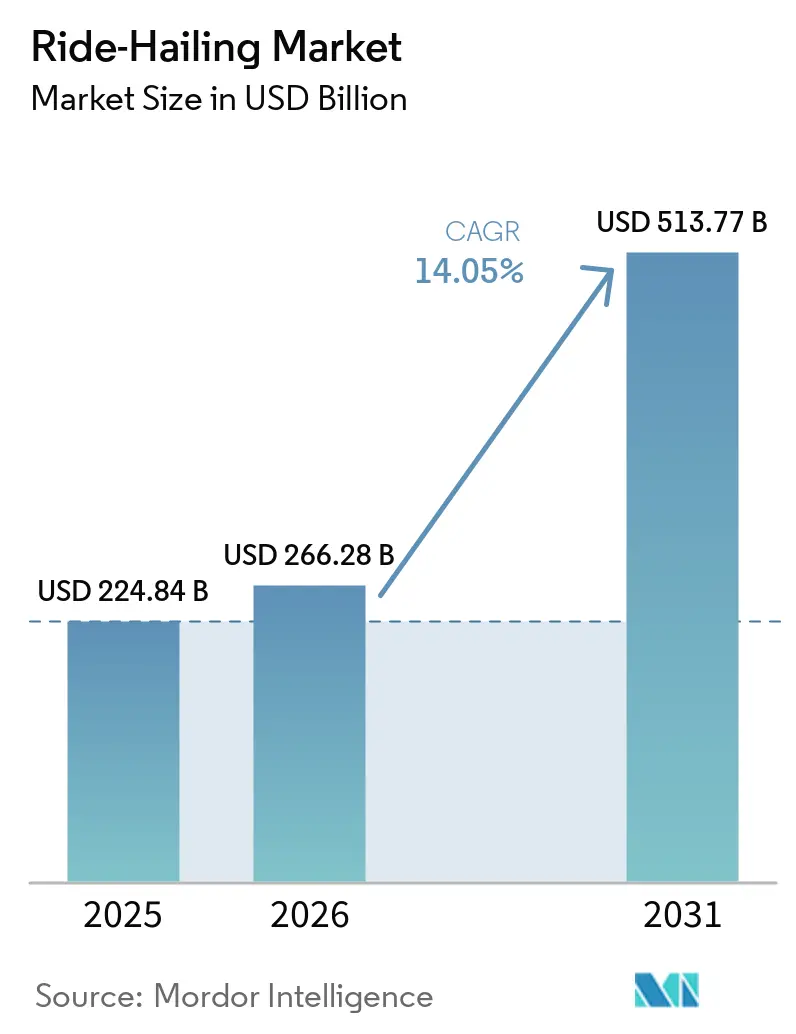
The Ride-Hailing Market size is expected to increase from USD 224.84 billion in 2025 to USD 266.28 billion in 2026 and reach USD 513.77 billion by 2031, growing at a CAGR of 14.05% over 2026-2031. Rising urban density, advances in autonomous driving, and supportive policy frameworks are accelerating platform adoption across developed and emerging economies. As congestion intensifies and consumers seek more flexible transportation options, shared mobility platforms are becoming increasingly relevant as practical alternatives to private vehicle ownership. Technology maturity enables operators to aggregate data, optimize routes, improve fleet utilization, and reduce empty-mile costs. At the same time, regulators in major cities increasingly encourage commuters to shift from private vehicle ownership to shared mobility. Corporate travel budgets that now favor ride vouchers and on-demand mobility options over company cars are further expanding the user base.
Key Report Takeaways
- By vehicle type, passenger cars captured 62.88% of ride-hailing market share in 2025, whereas two-wheelers led segment growth at a 16.54% CAGR through 2031.
- By propulsion type, internal-combustion engines retained 72.74% of the ride-hailing market in 2025, while battery-electric vehicles are tracking a 16.55% CAGR through 2031.
- By service type, e-hailing accounted for 73.62% of the ride-hailing market in 2025; robo-taxis are expanding fastest at a 16.60% CAGR.
- By booking channel, app-based transactions accounted for 87.21% of the ride-hailing market in 2025, with a 16.47% CAGR outlook, while voice and phone reservations remain niche.
- By end-user, personal riders contributed 61.12% of 2025 revenue, yet corporate accounts post the highest 16.36% CAGR through 2031 as mobility budgets replace fleet allowances.
- By geography, Asia-Pacific held a dominant 38.44% revenue share in 2025; South America is the fastest-growing region with a 16.43% CAGR, led by Brazil’s strong driver base.
Note: Market size and forecast figures in this report are generated using Mordor Intelligence’s proprietary estimation framework, updated with the latest available data and insights as of 2026.
Global Ride-Hailing Market Trends and Insights
Drivers Impact Analysis*
| Driver | (~) % Impact on CAGR Forecast | Geographic Relevance | Impact Timeline |
|---|---|---|---|
| Rising Traffic Congestion | +3.2% | Global, with highest impact in Asia-Pacific megacities | Long term (≥ 4 years) |
| Growing Smartphone Penetration | +2.8% | Emerging markets in South America, Africa, Southeast Asia | Medium term (2-4 years) |
| Fleet-Wide Electrification Mandates | +2.1% | North America, Europe, with spillover to Asia-Pacific | Medium term (2-4 years) |
| Subscription-Based Multimodal Super-Apps | +1.9% | Asia-Pacific core, expanding to global markets | Long term (≥ 4 years) |
| Employer-Funded Mobility Budgets | +1.6% | North America and EU, with early adoption in urban centers | Short term (≤ 2 years) |
| Early Integration With Urban-Air-Mobility Pilots | +1.1% | Select metropolitan areas globally | Long term (≥ 4 years) |
| Source: Mordor Intelligence | |||
Rising Traffic Congestion & Urban Population Growth
In megacities such as Jakarta and Manila, heavy peak-hour traffic makes private car use impractical, leading many commuters to choose ride-hailing services[1]“Urban Mobility in Developing Cities,” World Bank, worldbank.org . Platforms offset congestion’s drag on driver utilization by applying AI-based dispatch that predicts demand clusters and trims empty miles; Lyft now achieves sub-one-minute ETA accuracy in San Francisco using historical and live traffic feeds. Public agencies view integrated Mobility-as-a-Service ecosystems as a means of congestion relief. A World Bank study shows fragmentation cuts of up to two-fifths when Ride-hailing, transit, and micromobility are stitched together. The interplay of urban sprawl, limited parking, and growing environmental mandates creates a durable runway for expansion through 2030.
Growing Smartphone & Broadband Penetration
Rising handset adoption across Brazil, India, and Indonesia is opening new demographics for app-based booking and expanding the ride-hailing market user base. Brazil’s market is expected to grow exponentially by 2027, supported by Uber’s large driver fleet. Voice-enabled interfaces are strengthening inclusivity; for example, Grab's AI assistant can understand local accents and help visually impaired and elderly users book on-demand rides independently. Broader 4G coverage in peri-urban areas further improves pickup reliability and narrows the service gap between core and fringe districts.
Fleet-Wide Electrification Mandates By TNCS
Inspired by California's Clean Miles Standard, which mandates that ride-hailing firms boost electric vehicle usage by the decade's end, regions such as British Columbia, Paris, and Seoul are pursuing similar initiatives [2] “Clean Miles Standard,” California Air Resources Board, california.gov . Uber’s supply-side push with BYD could introduce 100,000 EVs in Europe and Latin America, buttressed by an OpenAI-powered driver assistant that steers partners toward optimal charging hubs. New York City, ahead of schedule, marked a significant milestone in its sustainability journey by achieving a notable number of zero-emission rides, underscoring its commitment to clean transportation after Gravity Mobility installed chargers capable of delivering 2,400 mi/h. These milestones illustrate how regulation, OEM alliances, and infrastructure scale align to shrink tailpipe emissions without curbing trip volume.
Subscription-Based Multimodal Super-Apps Boost Stickiness
Grab’s super-app model converts single-service users into multi-product customers, who spend three times the average basket value and increase lifetime value in the ride-hailing market. The company strengthens customer loyalty across diverse sectors by integrating meal delivery, digital payments, and insurance services. It holds a leading position in Southeast Asia’s mobility and food delivery markets. Public-private MaaS pilots in Vienna and the Netherlands follow a similar model by integrating ride-hailing with public transit and shared bikes under unified billing. Higher switching costs and embedded fintech services further support customer retention across income cohorts.
Restraints Impact Analysis*
| Restraint | (~) % Impact on CAGR Forecast | Geographic Relevance | Impact Timeline |
|---|---|---|---|
| Strict and Fragmented Regulatory Frameworks | -2.4% | Global, with highest impact in Europe and emerging markets | Medium term (2-4 years) |
| Data-Privacy Concerns | -1.8% | Europe, North America, with spillover globally | Short term (≤ 2 years) |
| Rising Gig-Driver Insurance Premiums | -1.5% | North America core, expanding to regulated markets | Short term (≤ 2 years) |
| Persistent Profitability Gaps | -1.2% | Global, with focus on emerging market operations | Medium term (2-4 years) |
| Source: Mordor Intelligence | |||
Strict & Fragmented Regulatory Frameworks
The European Commission’s review of ride-sharing regulations highlights divergent city-level mandates on vehicle licensing, idle-time limits, and driver benefits. Spain capped new licenses based on pollution quotas, while Malaysia revoked inDrive’s permit due to compliance lapses, underscoring policy heterogeneity. Localized taxes, such as North Carolina’s levy on exclusive rides, effective July 2025, further increase operating complexity.
Data-Privacy or Cyber-Security Concerns
GDPR’s stringent consent and data localization clauses require operators to store and process rider telemetry within the bloc, increasing compliance costs. Cyber events, such as the 2024 credential-stuffing attack on a leading platform, caused brief service outages across multiple U.S. metros and highlighted cybersecurity as an operational risk. Enhanced encryption protocols and third-party penetration testing increase costs, but they remain essential for maintaining consumer trust in a data-rich ride-hailing market ecosystem.
*Our forecasts treat driver/restraint impacts as directional, not additive. The impact forecasts reflect baseline growth, mix effects, and variable interactions.
Segment Analysis
By Vehicle Type: Passenger Cars Dominate Amid Diversification
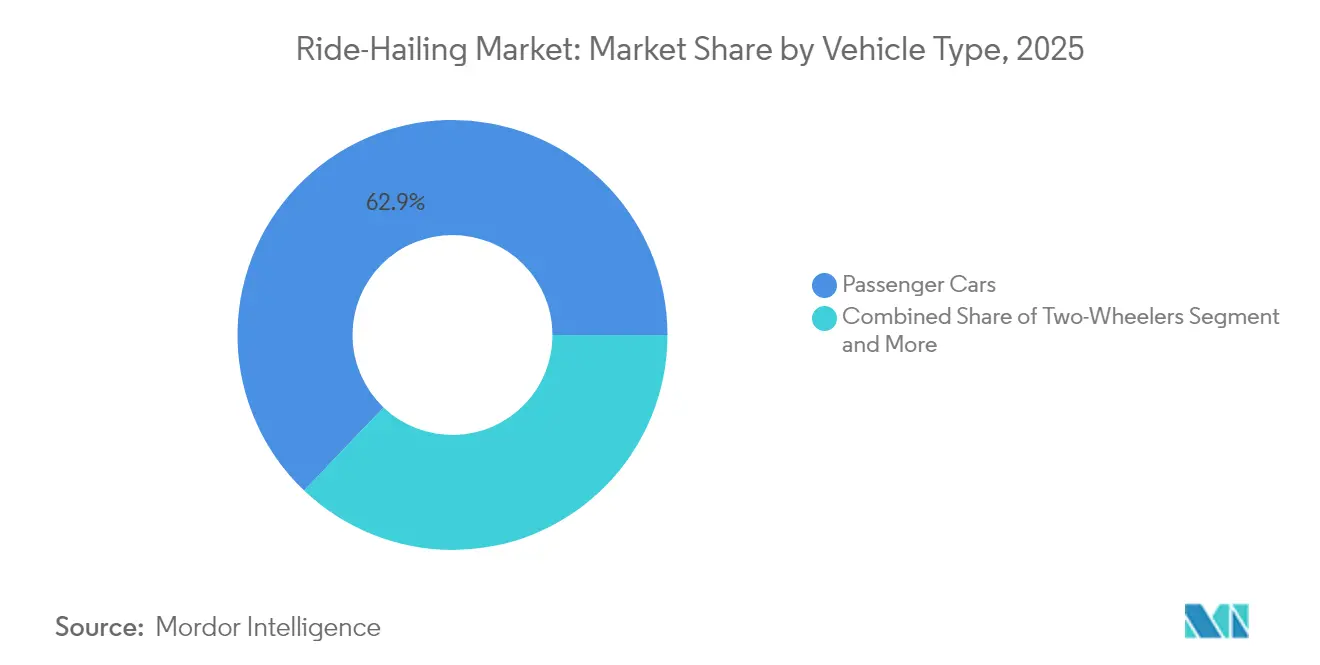
Passenger cars accounted for 62.88% of the ride-hailing market share in 2025, anchoring revenue while driving a 16.54% segment CAGR through 2031 as automakers release ride-ready trims at fleet pricing. Two-wheelers and three-wheelers are gaining traction in congestion-prone cities. India’s Rapido now serves a large customer base and an extensive rider network, highlighting how motorcycles address micro-trip demand. Vans and MPVs strengthen corporate shuttle contracts, particularly where employer mobility budgets support recurring pick-ups. The Indian bike-taxi opportunity, forecast to record exponential growth over the coming years, demonstrates diversification, although regulatory bans in Delhi and Maharashtra highlight compliance risks. Urban logistics add-ons, such as small parcel delivery during rider off-hours, further monetize vehicle time. This makes passenger cars a resilient core segment, while niche modalities reduce market saturation risks.
The segment’s expansion also supports fleet electrification, as OEMs prioritize battery platforms for high-volume passenger models. As EV prices decline, operators secure bulk leases for range-optimized sedans, reducing maintenance costs and improving driver earnings. The ride-hailing market uses telematics to ring-fence high-utilization sub-fleets, enabling asset-light operators to control service quality without owning vehicles. Passenger cars maintain leadership in both market share and growth, reinforcing their long-term primacy even as two-wheelers and robo-van concepts develop specialized use cases.


By Propulsion Type: Electric Transition Accelerates Despite ICE Dominance
Internal-combustion powertrains still command 72.74% of the ride-hailing market size in 2025, reflecting legacy vehicle pools. Yet battery-electric rides accelerate at 16.55% CAGR on the back of regulatory sticks and charging carrots. California’s 90% electric-mile rule for 2030 compels platforms to amass EV fleets, while NYC’s Gravity Mobility hubs provide 2,400 mi/h turnaround, minimizing downtime. Hybrid models bridge infrastructure gaps in markets where DC fast-chargers remain scarce, and CNG/LPG fleets sustain relevance in South Asia due to abundant supply chains. Uber’s plan to deploy 100,000 BYD EVs across Europe and Latin America signals a near-term volume spike, supported by app-based driver incentives that offset higher lease rates.
Brazil’s consumer survey showed stable ride-hail usage despite concerns about upfront EV prices, indicating that cost parity is not a binary prerequisite for mass adoption when platform-level subsidies close TCO gaps. Predictive dispatch shortens queue times for battery vehicles, mitigating range anxiety. As renewable energy penetration grows, the emissions advantage of EV fleets widens, feeding back into corporate sustainability reporting and generating a pull from enterprise riders.
By Service Type: E-Hailing Leadership Challenged by Robo-Taxi Innovation
E-hailing retained 73.62% of 2025 revenue, but robo-taxis posted a 16.60% CAGR, hinting at an inflection beyond manual driver models. Waymo logs more than 100,000 rides weekly across multiple U.S. cities and has been embedded in Uber’s interface, letting users toggle between human and autonomous cars. Car-sharing and peer-to-peer rentals meet asset-light travelers' needs yet remain marginal. Subscription ride bundles emerge through corporate plans, locking recurring volume at predictable margins.
Uber’s USD-hundreds-of-millions stake in Lucid-Nuro will introduce 20,000 autonomous SUVs within six years, affirming a multimodal future rather than a binary human-versus-robot substitution. Wuhan regulators approve the large-scale rollout of driverless vehicles, highlighting confidence in the technology's readiness. While commercial rollout remains city-specific, learnings on rider trust, remote-assist protocols, and mapping will diffuse quickly, compressing lead times for the broader ride-hailing market.
By Booking Channel: App-Based Dominance Reinforces Digital Transformation
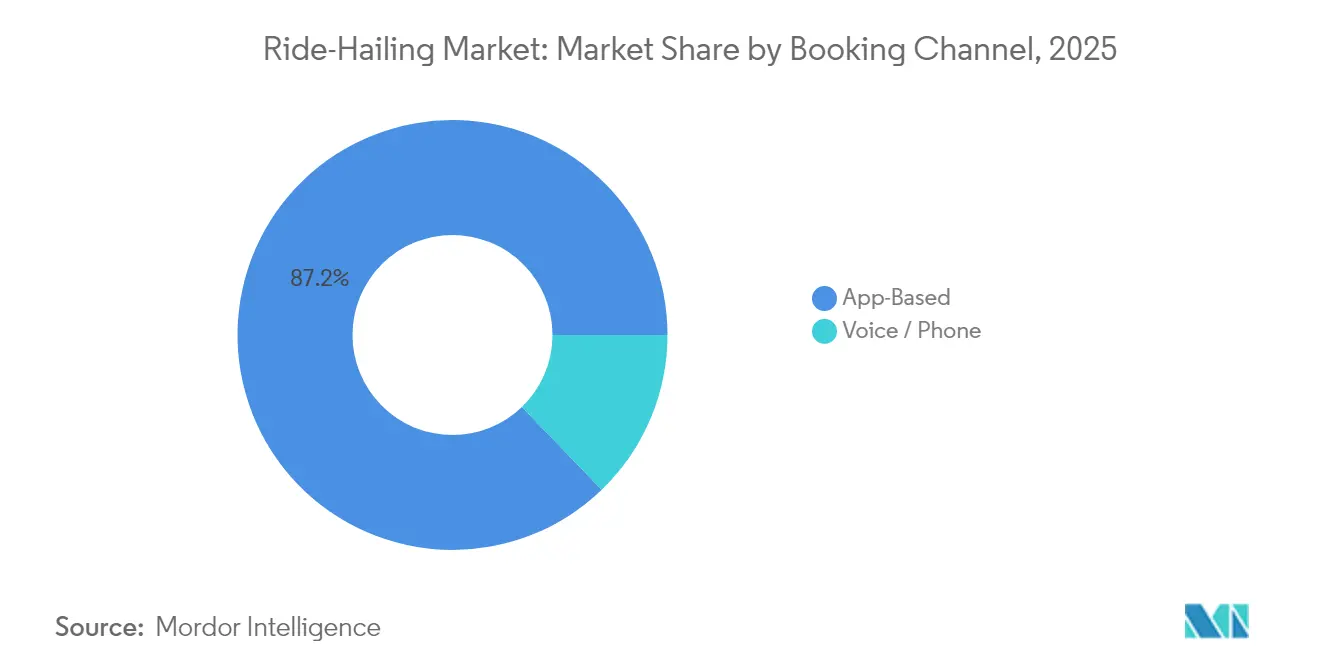
App-based orders accounted for 87.21% of 2025 bookings and sustain a 16.47% CAGR, mirroring the ubiquity of smartphones in target demographics. In-app algorithms predict fares, suggest pickup spots, and integrate digital wallets, streamlining the customer journey. Voice and phone lines linger for seniors or in patchy-coverage zones, serving as redundancy rather than primary channels. Grab’s speech interface achieves more than four-fifth accent accuracy, blending accessibility with mainstream functionality. Future iterations may leverage generative AI to parse real-time rider intent, suggesting multimodal itineraries that combine ride-hail with transit or e-scooters.
Importantly, channel dominance does not foreclose inclusivity; WhatsApp-based ordering pilots in India extend reach to users with limited data plans. Across emerging economies, operator chatbots handle trip status and dispute resolution, shrinking support overhead. The stickiness of app ecosystems underpins the ride-hailing market’s recurring-revenue logic and cross-sell pathways.
By End-User: Corporate Adoption Accelerates Amid Personal Market Maturity
Personal riders still produce 61.12% of turnover, yet corporate accounts post the highest 16.36% CAGR as business travel resumes and ESG reporting tightens. Mobility budgets rebundle transport spending into a unified wallet, letting employees claim ride-hail receipts without paper clutter.
Sustainability directives nudge corporations to log Scope 3 emissions, and Ride-hailing APIs feed granular trip data into carbon dashboards. Tiered loyalty programs reward frequent business riders with upgrades and lower surge multipliers, differentiating service levels. Meanwhile, personal user growth in mature cities plateaus, steering operator focus toward high-margin enterprise segments where predictable peak-hour demand improves fleet utilization and driver earnings.
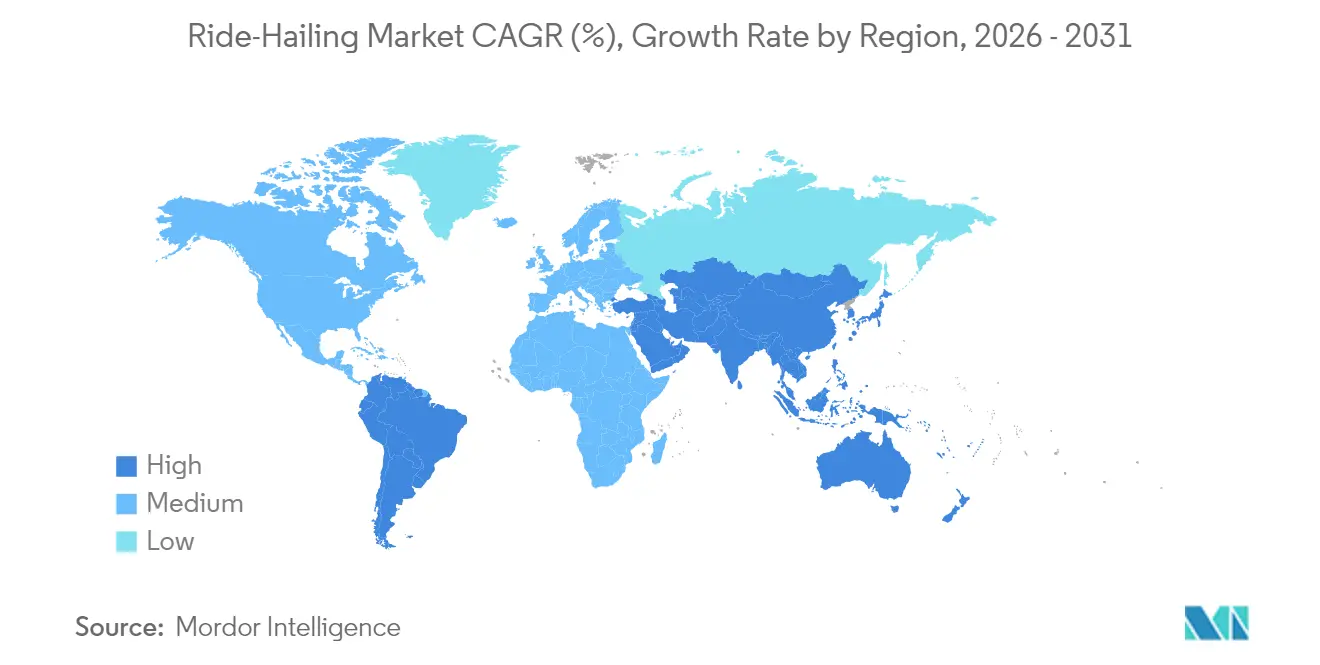
Geography Analysis
Asia-Pacific accounted for 38.44% of the ride-hailing market in 2025. China, propelled by its dense urban landscapes, widespread smartphone penetration, and favorable mobility policies, is at the forefront of the autonomous vehicle revolution. Baidu's Apollo Go has deployed a significant fleet of driverless cars across various cities, racking up millions of completed rides. In India, two-wheelers, particularly through platforms like Rapido, are the go-to choice for commuters looking to sidestep long traffic jams without breaking the bank. In Southeast Asia, the patchwork nature of public transit is spurring the rise of super-apps, with companies such as Grab leading the charge in ride-booking. Its proposed merger with GoTo could forge a dominant regional entity.
South America is the velocity leader with a 16.43% CAGR through 2031, anchored by Brazil, where Uber’s drivers form the company’s largest national fleet. Regional revenue grew exponentially by 2027, buoyed by rapid urbanization and cultural comfort with shared rides. Argentina and Colombia show early signs of regulatory openness, while UBS polling records stable rider loyalty despite inflationary stress. Platforms tailor low-bandwidth app versions to tap prepaid-phone segments, sustaining double-digit trip growth.
North America remains a technology crucible. Waymo’s extensive autonomous vehicle trips, along with California’s strong push for electric vehicles, are setting key benchmarks that shape global standards for sustainable and intelligent mobility. New York City’s rapid adoption of electric vehicle rides highlights the critical role of robust infrastructure, including fast-charging corridors, in advancing greener urban transport. Europe continues to address regulatory harmonization, as the European Commission’s review aims to align taxi and ride-share licensing and potentially enable pan-EU scaling.

Competitive Landscape
Oligopolistic dynamics define the ride-hailing market, with Uber, Didi, and Grab carving regional strongholds rather than any single player commanding monopoly power. In 2024, Uber's robust financial results are driving significant investments in cutting-edge technologies, notably a substantial investment in robo-taxis through collaborations such as Lucid-Nuro. Grab, reigning as a super-app, fosters strong customer loyalty across its services. Its prospective merger with GoTo promises to consolidate hundreds of millions of users, potentially establishing a formidable regional powerhouse in Southeast Asia. On another front, Lyft's takeover of FREENOW marks a notable expansion into Europe, hinting that such consolidations might be a tactical maneuver against the rising tide of autonomous mobility.
AI differentiation eclipses basic ride-matching. Uber’s GPT-4o-powered driver assistant answers EV transition queries, while Lyft’s predictive ETA engine trims idle minutes, boosting driver earnings. Niche services gain traction as white-space plays: Grab’s voice interface for visually impaired riders and Lyft’s Silver segment for older adults illustrate demographic specialization. OEM alliances are tightening, as evidenced by the Uber-BYD and Didi-SAIC tie-ups, securing preferential vehicle supply amid chip shortages.
Market entry barriers rise through data scale, regulatory expertise, and capital needs. Yet regional newcomers still surface in protected markets such as Iran and Nigeria. Ultimately, the top five operators control about three-fifths of global gross bookings, a level signaling healthy competition without fragmenting network effects.
Ride-Hailing Industry Leaders
Uber Technologies, Inc.
Lyft, Inc.
Grab Holdings Inc.
Bolt Technology OÜ
SUOL Innovations Ltd (inDrive)
- *Disclaimer: Major Players sorted in no particular order


Recent Industry Developments
- July 2025: Uber signs a global deal with Baidu to launch thousands of Apollo Go autonomous cars on the Uber network outside mainland China, first in select Asian and Middle Eastern cities.
- July 2025: Lyft completes the EUR 175 million acquisition of FREENOW, gaining coverage in 180 European cities and extending addressable trips to 300 billion annually.
- July 2025: Uber invests hundreds of millions in Lucid and Nuro to roll out more than 20,000 robotaxis over six years, each based on the Lucid Gravity SUV running Nuro’s self-drive stack.


Global Ride-Hailing Market Report Scope
A ride-hailing service refers to ridesharing services that, via website and mobile applications, match passengers with drivers of vehicles for hire that, unlike taxicabs, cannot be legally hailed from the street.
The ride-hailing market is segmented by vehicle type, propulsion type, and geography. By vehicle type, the market is segmented into motorcycles, cars, vans, and buses. By propulsion type, the market is segmented into internal combustion engine (ICE) and electric. By geography, the market is segmented into North America, Europe, Asia-Pacific, and Rest of the World. For each segment, the market size and forecast are provided in terms of value (USD).
By Vehicle Type
| Two-Wheelers |
| Three-Wheelers |
| Passenger Cars |
| Vans & MPVs |
| Buses & Shuttles |
By Propulsion Type
| ICE |
| Hybrid |
| Battery-Electric |
| CNG / LPG |
By Service Type
| E-Hailing |
| Car-Sharing (Peer-to-Peer) |
| Robo-Taxi |
| Subscription-Based Ride Packages |
By Booking Channel
| App-Based |
| Voice / Phone |
By End-User
| Personal |
| Corporate / Institutional |
By Geography
| North America | United States |
| Canada | |
| Rest of North America | |
| South America | Brazil |
| Argentina | |
| Rest of South America | |
| Europe | Germany |
| United Kingdom | |
| France | |
| Italy | |
| Russia | |
| Spain | |
| Rest of Europe | |
| Asia-Pacific | China |
| India | |
| Japan | |
| South Korea | |
| Rest of Asia-Pacific | |
| Middle East and Africa | United Arab Emirates |
| Saudi Arabia | |
| Turkey | |
| Egypt | |
| South Africa | |
| Rest of Middle East and Africa |
| By Vehicle Type | Two-Wheelers | |
| Three-Wheelers | ||
| Passenger Cars | ||
| Vans & MPVs | ||
| Buses & Shuttles | ||
| By Propulsion Type | ICE | |
| Hybrid | ||
| Battery-Electric | ||
| CNG / LPG | ||
| By Service Type | E-Hailing | |
| Car-Sharing (Peer-to-Peer) | ||
| Robo-Taxi | ||
| Subscription-Based Ride Packages | ||
| By Booking Channel | App-Based | |
| Voice / Phone | ||
| By End-User | Personal | |
| Corporate / Institutional | ||
| By Geography | North America | United States |
| Canada | ||
| Rest of North America | ||
| South America | Brazil | |
| Argentina | ||
| Rest of South America | ||
| Europe | Germany | |
| United Kingdom | ||
| France | ||
| Italy | ||
| Russia | ||
| Spain | ||
| Rest of Europe | ||
| Asia-Pacific | China | |
| India | ||
| Japan | ||
| South Korea | ||
| Rest of Asia-Pacific | ||
| Middle East and Africa | United Arab Emirates | |
| Saudi Arabia | ||
| Turkey | ||
| Egypt | ||
| South Africa | ||
| Rest of Middle East and Africa | ||


Key Questions Answered in the Report
How big is the Ride-Hailing Market in 2026?
The Ride-Hailing Market size is expected to increase from USD 224.84 billion in 2025 to USD 266.28 billion in 2026 and reach USD 513.77 billion by 2031, growing at a CAGR of 14.05% over 2026-2031.
Which region grows fastest through 2031?
South America posts the highest 16.43% CAGR, led by Brazil’s strong driver network.
What share do electric rides hold nowadays?
Battery-electric trips are a minority but expanding fastest, with EV miles mandated to reach 90% in California by 2030.
Who leads autonomous deployments?
Waymo has surpassed 100,000 weekly rides, and Uber plans 20,000 Lucid-Nuro robotaxis, signaling leadership in commercial scale.
Why are corporate accounts important?
Employer-funded mobility budgets are rising at a 16.36% CAGR, offering higher margins and reliable demand compared with personal riders.
Page last updated on:


 Your data is secure and never sold or shared.


