
Rice Syrup Market Size and Share
Market Overview
| Study Period | 2021 - 2031 |
|---|---|
| Market Size (2026) | USD 2.16 Billion |
| Market Size (2031) | USD 2.93 Billion |
| Growth Rate (2026 - 2031) | 6.29 % |
| Fastest Growing Market | North America |
| Largest Market | Europe |
| Market Concentration | Medium |
Major Players *Disclaimer: Major Players sorted in no particular order Image © Mordor Intelligence. Reuse requires attribution under CC BY 4.0. | |
Rice Syrup Market Analysis by Mordor Intelligence
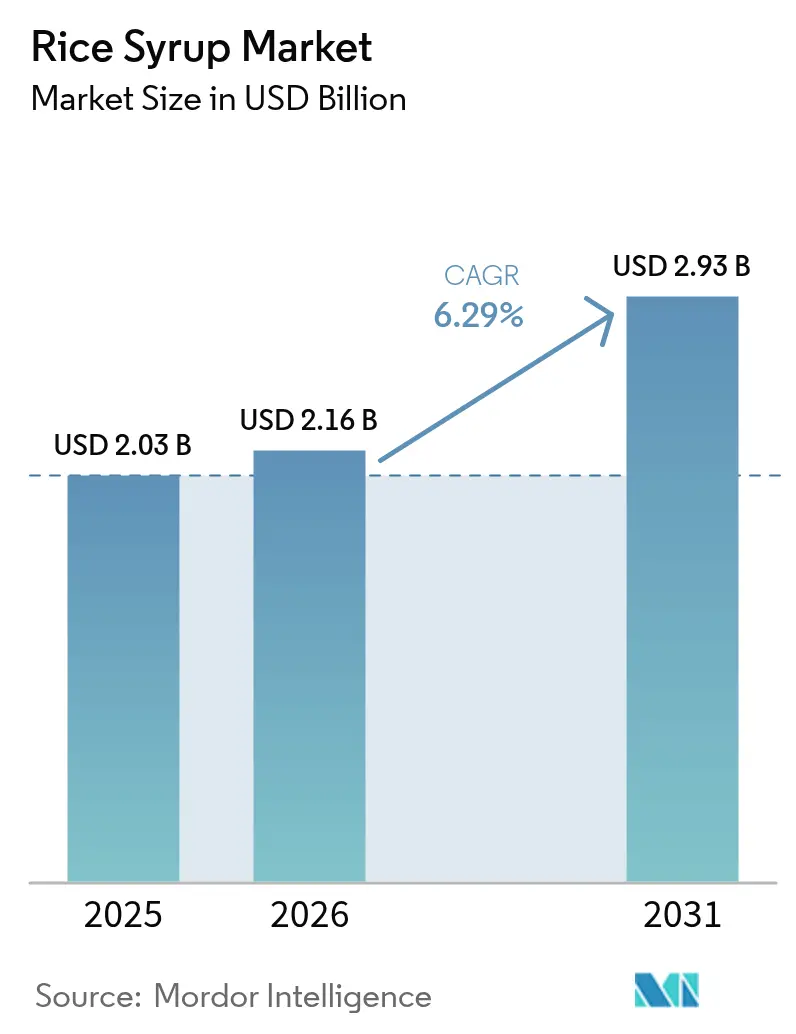
The rice syrup market size is expected to grow from USD 2.03 billion in 2025 to USD 2.16 billion in 2026 and is forecast to reach USD 2.93 billion by 2031 at 6.29% CAGR over 2026-2031. Rising regulatory scrutiny of synthetic sweeteners, stronger clean-label rules, and consumer preference for ingredients perceived as natural are widening the addressable base for rice-derived sweeteners in beverages, baked goods, infant nutrition, and plant-based dairy. Europe remains the largest regional demand center, reflecting the region’s tight additive regulations and premium organic consumption, while North America is recording the fastest growth as reform of the Food and Drug Administration (FDA) definitions for “healthy” claims pushes formulators toward non-artificial options. Brown rice syrup continues to dominate formulation share because its bran layer delivers trace minerals, antioxidants, and a lower glycemic response than corn-based syrups. The conventional category commands volume leadership due to cost advantages, yet certified-organic variants are scaling rapidly after the United States Department of Agriculture (USDA)’s Strengthening Organic Enforcement rule added digital traceability for imported organic inputs. Supply-side inflation persists amid volatile paddy prices, but advances in non-thermal bran stabilization and high-efficiency enzyme hydrolysis are trimming conversion losses and improving solids yield, thereby softening raw-material risk for processors.
Key Report Takeaways
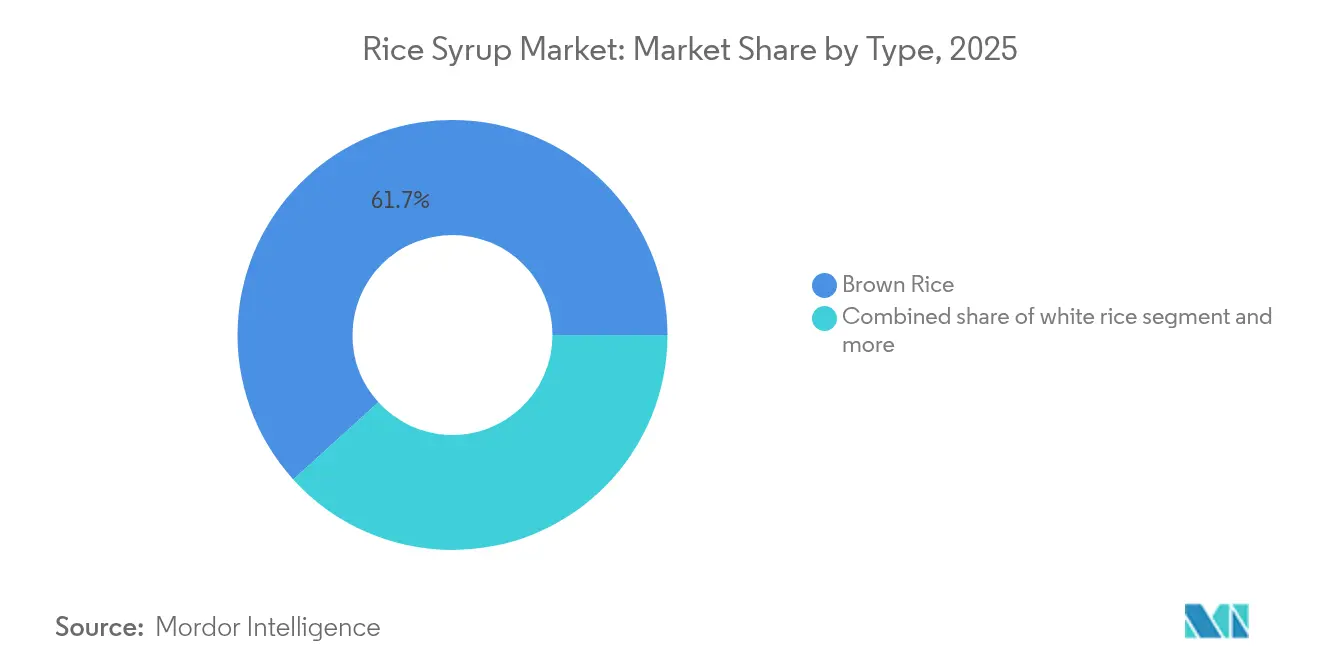
- By rice type, brown rice held 61.72% of the rice syrup market share in 2025; brown rice is projected to post the quickest segment CAGR of 8.45% through 2031.
- By category, the conventional segment led with 56.58% revenue share in 2025, while organic variants are forecast to expand at 7.08% CAGR between 2026-2031.
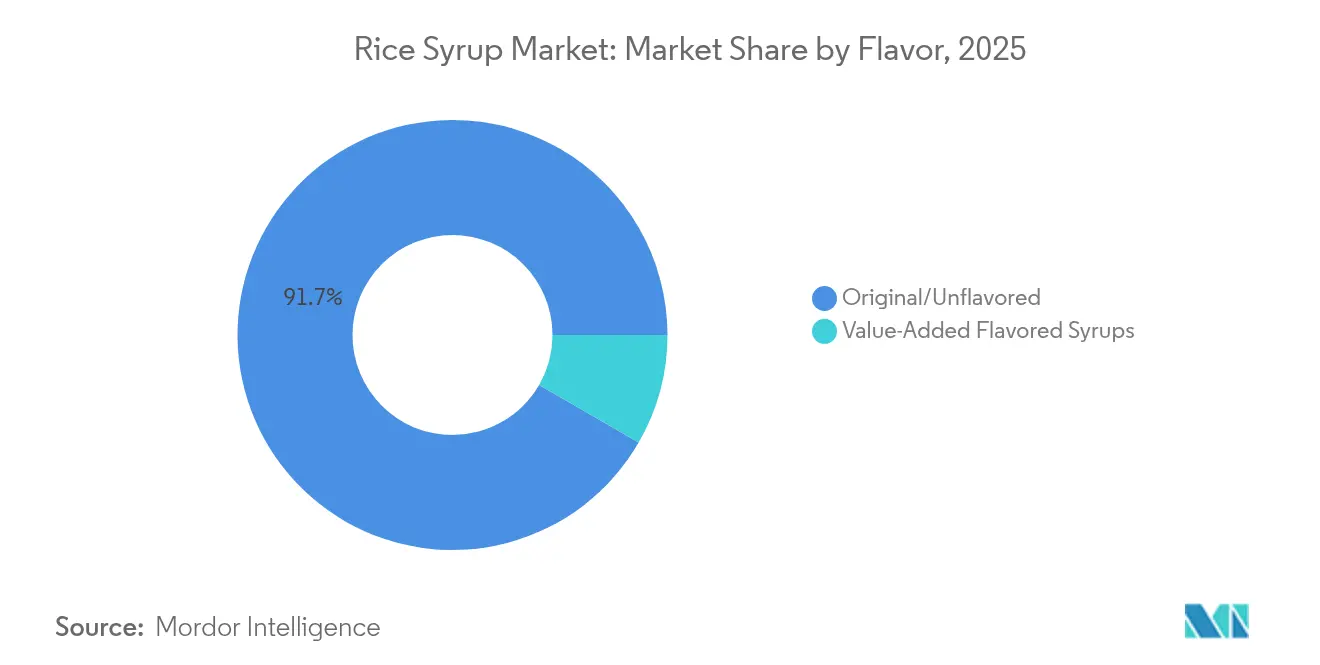
- By flavor, original/unflavored formulations accounted for 91.66% of the rice syrup market size in 2025; value-added flavored syrups will register an 8.01% CAGR to 2031.
- By application, bakery and confectionery represented 37.86% of the rice syrup market size in 2025; infant formula and baby foods are expected to grow at 7.02% CAGR through 2031.
- By geography, Europe dominated with 34.12% value share in 2025; North America is projected to post the highest regional CAGR of 8.21% up to 2031.
Note: Market size and forecast figures in this report are generated using Mordor Intelligence’s proprietary estimation framework, updated with the latest available data and insights as of 2026.
Market Trends and Insights
Drivers Impact Analysis of Rice Syrup Market*
| Driver | (~) % Impact on CAGR Forecast | Geographic Relevance | Impact Timeline |
|---|---|---|---|
| Rising demand for natural sweeteners in beverage formulations | +1.8% | Global, with concentration in North America and Europe | Medium term (2-4 years) |
| Increasing use in organic baby food products worldwide | +1.2% | North America and Europe core, spill-over to Asia-Pacific | Long term (≥ 4 years) |
| Expanding demand for allergen-free sweeteners | +1.40% | Global, particularly strong in developed markets | Short term (≤ 2 years) |
| Growth in plant-based dairy alternatives using rice syrup | +0.9% | North America and Europe, emerging in Asia-Pacific | Medium term (2-4 years) |
| Wide application in clean-label baked goods and snacks | +1.1% | Global | Short term (≤ 2 years) |
| Rising use in confectionery as a non-GMO sweetening solution | +0.8% | Global, with premium segment focus | Medium term (2-4 years) |
| Source: Mordor Intelligence | |||
Rising Demand for Natural Sweeteners in Beverage Formulations
Brand owners are reformulating ready-to-drink teas, flavored waters, and functional beverages ahead of the 2025 Food and Drug Administration (FDA) “healthy” claim overhaul that lowers added-sugar thresholds, prompting substitution of high-fructose corn syrup with enzymatically produced rice syrup[1]. Germany, France, and the United Kingdom collectively raised imports of HS 1702.30 rice-based sweeteners from USD 631 million in 2022 to USD 677 million in 2023, underscoring momentum in craft beverage channels according to CBI (Centre for the Promotion of Imports from developing countries)[2]. Cargill's SimPure soluble rice flour, honored with a 2023 Edison Award, illustrates how ingredient suppliers are offering one-for-one maltodextrin replacements that carry a clean-label halo. The neutral flavor of rice syrup enables formulators to achieve consistent sweetness without masking botanicals, and its relatively high dextrose-equivalent range supports rapid fermentability in low-alcohol applications. The growing consumer preference for natural and clean-label ingredients has positioned rice syrup as a preferred alternative in beverage formulations. Additionally, the versatility of rice syrup in various applications, from sports drinks to kombucha, has expanded its market potential across different beverage categories.
Increasing Use in Organic Baby Food Products Worldwide
Parents prioritizing traceable ingredient origins are gravitating to baby purées and infant cereals sweetened with rice syrup that comply with United States Department of Agriculture (USDA) organic and European Union Regulation 2023/476 standards [3]. Electronic NOP import certificates introduced in March 2024 raised entry barriers for synthetic or ambiguously sourced sweeteners, concentrating share among certified rice syrup suppliers with transparent chain-of-custody documentation. Food and Drug Administration (FDA) rules under 21 CFR 106 require formula makers to validate carbohydrate quality and allergen control, and rice syrup's single-crop provenance simplifies compliance auditing. WIC nutrition-package revisions that emphasize culturally relevant produce and flexible sweetening sources further underpin demand for organic, hypoallergenic sugars in early-childhood SKUs. The implementation of these stringent regulations has led to increased adoption of rice syrup in infant formula manufacturing, particularly in developed markets. Additionally, the growing consumer preference for clean-label products has strengthened rice syrup's position as a natural sweetening alternative in the food and beverage industry.
Expanding Demand for Allergen-Free Sweeteners
Under European Union Regulation (EU) 2024/1033, the expansion of eight-allergen labeling has intensified manufacturers' focus on gluten-free carbohydrates. This shift positions rice syrup as a compliant solution for multiple allergens. In June 2025, Axiom Foods clinched the inaugural Food and Drug Administration (FDA) Generally Recognized as Safe (GRAS) notice for rice protein (GRN 1073), bolstering trust in rice-derived macronutrients. This move also paves the way for syrup variants in medical nutrition. Healthcare providers and K-12 foodservice operators are ramping up rice syrup usage, especially where avoiding cross-contamination with soy, dairy, or wheat is crucial. These regulatory nods have spurred food manufacturers to adopt rice syrup as a primary sweetener in their reformulations. Furthermore, heightened consumer awareness about allergen-free products has unveiled fresh avenues for rice syrup in niche dietary markets. The adaptability of rice syrup due to clean-label appeal is viable, across food applications, from beverages to confections, underscores rice syrup's burgeoning potential in diverse industry segments. The increasing demand for plant-based and vegan-friendly ingredients further supports the growth of rice syrup in the food industry. Additionally, the rising trend of clean eating and transparency in food labeling has amplified the preference for rice syrup as a natural sweetener.
Growth in Plant-Based Dairy Alternatives Using Rice Syrup
Oat, almond, and pea-based "milks" leverage rice syrup for balanced sweetness and mouthfeel that supports foam stability in barista formats. Cargill invested EUR 38 million in soluble-fiber lines that help brand owners meet 30% sugar-reduction targets while maintaining label simplicity, pairing fibers with low-DE rice syrup for bulking. USDA organic processing rules under 7 CFR 205.270 accept enzymatic hydrolysis, allowing certified-organic rice syrup to serve as the primary carbohydrate in dairy-free yogurt bases. The versatility of rice syrup in plant-based applications has led manufacturers to increase their production capacity to meet rising demand. Food manufacturers are increasingly incorporating rice syrup as a natural sweetener alternative in response to consumer preferences for clean-label products. The compatibility of rice syrup with organic certification requirements has positioned it as a preferred ingredient in the expanding organic food segment.
Restraints Impact Analysis of Rice Syrup Market*
| Restraint | (~) % Impact on CAGR Forecast | Geographic Relevance | Impact Timeline |
|---|---|---|---|
| Intense competition from other natural sweeteners | -1.3% | Global, particularly in price-sensitive segments | Short term (≤ 2 years) |
| Higher production costs compared to synthetic sweeteners | -0.9% | Global, with greater impact in developing markets | Medium term (2-4 years) |
| Vulnerability to rice price fluctuations in global markets | -0.9% | Global, with acute impact in Asia-Pacific rice-dependent regions | Short term (≤ 2 years) |
| Limited sweetness compared to high fructose corn syrup | -0.8% | Global, most pronounced in cost-sensitive beverage applications | Medium term (2-4 years) |
| Source: Mordor Intelligence | |||
Intense Competition from Other Natural Sweeteners
The rice syrup market faces growing constraints due to competition from various natural sweeteners, as manufacturers and end-users seek affordable ingredients that align with consumer preferences. Tate & Lyle completed its USD 1.8 billion acquisition of CP Kelco in June 2024, augmenting its stevia, allulose, and pectin capabilities and escalating price-performance pressure on rice syrup solutions. AGRANA simultaneously expanded isoglucose capacity in Europe, enabling customers to switch to lower-cost glucose syrups where the functional contribution of rice syrup is marginal. These moves are eroding negotiating leverage for smaller rice syrup specialists that cannot match the bundled ingredient portfolios of diversified sweetener suppliers. The consolidation trend has intensified competition in the rice syrup segment, particularly affecting regional manufacturers with limited product portfolios. Market participants are increasingly focusing on developing specialized rice syrup formulations to maintain their competitive edge. The shifting landscape has prompted rice syrup manufacturers to explore strategic partnerships and value-added product development to sustain their market position. The emergence of alternative sweeteners and increasing price sensitivity among end-users has further challenged rice syrup manufacturers' market share. Small and medium-sized rice syrup producers face mounting pressure to differentiate their offerings through unique formulations and applications. Regional players are experiencing margin compression due to the expanding presence of global sweetener manufacturers in local markets.
Higher Production Costs Compared to Synthetic Sweeteners
The production costs of rice syrup remain higher than synthetic sweeteners due to raw material price fluctuations, complex processing requirements, and supply chain challenges, affecting its market competitiveness. A January 2024 El Niño-linked supply squeeze lifted Japanese rice prices by 80%, forcing Tokyo to release emergency stocks and demonstrating the volatility embedded in agricultural feedstocks. Rabobank projects stocks-to-use ratios for the global rice balance sheet to keep tightening through 2033/34, underscoring persistent cost pressure for syrup processors reliant on imported paddy. Synthetic corn syrups, derived from relatively abundant U.S. dent corn, continue to undercut rice syrup on delivered-solids cost, a gap that widens in freight-inflated emerging markets. The increasing frequency of extreme weather events threatens rice cultivation patterns and yield stability across major producing regions. Limited processing capacity and specialized equipment requirements create barriers to entry for new manufacturers in the rice syrup segment. Regional trade restrictions and protectionist policies further compound supply chain uncertainties for international rice syrup producers.
*Our forecasts treat driver/restraint impacts as directional, not additive. The impact forecasts reflect baseline growth, mix effects, and variable interactions.
Rice Syrup Market Segment Analysis
By Rice Type:
Brown Rice Dominance Drives Premium PositioningBrown rice syrup accounted for 61.72% of 2025 volume as bakers and infant-food formulators embraced its intact bran-layer micronutrient profile. The high nutritional content and natural composition make it particularly appealing for health-conscious consumers seeking clean-label alternatives. That breakthrough allows producers to extend storage life and press toward cost parity with white rice while preserving flavor neutrality. White rice syrup remains a mainstay in legacy confectionery lines due to mature supply chains and lower unit costs but trails in growth because marketing teams prioritize the more "whole-grain" proposition of brown variants. The established processing infrastructure and economies of scale continue to make white rice syrup an economically viable option for traditional applications. Specialty pigmented cultivars such as black and red rice are beginning to seed hyper-niche launches in sports gels and antioxidant-rich spreads, yet their cumulative share of the rice syrup market is below 2% in 2025. These specialty variants command premium pricing due to limited availability and specialized processing requirements.
In the forward window, projected 8.45% CAGR for brown rice reflects alignment with wellness framing in developed markets and extended-shelf-life wins in emerging ASEAN bakeries adopting clean-label dough conditioners. The growing consumer preference for natural ingredients has accelerated the adoption of brown rice syrup in premium food applications. Producers are broadening raw-material origination to Vietnam and Thailand where mechanized harvesting is lowering foreign-matter counts and moisture variability. The implementation of advanced harvesting technologies has significantly improved quality consistency and reduced processing costs. This diversification reduces overdependence on Japanese and Korean crop cycles that historically dictated spot-price spikes. The expanded sourcing network has enhanced supply chain resilience and stabilized pricing throughout the year.

By Category:
Organic Growth Accelerates Despite Conventional LeadershipThe conventional stream delivered 56.58% of 2025 global volume but ceded incremental share to certified-organic syrups that earned a 7.08% forecast CAGR after the United States Department of Agriculture (USDA)'s March 2024 digital traceability directive strengthened label integrity. The shift towards organic certification has reshaped market dynamics, particularly in developed regions where regulatory compliance is stringent. Consumer awareness regarding food safety and clean-label products has further accelerated this transition. Organic up-trading is particularly evident in baby foods and premium granola clusters, where consumers tolerate 20-30 bps price lifts for pesticide-free claims. The demand for organic variants in these premium segments continues to grow as manufacturers emphasize health and wellness positioning. While organic rice trades at premia of USD 110-135/ton over conventionally grown paddy, downstream processors recover margin through recipe optimization—cutting dosage by 2-3 g per 100 g due to the higher maltose ratio typical of organic enzymatic profiles.
Global processors are investing in vertically integrated organic estates in Thailand's Northeast Corridor that offer dual cropping for rice and mung beans, thereby diluting fixed overhead per hectare and lowering per-ton carbon intensity. These investments demonstrate the industry's commitment to sustainable agriculture and supply chain optimization. The integration of dual-cropping systems has emerged as a key strategy for cost management and environmental sustainability. The rice syrup industry is also piloting blockchain-anchored audit trails that link paddy lot IDs to finished-goods batches, creating digital provenance records that satisfy EU Regulation (EU) 2023/1542 on deforestation-free supply chains. The implementation of blockchain technology has enhanced transparency and traceability throughout the supply chain. This digital transformation has strengthened consumer trust and regulatory compliance in the market.
By Flavor:
Value-Added Innovation Challenges Traditional DominanceOriginal/unflavored solutions still supplied 91.66% of output in 2025 because their neutral taste profile carries over into sauces, nutritional bars, and RTD coffees without sensory interference. The versatility of unflavored rice syrups makes them a preferred choice for manufacturers seeking clean-label sweetening solutions. Their ability to maintain product stability across various applications has established them as a cornerstone ingredient in food processing. The value-added flavored rice syrup segment is projected to grow at a CAGR of 8.01% through 2031. This growth is attributed to increasing consumer demand for distinctive flavor profiles and natural botanical infusions, including ginger, matcha, and cacao nib macerates. The growing consumer interest in unique flavor experiences has accelerated the development of botanical-infused variants. The natural extraction methods ensure product authenticity while meeting clean-label requirements. Manufacturers are extracting essential oils via super-critical CO₂ and integrating them at dosing rates below 0.2%, thus preserving organic certification under National List 205.605.
Flavored-syrup marketers emphasize provenance storytelling—such as Yunnan jasmine or Sri Lankan cinnamon—to justify retail pricing that can exceed conventional rice syrup by 60%. The premium positioning strategy has successfully captured the attention of quality-conscious consumers. The emphasis on geographical origin has created a new value perception in the specialty sweetener segment. Formulators of specialty pancake syrups, kombucha bases, and artisanal gelato are early adopters, although scale remains modest because compatibility testing must verify that flavor compounds do not precipitate during high-temperature pasteurization. Over the outlook period, co-creation partnerships with craft chocolatiers and micro-breweries will likely unlock new demand pockets for value-added variants.
By Application:
Infant Formula Emergence Reshapes Growth DynamicsBakery and confectionery dominated with 37.86% market value share in 2025, as rice syrup's humectant properties maintain soft crumb structures and extend ambient shelf life. The ingredient's natural preservation capabilities make it particularly valuable for artisanal bakeries seeking clean-label solutions. Its ability to enhance texture while providing consistent moisture retention has made it indispensable in premium confectionery manufacturing. Infant formula and baby food manufacturers are projected to achieve a 7.02% CAGR as the Food and Drug Administration (FDA) strengthens transparency requirements under 21 CFR 105.65, compelling brands to list unambiguous carbohydrate sources. The implementation of these regulations has accelerated the adoption of rice syrup as a trusted ingredient in infant nutrition.
Asia-Pacific multinationals are reformulating traditional maltodextrin-based weaning snacks using low-DE rice syrup to address increasing cross-border ecommerce scrutiny of additive content. This shift reflects a broader industry trend toward cleaner labels and natural ingredients. Secondary applications in nutraceutical chews and gummy vitamins are expanding as formulators leverage rice syrup's low viscosity to achieve rapid depositor throughput without added glycerol. The versatility of rice syrup has made it an attractive option for manufacturers seeking to optimize production efficiency. Pharmaceutical excipient producers are evaluating rice syrup as a hypoallergenic binder for orally dissolving films. The growing demand for allergen-free medications has positioned rice syrup as a viable alternative in pharmaceutical formulations.
Geography Analysis
Europe Rice Syrup Market
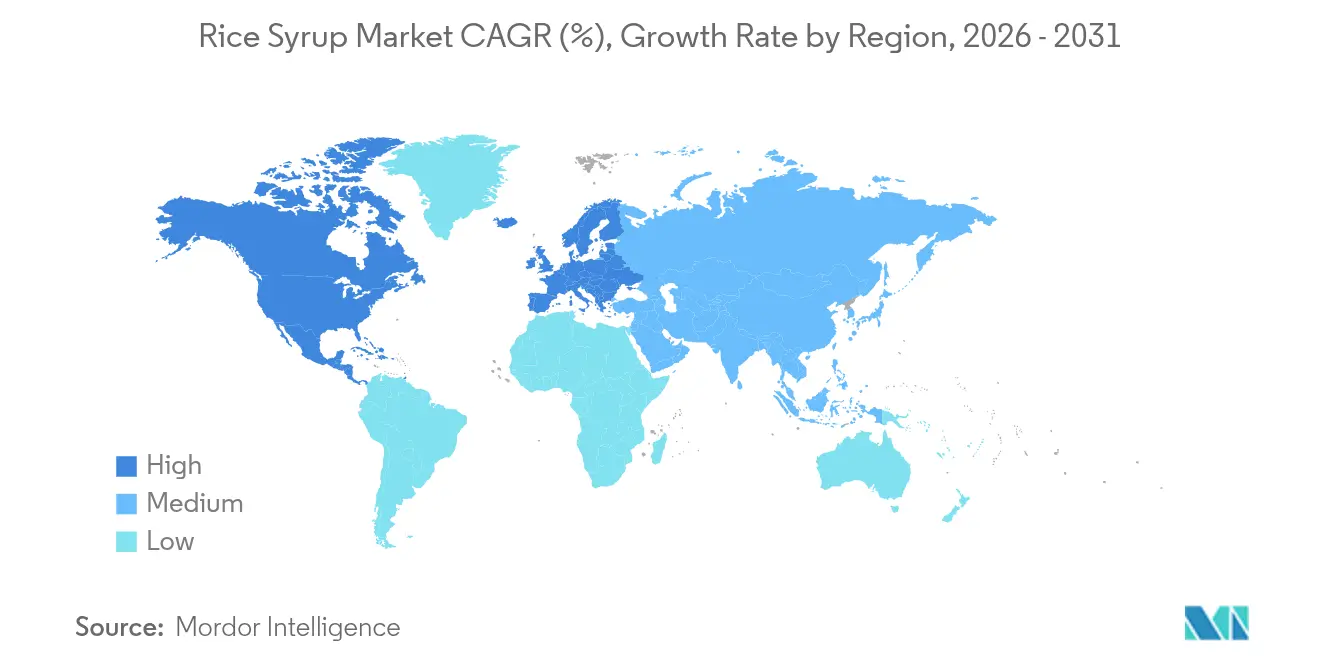
Europe retained a 34.12% revenue lead in 2025 by virtue of conservative additive approvals and the region’s USD 54 billion organic packaged-food spend, locking in a loyal base for plant-based sweeteners. European Food Safety Authority (EFSA)’s layered risk-assessment pipeline often spans six years, so incumbent natural sweeteners such as rice syrup enjoy a moat while synthetic rivals await dossier reviews. Germany, France, and the United Kingdom collectively imported 149,000 metric tons of rice-derived glucose under HS 1702.30 in 2024, reflecting robust demand in bakery centers clustered around Hamburg, Paris, and Manchester. Mid-sized European private-label chocolatiers are installing vacuum-cooker lines optimized for rice syrup, citing 3-point moisture reductions versus corn syrup for the same Brix level, thus enabling cleaner tempering curves.
North America Rice Syrup Market
North America recorded the fastest expansion, with the rice syrup market expected to post an 8.21% CAGR through 2031. Food and Drug Administration (FDA) plans to phase out petroleum-based artificial colors by 2026, and the agency’s rebasing of Generally Recognized As Safe (GRAS) self-affirmations is steering formulators toward proven botanical sweeteners. U.S. rice imports climbed to a record 47.0 million hundredweight in 2025, indicating wider adoption of jasmine and basmati types favored in premium syrup conversions. Ingredient majors such as ADM and Cargill are repurposing Midwest corn-wet-milling tanks for rice substrate enzymolysis, cutting trucking miles and shrinking CO₂ footprints.
APAC, South America and MEA Rice Syrup Market
Asia-Pacific presents latent upside given abundant paddy supply but still accounts for less than 18% of global turnover because quality-assurance systems are uneven. Thailand’s Office of Agricultural Economics projects a 5% rebound in 2025/26 paddy output as El Niño recedes, offering processors an opportunity to secure competitively priced feedstock provided they invest in post-harvest drying infrastructure. South American bakeries, led by Brazil, are exploring rice syrup as an egg-free sponge cake humectant to sidestep volatile shell-egg pricing, while Middle East and Africa demand is concentrated among Dubai-based confectioners supplying travel retail. Across emerging regions, adoption will hinge on technical assistance that equips small and mid-sized food plants to manage higher-viscosity syrup streams without fouling legacy pumps.
Regulatory Landscape
Regulation for rice syrup is shaped by food safety and contaminant controls alongside trade measures that influence rice input costs. In the European Union, inorganic arsenic maximum levels under Regulation (EU) 2023/465 (for example, 0.15 mg/kg for polished/white rice and 0.1 mg/kg for rice intended for infants) tighten raw-material screening and supplier qualification for syrup processors serving infant nutrition and clean-label applications. In the United States, FDA oversight around contaminants (including arsenic in food) and general food safety controls under FSMA continue to frame compliance programs for rice-derived sweeteners.
In 2026, traceability and trade actions became more prominent for supply planning. The FSMA Final Rule on Requirements for Additional Traceability Records for certain foods became active on 2 July 2026, increasing documentation and lot-level recordkeeping expectations across ingredient supply chains. On 9 July 2026, the FDA Foods Program listed a Syrup Proposed Rule on its Unified Agenda, signaling potential updates to syrup-related standards and/or labeling expectations. On the trade side, the European Commission Implementing Regulation (EU) 2026/527 set an import duty of EUR 30 per tonne for husked rice (CN code 1006 20, excluding basmati) from 6 March 2026, while the UK Notice to Traders 20/26 outlined 2026 rice import quotas and security deposits (GBP 40/tonne for semi-milled/wholly milled rice and GBP 5/tonne for broken rice), both of which can flow through to delivered feedstock economics for rice syrup makers.
Competitive Landscape
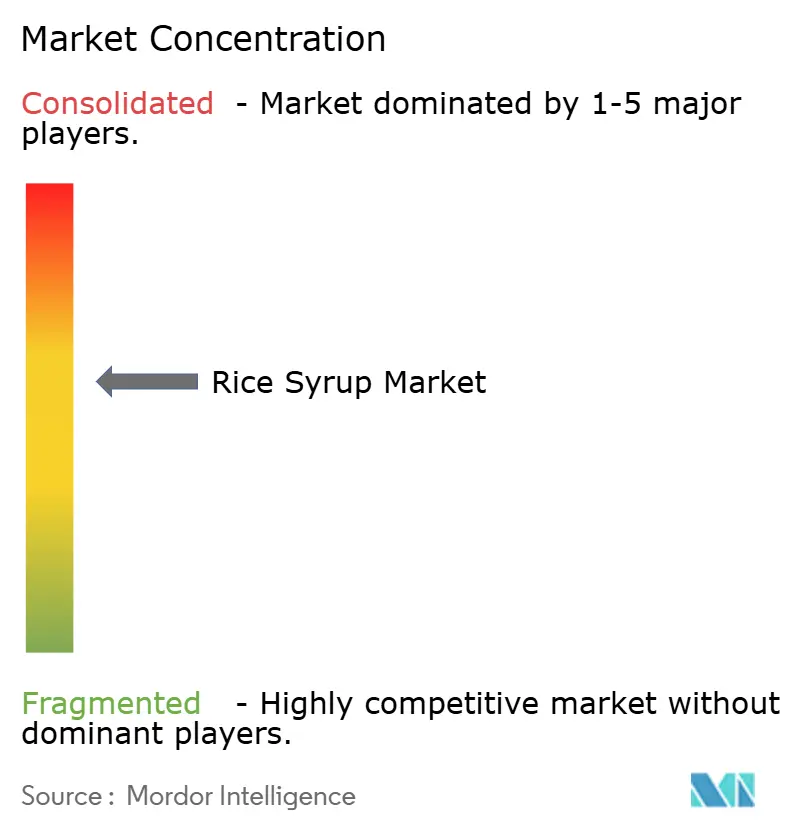
The rice syrup market sits at a moderate concentration level. Global agrifood majors such as Archer-Daniels-Midland Company, Austrade Inc., Wuhu Deli Foods Co., Ltd., and Gulshan Polyols Ltd., Gulshan Polyols Ltd. among others, control advantaged origination networks and enzyme expertise, enabling them to undercut regional independents on delivered-solids cost. Vertical integration strategies include direct rice-paddy contract farming and in-house maltogenic amylase development, giving leaders pricing agility during commodity spikes.
Mid-tier specialists—California Natural Products, Lundberg Family Farms, and Nature’s Crops—concentrate on certified-organic or whole-grain derivatives that fetch premiums in infant nutrition and keto granola niches. Many lack the scale to shoulder volatile freight or currency swings, so they hedge exposure through multi-origin sourcing from Arkansas, Pakistan, and Cambodia.
Technological differentiation is accelerating. Japanese processors are rolling out electron-beam irradiation tunnels that deactivate residual lipase without elevating Maillard compounds, improving flavor stability in brown rice syrup destined for ready-to-drink coffee. Chinese equipment vendors are showcasing continuous-vacuum evaporators capable of achieving 83° Brix at 40 °C, minimizing hydrolytic browning and preserving the light color demanded by beverage formulators. Strategically, incumbents are acquiring micro-startups with IP in flavor-infused syrups to secure early access to proprietary maceration techniques.
Rice Syrup Industry Leaders
-
Archer-Daniels-Midland Company
-
Austrade Inc.
-
Wuhu Deli Foods Co., Ltd.
-
Gulshan Polyols Ltd.
-
Pioneer Industries Private Limited
- *Disclaimer: Major Players sorted in no particular order
Rice Syrup Market Companies Covered in this Report
- Archer-Daniels-Midland Company
- Austrade Inc.
- Wuhu Deli Foods Co., Ltd.
- Gulshan Polyols Ltd.
- Pioneer Industries Private Limited
- GehlFoods, LLC.
- Bharat Glucose Pvt. Ltd
- Ciranda, Inc.
- Shafi Group of Industries (Shafi Gluco Chem)
- ASR Group (Domino Foods, Inc.)
- Sudzucker Group (BENEO)
- Malt Products Corporation
- Sweet Additions
- Qureshi Business Group (Glucorp)
- LT Foods Ltd (Nature Bio-Foods Ltd.)
- MATCO FOODS LIMITED
- Habib Rice Products Ltd.
- ACT Polyols
- Master Sweetener
- Meurens Natural
Market Opportunities and Future Outlook
Opportunities for rice syrup suppliers are concentrated in regulated and documentation-heavy end uses where traceability, contaminant controls, and clean-label positioning carry procurement weight. The March 2024 rollout of electronic NOP import certificates for organics and the July 2026 activation of FSMA traceability requirements raise the value of suppliers that can provide chain-of-custody documentation, lot-level testing, and consistent dextrose-equivalent control for beverage, bakery, and infant-food formulations. This creates whitespace for processors that invest in digital provenance (including batch linking from paddy to finished syrup) and beverage-grade process control that reduces crystallization and color shift during low-temperature evaporation.
Process and feedstock innovation broadens the addressable raw-material base beyond polished rice, particularly where circular-bioeconomy pathways can reduce exposure to paddy price volatility. Academic work published in April 2026 (Food Chemistry: X) validated an enzymatic route to a xylose-rich syrup from defatted rice bran (reported at 65 Brix total soluble solids and 90.9% reducing sugar content), reinforcing a pathway to valorize rice side-streams into functional syrups for food applications. In parallel, the report context highlights accelerating use in plant-based dairy and reduced-sugar recipes where ingredient majors such as Cargill are pairing soluble fibers with low-DE rice syrup to support sugar-reduction targets while keeping labels simple, and where brown rice syrup differentiation aligns with premium, whole-grain, and allergen-aware product positioning.
Recent Industry Developments in Rice Syrup Market
- July 2026: The US FDA Foods Program listed a Syrup Proposed Rule on its Unified Agenda as of 9 July 2026. The agenda item adds regulatory watchpoints for syrup definitions and labeling, prompting manufacturers and importers of rice-derived syrups to review claims, standards-of-identity positioning, and compliance documentation.
- May 2025: European Commission updates import documentation requirements for starch-based sweeteners, reinforcing traceability and origin declarations for rice syrup imports.
- June 2024: Tate & Lyle completed its USD 1.8 billion acquisition of CP Kelco. The combined portfolio strengthens competing clean-label sweetening and texturizing systems (including alternatives such as stevia and allulose, plus hydrocolloids), increasing substitution and solution-bundling pressure on standalone rice syrup offerings in beverages and confectionery.
Rice Syrup Market Report Scope and Research Methodology
Market Definition and Coverage
This market covers the sales value of rice syrup used as a sweetening ingredient across food and beverage uses, counted in USD at the point it is sold into the market. We treat rice syrup as rice-derived syrup products that are traded commercially and used in formulated products.
Scope exclusions: We exclude non-rice syrups and tabletop sweeteners that are not rice-based, and we also exclude downstream packaged food retail value to avoid double counting.
Segments Covered in This Report
- By Rice Type
- Brown Rice
- White Rice
- Others
- By Category
- Conventional
- Organic
- By Flavor
- Original/Unflavored
- Value-Added Flavored Syrups
- By Application
- Bakery and Confectionery
- Beverages
- Dairy and Dessert Products
- Infant Formula and Baby Foods
- Other Applications
- By Geography
- North America
- United States
- Canada
- Mexico
- Rest of North America
- Europe
- Germany
- France
- United Kingdom
- Spain
- Netherlands
- Italy
- Sweden
- Poland
- Belgium
- Rest of Europe
- Asia-Pacific
- China
- India
- Japan
- Australia
- South Korea
- Indonesia
- Thailand
- Singapore
- Rest of Asia-Pacific
- South America
- Brazil
- Argentina
- Chile
- Colombia
- Peru
- Rest of South America
- Middle East and Africa
- United Arab Emirates
- South Africa
- Nigeria
- Saudi Arabia
- Egypt
- Morocco
- Turkey
- Rest of Middle East and Africa
- North America
Data Sources, Market Sizing, and Validation
Desk Research
Desk work starts with public production, trade, and consumption signals that can be tied back to starch sweeteners and processed rice inputs. We use sources such as FAOSTAT for rice supply indicators, UN Comtrade for trade flows, and USDA publications for grains and sweetener context, then we cross-check with EU and US food labeling and standards pages when definitions need clarity.
To ground the commercial side, we also review company annual reports, investor decks, product specification sheets, and reputable press coverage that discusses capacity additions, clean label positioning, and application demand. In a few cases, we use paid subscription databases for company financials and for patent data to validate business mix statements and technology direction. These desk sources are illustrative only, and many other public and paid references were also used for data collection, validation, and clarification.
Primary Interviews and Surveys
Primary checks are used to convert broad signals into market-ready assumptions, especially for application splits, pricing movement, and how quickly organic and conventional offerings are being adopted. We speak with stakeholders across ingredient suppliers, food and beverage formulators, and distribution-side experts, and then we close gaps by re-checking assumptions across APAC, EMEA, and the Americas, so the model does not depend on a single region's input.
Distribution of primary research fieldwork respondents
| Company type | Respondent position | Region |
|---|---|---|
| Top tier: 28% | CXOs: 13% | APAC: 41% |
| Mid tier: 54% | Functional/Unit leaders: 33% | EMEA: 35% |
| Smaller Players: 18% | Managers: 54% | Americas: 24% |
Market-Sizing & Forecasting
Sizing starts with a top-down demand pool build using food ingredient usage patterns, trade direction, and the role of rice-based sweeteners in key applications. We then translate totals into value using price bands that were validated in interviews. To keep the estimate practical, we focus on a few repeatable inputs, such as organic versus conventional mix, share of liquid versus powder forms, application intensity in beverages and bakery and confectionery, and regional import dependence for processed sweetener ingredients.
Once the top-down view is built, we run selective bottom-up approximations as a check, such as sampled supplier revenue splits, channel checks on distributor assortment, and volume times average selling price for a limited set of representative use cases. Those checks are then used to adjust outliers. For forecasting, we use scenario analysis supported by light multivariate regression where variables behave consistently, mainly tying growth to processed food output, clean label sweetener adoption, and relative price movement versus adjacent sweeteners. When a data series is missing for a country, we backfill using regional proxies and trade intensity, then re-test the result with primary feedback.
Data Validation & Update Cycle
Validation is done through cross-checks across at least three angles, which include demand indicators, trade movement, and interview-confirmed pricing and mix. If any geography shows a sharp jump that is not supported by a known driver, such as a capacity event or a policy shift, it is flagged, re-worked, and reviewed before sign-off.
The report is refreshed on an annual cycle, and interim updates are triggered when material events occur, such as regulatory changes impacting sweetener claims, major supply disruptions, or visible pricing shocks. Before delivery, we complete a final review pass so clients receive the most current version of the model and the supporting assumptions.
Mordor Intelligence's Rice Syrup Market Sizing Compared With Other Published Estimates
Published market sizes for rice syrup can look different even when they appear to be describing the same product, since the included forms, application coverage, and the timing of price assumptions are not always aligned. Differences also come from how each study treats organic premiums, currency conversion timing, and whether the current year is an actualized estimate or a forward base.
Some published figures roll rice syrup into broader sweetener buckets, or they use a longer horizon where price uplift is assumed early in the forecast. In Mordor Intelligence, rice syrup is counted only when it is a rice-derived syrup sold as an ingredient across defined applications, and downstream packaged food retail value is not added on top, which keeps the total tied to ingredient demand and realistic ASP bands.
Benchmark comparison
| Source | Market Size | Gaps in Research Methodology |
|---|---|---|
| Mordor Intelligence | USD 2.16 B (2026) | |
| Global Consultancy A | USD 2.19 B (2024) | Uses an earlier base year and a different normalization of pricing, so the value reflects a prior-cycle ASP and mix, and it may also treat certain regional form factors and channels more broadly. |
| Industry Publisher B | USD 2.33 B (2025) | Starts from a different base year and applies a separate growth path and horizon, and the spread can also come from how organic premium and form conversion (liquid versus powder) are applied in the value build. |
Across the three numbers, the largest drivers of spread are base-year choice, price and mix handling, and how tightly the product is kept to ingredient-level revenue rather than expanded into adjacent sweetener or downstream value pools. By keeping assumptions traceable to a few repeatable demand and pricing inputs, we can explain the math clearly and update it without forcing hidden add-ons.
Key Questions Answered in the Report
What is the current size of the rice syrup market?
The global rice syrup market is valued at USD 2.16 billion in 2026 and is projected to reach USD 2.93 billion by 2031, reflecting a 6.29% CAGR.
Which region leads the rice syrup market?
Europe holds the largest regional share at 34.12% in 2025, driven by stringent additive regulations and high organic-food consumption.
Why is brown rice syrup gaining share?
Brown rice syrup retains bran micronutrients and antioxidants, enabling premium positioning and supporting an expected 8.45% CAGR through 2031.
What is driving organic rice syrup growth?
The USDA’s Strengthening Organic Enforcement rule improves supply-chain transparency, boosting consumer trust and propelling a 7.08% CAGR for organic variants.
What production technologies are improving cost efficiency?
Cold-plasma bran stabilization and continuous-vacuum low-temperature evaporation cut enzymatic degradation and energy use, trimming unit costs for processors.