| Study Period | 2017 - 2030 |
| Base Year For Estimation | 2024 |
| Forecast Data Period | 2025 - 2030 |
| Market Size (2025) | USD 6.09 Billion |
| Market Size (2030) | USD 7.33 Billion |
| CAGR (2025 - 2030) | 3.77 % |
| Market Concentration | Low |
Major Players*Disclaimer: Major Players sorted in no particular order |

Rice Seed Market Analysis
The Rice Seed Market size is estimated at 6.09 billion USD in 2025, and is expected to reach 7.33 billion USD by 2030, growing at a CAGR of 3.77% during the forecast period (2025-2030).
The rice seed industry continues to evolve with significant technological advancements in rice breeding techniques and genetic improvements. Traditional breeding remains the dominant approach, accounting for 64.6% of breeding techniques in 2022, while hybrid rice seed and transgenic breeding represent 16.6% and 18.8%, respectively. The integration of artificial intelligence and marker-assisted selection in rice breeding programs has enhanced the development of varieties with improved traits. This technological progression is evidenced by recent innovations like Nuziveedu Seeds' launch of four new products in 2023 - NP-7373, NA 9153 Pushkal, NSL Annapurna, and NP-9359 Sandhya, showcasing the industry's commitment to innovation.
The industry is witnessing a significant shift toward sustainable and resilient rice seed varieties, particularly in response to changing climatic conditions and pest pressures. Rice seeds with enhanced traits for disease resistance and drought tolerance are gaining prominence, with herbicide-tolerant varieties holding a 14% market share in 2022. The development of insect-resistant varieties has proven particularly effective, helping reduce crop losses by 80-90% in regions where they are deployed. This focus on resilience is complemented by the emergence of biofortified varieties, as exemplified by the Philippines' recent approval of golden rice for commercial cultivation.
The seed industry's structure is evolving with increasing emphasis on research and development activities. Rice accounts for 9.3% of the global row crops seed market, reflecting its significance in agricultural production systems. The market is characterized by a dual approach to seed development, with hybrid rice seed varieties gaining traction alongside traditional open-pollinated varieties (OPVs). This diversification is supported by extensive research networks and collaborations between public and private institutions, leading to the development of varieties that combine high yield potential with specific adaptive traits.
The commercialization landscape is experiencing notable transformations with the introduction of novel certified rice seed delivery systems and quality assurance mechanisms. Major agricultural seed companies are investing in advanced seed treatment technologies and coating processes to enhance seed performance and shelf life. The industry is also witnessing increased attention to seed certification and quality control measures, ensuring that farmers have access to authentic and high-quality planting material. These developments are accompanied by innovative marketing approaches and digital platforms that facilitate better connections between seed producers and farmers, improving the efficiency of crop seed distribution networks.
Global Rice Seed Market Trends
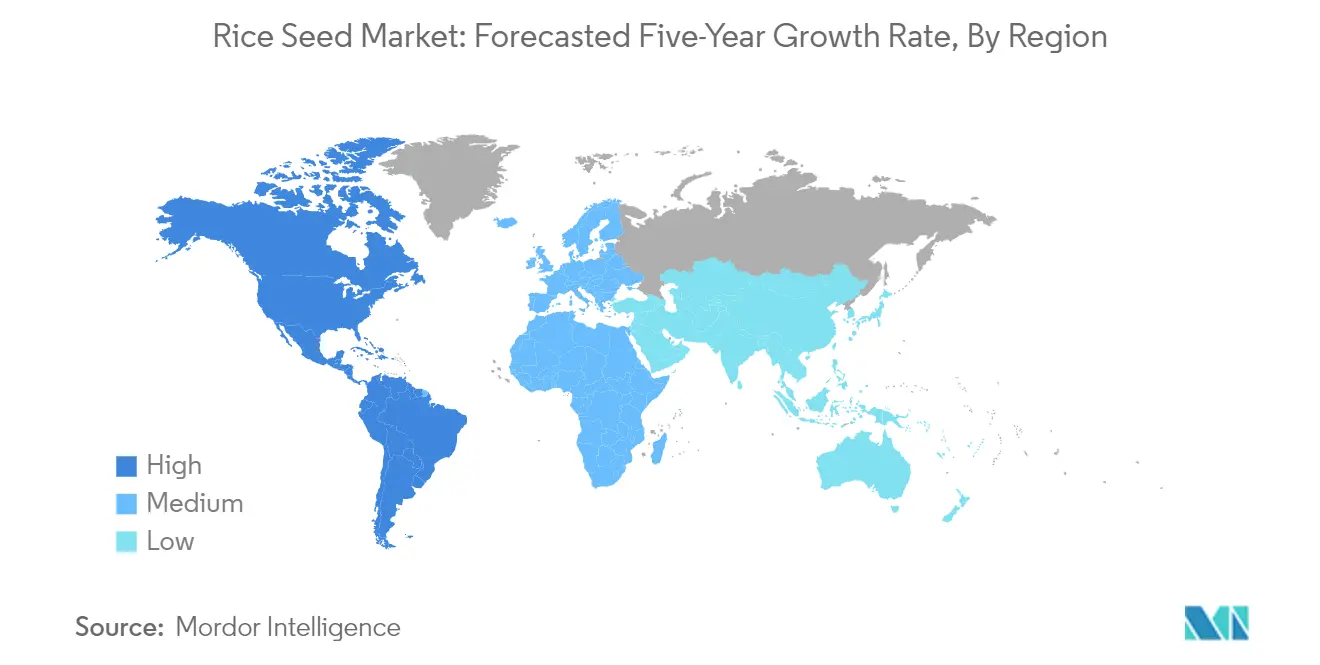
Asia-Pacific was the major region in the world concerning rice acreage, with Africa having higher growth potential with support from the government
- Rice is the major staple food for almost two-thirds of the world's population. In 2022, globally, the acreage under rice cultivation was 165.3 million hectares, with Asia-Pacific being the region with the highest cultivated acreage (143.2 million hectares), which accounted for 87.6% of the global acreage in 2022. In Asia-Pacific, India and China were the top countries with the highest cultivated areas, with 46.8 million hectares and 30.4 million hectares, respectively, in 2022. The higher acreage was because of the age-old consumption of rice as a staple food in these countries and the initiatives of respective governments to meet the demand for their growing populations. However, Australia has observed a substantial decline in 2019 by 87.5% compared to 2018 due to lower water availability and higher water prices.
- Africa is the second-largest region for rice production, and it accounted for 9.8% of the global rice acreage in 2022. Nigeria was the major country, which accounted for 27.3% of the area under rice cultivation in the region in 2022, followed by Tanzania with 6.04% of the acreage. The acreage is estimated to increase with the government initiatives. For instance, the 10-year National Rice Development Strategy Phase II (NRDS-II) program is estimated to double the area under rice cultivation in the country. However, in 2022, South America held 2.6% of the global rice acreage, whereas North America and Europe were the other major regions, which accounted for 0.8% and 0.5%, respectively.
- Therefore, with the increase in the demand for rice as a staple food, government initiatives in developing countries to meet the domestic demand are estimated to drive the global rice acreage during the forecast period.

Understand The Key Trends Shaping This Market
Download PDF
The demand for rice seeds with improved traits, such as disease resistance, drought tolerance, and wider adaptability to different regions to reduce yield loss, is driving the demand for improved varieties
- Rice is a staple food in Asia-Pacific because it is consumed as a meal once daily. China and India are major rice producers globally, and drought tolerance is one of the major traits produced by seed companies as there have been changes in the climatic conditions, which has led to high demand for this seed variety by the growers. For instance, in 2022, China suffered drier conditions than normal rainfall conditions, which is expected to help increase the demand for drought-tolerant seed varieties as well as wider adaptability traits. Moreover, Nuziveedu Seeds launched 4 new products, NP-7373, NA 9153 Pushkal, NSL Annapurna, and NP-9359 Sandhya in 2023, and Corteva Agriscience launched a brand Brevant for India in 2020, and it contains traits such as wider adaptability and drought tolerance.
- Furthermore, there is a high demand for seeds resistant to diseases such as seedling blight, grain rot, and other bacterial diseases. For instance, brands such as Bayer AG's Arize Tej Gold, Advanta Seeds' PAC 8744, and Vina Seed's Thein Uu8 provide resistance to different diseases such as blast, seeding blight, and sheath blight. Furthermore, the crop is affected by biotic stresses and different pests such as Tryporyza incertulas and Gundhi bugs. Additionally, in North America, white spot diseases, gray leaf spots, common rust, goss wilt, and Anthracnose stalk rot diseases are affecting the growth of rice crops, and it has increased the demand for disease-resistant traits in the region, especially the United States.
- An increase in new varieties developed to meet the demand for rice seeds and conventional hybrids replaced by advanced traits, such as disease resistance and drought tolerance, are expected to help the growth of the market during the forecast period.

OTHER KEY INDUSTRY TRENDS COVERED IN THE REPORT
- Traditional breeding is the most commonly used technique in rice as it is a self-pollinated crop
Segment Analysis: Breeding Technology
Open Pollinated Varieties & Hybrid Derivatives Segment in Rice Seed Market
The Open Pollinated Varieties & Hybrid Derivatives (OPVs) segment dominates the global rice seed market, commanding approximately 65% market share in 2024. This significant market position is primarily attributed to the lower cost of OPVs compared to hybrid seeds, making them more accessible to small and marginal farmers. OPVs require fewer inputs such as fertilizers and pesticides, offering better economic viability for farmers. Additionally, these varieties demonstrate superior adaptability to local growing conditions and climates, allowing farmers to save seeds for subsequent planting seasons. The segment's dominance is particularly strong in regions like Africa, where OPVs account for nearly 99% of the market, and in major rice-producing Asian countries where traditional farming practices still prevail. The segment is also experiencing the fastest growth in the market, projected to grow at approximately 4% through 2029, driven by increasing demand for native rice varieties such as red rice and black rice, along with the continued preference for cost-effective seed solutions among farmers.
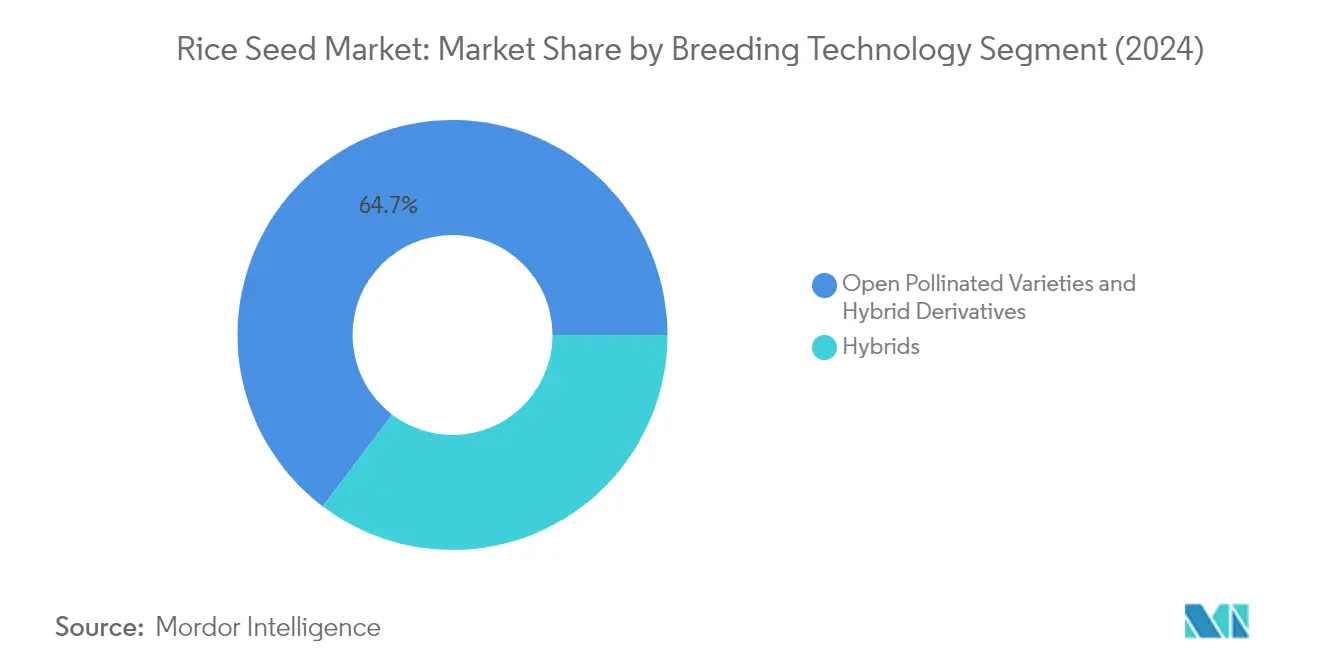
Hybrids Segment in Rice Seed Market
The Hybrids segment, encompassing both transgenic and non-transgenic varieties, represents a crucial component of the rice seed market. This segment offers advanced traits such as higher yield potential, improved disease resistance, and enhanced stress tolerance compared to conventional varieties. Hybrid rice seed has shown particular success in regions with developed agricultural infrastructure and where farmers have access to proper input assistance. The adoption of hybrid seeds is notably strong in countries like China, where extensive research and development have led to the commercialization of various hybrid varieties, including insect-resistant and herbicide-tolerant traits. Despite their higher cost, hybrid seeds continue to gain traction among commercial farmers who prioritize productivity and can manage the additional investment in seed cost. The segment's growth is supported by ongoing technological advancements in rice breeding techniques and increasing awareness about the benefits of hybrid varieties among farmers. Additionally, the growing interest in organic rice seed is influencing market dynamics, as farmers seek sustainable and eco-friendly agricultural practices.
Rice Seed Market Geography Segment Analysis
Rice Seed Market in Africa
The African rice seed market demonstrates significant regional diversity in cultivation practices and market dynamics. Key markets include Nigeria, Egypt, Tanzania, Ghana, Ethiopia, South Africa, and Kenya, each with distinct agricultural conditions and consumer preferences. The region shows strong potential for growth driven by increasing rice consumption, government initiatives to boost domestic production, and efforts to reduce import dependency. Most countries in the region predominantly use open-pollinated varieties due to their lower costs and better adaptability to local growing conditions.
Rice Seed Market in Nigeria
Nigeria stands as the dominant force in Africa's rice seed market, with approximately 56% market share in 2024. The country's prominence is attributed to its extensive rice cultivation areas, particularly in the northern regions. Rice farming is widespread across Nigeria, with increasing adoption of improved varieties and modern cultivation techniques. The government's efforts to promote rice production in the southern part of the country have further expanded cultivation areas. Nigerian farmers are increasingly moving from singular seasonal rice farming to two crops per season, with varieties like Faro 44 and 45, which are hybrids of local African rice and Taiwanese rice, showing excellent performance in Nigerian climatic conditions.
Rice Seed Market in Ukraine
Ukraine emerges as the fastest-growing market in the region, projected to grow at approximately 11% during 2024-2029. The country's growth is driven by significant developments in rice cultivation technology and increasing adoption of advanced seed varieties. The introduction of modern drip irrigation technologies has expanded rice cultivation possibilities to regions previously considered unsuitable. The country's rice production is concentrated in specific regions like Kherson, Odesa, and the Autonomous Republic of Crimea, where white rice varieties belonging to the subspecies of India are predominantly cultivated. The market shows strong potential for hybrid varieties, particularly those with enhanced traits for local climate adaptation.
Rice Seed Market in Asia-Pacific
The Asia-Pacific region represents the cornerstone of the global rice seed market, encompassing major producing nations like China, India, Indonesia, Japan, and emerging markets such as Vietnam and Thailand. The region's dominance is characterized by diverse cultivation practices, ranging from traditional methods to advanced farming techniques. Countries in this region demonstrate varying levels of hybrid seed adoption, with some markets showing strong preference for traditional varieties while others embrace modern hybrid technologies. The market is driven by increasing food security concerns, growing population, and the need for higher productivity in limited agricultural land.
Rice Seed Market in China
China maintains its position as the largest rice seed market in Asia-Pacific, commanding approximately 42% of the regional market share in 2024. The country's dominance is supported by its extensive research and development in hybrid rice varieties and strong government support for agricultural modernization. Chinese farmers have widely adopted hybrid rice varieties, particularly in regions like Hunan Province, which leads in rice planting area. The country's unique position as the only nation in Asia-Pacific approved for cultivating insect-resistant GM rice seeds has further strengthened its market leadership.
Rice Seed Market in Australia
Australia emerges as the fastest-growing market in the Asia-Pacific region, with a projected growth rate of approximately 9% during 2024-2029. The country's growth is primarily driven by increasing adoption of hybrid seeds and modern cultivation techniques. Despite having a relatively smaller cultivation area compared to other Asian countries, Australia's rice industry is highly mechanized and efficient. The major rice-growing region is Southern New South Wales, with Queensland, Western Australia, and the Northern Territory also contributing to production. The country's focus on premium quality rice production and export-oriented growth has catalyzed the adoption of advanced seed rice varieties.
Rice Seed Market in Europe
The European rice seed market presents a unique landscape with distinct regional characteristics across countries like Italy, Turkey, Russia, Spain, France, Romania, and Ukraine. The market is characterized by a strong focus on quality and specific variety preferences, particularly in Mediterranean countries. European rice cultivation is concentrated in southern regions where climatic conditions are favorable. The market shows increasing interest in sustainable farming practices and development of varieties suited to local conditions.
Rice Seed Market in Italy
Italy stands as the largest rice seed market in Europe, with its strong tradition in rice cultivation, particularly in the Piemonte, Lombardy, and Veneto regions. The country's dominance is reflected in its specialized production of high-quality rice varieties, with 92% of production concentrated in the Piedmont and Lombardy regions. Italian rice cultivation benefits from abundant water resources and specialized farming techniques, with a particular focus on varieties suitable for traditional Italian cuisine, especially risotto preparation.
Rice Seed Market in Ukraine
Ukraine demonstrates remarkable growth potential in the European rice seed market, driven by technological advancements and increasing domestic demand. The country's rice cultivation is concentrated in specific regions like Kherson, Odesa, and the Autonomous Republic of Crimea. The introduction of advanced drip irrigation technologies has expanded cultivation possibilities to new areas. Ukraine's focus on white rice varieties belonging to the subspecies of India has created a specialized market niche.
Rice Seed Market in Middle East
The Middle Eastern rice seed market, led by Iran and including other regional players, demonstrates unique characteristics shaped by local agricultural conditions and water availability. Iran emerges as the largest market in the region, while other countries show varying levels of market development. The region faces challenges related to water scarcity and climate conditions, influencing the adoption of specific rice varieties. The market shows increasing interest in drought-resistant varieties and modern cultivation techniques to optimize water usage. Government initiatives to reduce import dependency and achieve food security drive market growth across the region.
Rice Seed Market in North America
The North American rice seed market, primarily driven by the United States and Mexico, demonstrates advanced agricultural practices and high technological adoption. The United States emerges as the largest market, with major production concentrated in states like Arkansas, Louisiana, Mississippi, and California. Mexico shows the fastest growth potential, driven by government support and increasing domestic demand. The region is characterized by high mechanization levels, advanced irrigation systems, and strong research and development activities in rice breeding technology. The market shows particular strength in long-grain rice production in the southern United States and increasing adoption of hybrid varieties across both countries.
Rice Seed Market in South America
The South American rice seed market demonstrates strong agricultural capabilities, with Brazil and Argentina as key players in the region. Brazil emerges as the largest market, benefiting from extensive cultivation areas in both irrigated southern regions and non-irrigated central-west and northeast areas. Argentina shows the fastest growth potential, with production concentrated in provinces like Entre Rios, Corrientes, and Santa Fe. The region benefits from favorable climate conditions and abundant water resources, particularly in major river basins. Market development is supported by increasing mechanization, improved irrigation infrastructure, and growing export opportunities to neighboring countries.
Get Analysis on Important Geographic Markets
Download PDF
Rice Seed Industry Overview
Top Companies in Rice Seed Market
The global rice seed market is characterized by continuous product innovation and strategic partnerships among leading players. Companies are focusing on developing high-yielding, disease-resistant, and hybrid rice seed varieties suitable for various agro-climatic conditions. Strategic partnerships with research institutes and agricultural organizations have become a key trend to enhance research and development capabilities. Major players are expanding their presence through collaborations with local distributors and establishing regional breeding stations. The industry has witnessed significant investments in biotechnology and genetic improvement programs to develop superior seed varieties. Companies are also strengthening their distribution networks and implementing farmer engagement programs to increase market penetration and brand loyalty.
Fragmented Market with Regional Strong Players
The rice seed market exhibits a fragmented structure with a mix of global agricultural conglomerates and regional specialists. Global players like Bayer AG, Syngenta Group, and Advanta Seeds-UPL maintain significant market presence through their extensive research capabilities and broad product portfolios. These companies leverage their international networks and technological expertise to maintain competitive advantages. Regional players, particularly in Asia-Pacific, have established strong local presence through their understanding of specific agricultural conditions and farmer preferences.
The market demonstrates moderate consolidation levels, with opportunities for both established players and new entrants. Merger and acquisition activities are primarily focused on acquiring regional seed companies to gain access to local rice germplasm and distribution networks. Companies are also forming strategic alliances to combine complementary strengths in research, production, and marketing. The industry structure supports the coexistence of large multinational corporations alongside specialized local players, each serving distinct market segments.
Innovation and Localization Drive Market Success
Success in the rice seed market increasingly depends on developing climate-resilient and high-yielding varieties adapted to local growing conditions. Companies must invest in advanced rice breeding technologies and maintain robust research and development pipelines to stay competitive. Building strong relationships with farming communities through demonstration programs and technical support has become crucial for market expansion. Establishing efficient seed production and processing facilities in key agricultural regions helps ensure product quality and timely availability.
Market players need to navigate complex regulatory environments while addressing growing demand for sustainable and organic farming solutions. Companies must develop comprehensive product portfolios catering to different price points and farming practices. The ability to provide integrated solutions combining seeds with complementary agricultural seed inputs and services is becoming increasingly important. Success also depends on building strong brand recognition and trust among farmers through consistent product performance and after-sales support. Companies need to maintain flexible business models that can adapt to changing weather patterns, evolving farmer preferences, and potential regulatory changes affecting seed development and commercialization.
Rice Seed Market Leaders
-
Advanta Seeds - UPL
-
Bayer AG
-
Corteva Agriscience
-
SL Agritech Corporation (SLAC)
-
Syngenta Group
- *Disclaimer: Major Players sorted in no particular order

Need More Details on Market Players and Competitors?
Download PDF
Rice Seed Market News
- May 2023: Syngenta Seeds collaborated with Wilmar PADI Indonesia and the National Research and Innovation Agency (BRIN) in the development of the Witagen rice variety, a high-quality, superior rice seed.
- November 2022: Agritech Corporation (SLAC) and the Bangladesh Agricultural Development Corp (BDAC) signed a memorandum of agreement (MOA) for the production of SL-8H F1 seeds. This agreement is a significant step in strengthening agricultural technology development and collaboration between the Philippines and Bangladesh.
- October 2022: SL Agritech Corporation (SLAC) has raised USD 728 million through the issuance of commercial papers. The funds generated from these issuances will be utilized to meet the company's short-term obligations and purchase rice and seed inventories from its contract growers.
Free With This Report
We provide a complimentary and exhaustive set of data points on regional and country-level metrics that present the fundamental structure of the industry. Presented in the form of 90+ free charts, the section covers difficult-to-find data from various regions regarding the area under cultivation for different crops within the scope


Rice Seed Market Report - Table of Contents
1. EXECUTIVE SUMMARY & KEY FINDINGS
2. REPORT OFFERS
3. INTRODUCTION
- 3.1 Study Assumptions & Market Definition
- 3.2 Scope of the Study
- 3.3 Research Methodology
4. KEY INDUSTRY TRENDS
- 4.1 Area Under Cultivation
- 4.2 Most Popular Traits
- 4.3 Breeding Techniques
- 4.4 Regulatory Framework
- 4.5 Value Chain & Distribution Channel Analysis
5. MARKET SEGMENTATION (includes market size in Value in USD, Forecasts up to 2030 and analysis of growth prospects)
-
5.1 Breeding Technology
- 5.1.1 Hybrids
- 5.1.1.1 Non-Transgenic Hybrids
- 5.1.1.2 Transgenic Hybrids
- 5.1.1.2.1 Herbicide Tolerant Hybrids
- 5.1.1.2.2 Insect Resistant Hybrids
- 5.1.1.2.3 Other Traits
- 5.1.2 Open Pollinated Varieties & Hybrid Derivatives
-
5.2 Region
- 5.2.1 Africa
- 5.2.1.1 By Breeding Technology
- 5.2.1.2 By Country
- 5.2.1.2.1 Egypt
- 5.2.1.2.2 Ethiopia
- 5.2.1.2.3 Ghana
- 5.2.1.2.4 Kenya
- 5.2.1.2.5 Nigeria
- 5.2.1.2.6 South Africa
- 5.2.1.2.7 Tanzania
- 5.2.1.2.8 Rest of Africa
- 5.2.2 Asia-Pacific
- 5.2.2.1 By Breeding Technology
- 5.2.2.2 By Country
- 5.2.2.2.1 Australia
- 5.2.2.2.2 Bangladesh
- 5.2.2.2.3 China
- 5.2.2.2.4 India
- 5.2.2.2.5 Indonesia
- 5.2.2.2.6 Japan
- 5.2.2.2.7 Myanmar
- 5.2.2.2.8 Pakistan
- 5.2.2.2.9 Philippines
- 5.2.2.2.10 Thailand
- 5.2.2.2.11 Vietnam
- 5.2.2.2.12 Rest of Asia-Pacific
- 5.2.3 Europe
- 5.2.3.1 By Breeding Technology
- 5.2.3.2 By Country
- 5.2.3.2.1 France
- 5.2.3.2.2 Italy
- 5.2.3.2.3 Romania
- 5.2.3.2.4 Russia
- 5.2.3.2.5 Spain
- 5.2.3.2.6 Turkey
- 5.2.3.2.7 Ukraine
- 5.2.3.2.8 Rest of Europe
- 5.2.4 Middle East
- 5.2.4.1 By Breeding Technology
- 5.2.4.2 By Country
- 5.2.4.2.1 Iran
- 5.2.4.2.2 Rest of Middle East
- 5.2.5 North America
- 5.2.5.1 By Breeding Technology
- 5.2.5.2 By Country
- 5.2.5.2.1 Mexico
- 5.2.5.2.2 United States
- 5.2.5.2.3 Rest of North America
- 5.2.6 South America
- 5.2.6.1 By Breeding Technology
- 5.2.6.2 By Country
- 5.2.6.2.1 Argentina
- 5.2.6.2.2 Brazil
- 5.2.6.2.3 Rest of South America
6. COMPETITIVE LANDSCAPE
- 6.1 Key Strategic Moves
- 6.2 Market Share Analysis
- 6.3 Company Landscape
-
6.4 Company Profiles
- 6.4.1 Advanta Seeds - UPL
- 6.4.2 Bayer AG
- 6.4.3 Beidahuang Kenfeng Seed Co. Ltd
- 6.4.4 Corteva Agriscience
- 6.4.5 DCM Shriram Ltd (Bioseed)
- 6.4.6 Kaveri Seeds
- 6.4.7 Rasi Seeds Private Limited
- 6.4.8 SL Agritech Corporation (SLAC)
- 6.4.9 Syngenta Group
- 6.4.10 Yuan Longping High-Tech Agriculture Co. Ltd
- *List Not Exhaustive
7. KEY STRATEGIC QUESTIONS FOR SEEDS CEOS
8. APPENDIX
-
8.1 Global Overview
- 8.1.1 Overview
- 8.1.2 Porter’s Five Forces Framework
- 8.1.3 Global Value Chain Analysis
- 8.1.4 Global Market Size and DROs
- 8.2 Sources & References
- 8.3 List of Tables & Figures
- 8.4 Primary Insights
- 8.5 Data Pack
- 8.6 Glossary of Terms
You Can Purchase Parts Of This Report. Check Out Prices For Specific Sections
Get Price Break-up Now
List of Tables & Figures
- Figure 1:
- AREA UNDER CULTIVATION OF RICE, HECTARE, GLOBAL, 2017-2022
- Figure 2:
- VALUE SHARE OF MAJOR RICE TRAITS, %, GLOBAL, 2022
- Figure 3:
- VALUE SHARE OF RICE BREEDING TECHNIQUES, %, GLOBAL, 2022
- Figure 4:
- VOLUME OF RICE SEED, METRIC TON, GLOBAL, 2017 - 2030
- Figure 5:
- VALUE OF RICE SEED, USD, GLOBAL, 2017 - 2030
- Figure 6:
- VOLUME OF RICE SEED BY BREEDING TECHNOLOGY CATEGORIES, METRIC TON, GLOBAL, 2017 - 2030
- Figure 7:
- VALUE OF RICE SEED BY BREEDING TECHNOLOGY CATEGORIES, USD, GLOBAL, 2017 - 2030
- Figure 8:
- VOLUME SHARE OF RICE SEED BY BREEDING TECHNOLOGY CATEGORIES, %, GLOBAL, 2017 VS 2023 VS 2030
- Figure 9:
- VALUE SHARE OF RICE SEED BY BREEDING TECHNOLOGY CATEGORIES, %, GLOBAL, 2017 VS 2023 VS 2030
- Figure 10:
- VOLUME OF RICE SEED BY HYBRIDS CATEGORIES, METRIC TON, GLOBAL, 2017 - 2030
- Figure 11:
- VALUE OF RICE SEED BY HYBRIDS CATEGORIES, USD, GLOBAL, 2017 - 2030
- Figure 12:
- VOLUME SHARE OF RICE SEED BY HYBRIDS CATEGORIES, %, GLOBAL, 2017 VS 2023 VS 2030
- Figure 13:
- VALUE SHARE OF RICE SEED BY HYBRIDS CATEGORIES, %, GLOBAL, 2017 VS 2023 VS 2030
- Figure 14:
- VOLUME OF NON-TRANSGENIC HYBRIDS RICE SEED, METRIC TON, GLOBAL, 2017 - 2030
- Figure 15:
- VALUE OF NON-TRANSGENIC HYBRIDS RICE SEED, USD, GLOBAL, 2017 - 2030
- Figure 16:
- VALUE SHARE OF NON-TRANSGENIC HYBRIDS RICE SEED BY COUNTRY, %, GLOBAL, 2023 AND 2030
- Figure 17:
- VOLUME OF RICE SEED BY TRANSGENIC HYBRIDS CATEGORIES, METRIC TON, GLOBAL, 2017 - 2030
- Figure 18:
- VALUE OF RICE SEED BY TRANSGENIC HYBRIDS CATEGORIES, USD, GLOBAL, 2017 - 2030
- Figure 19:
- VOLUME SHARE OF RICE SEED BY TRANSGENIC HYBRIDS CATEGORIES, %, GLOBAL, 2017 VS 2023 VS 2030
- Figure 20:
- VALUE SHARE OF RICE SEED BY TRANSGENIC HYBRIDS CATEGORIES, %, GLOBAL, 2017 VS 2023 VS 2030
- Figure 21:
- VOLUME OF HERBICIDE TOLERANT HYBRIDS RICE SEED, METRIC TON, GLOBAL, 2017 - 2030
- Figure 22:
- VALUE OF HERBICIDE TOLERANT HYBRIDS RICE SEED, USD, GLOBAL, 2017 - 2030
- Figure 23:
- VALUE SHARE OF HERBICIDE TOLERANT HYBRIDS RICE SEED BY COUNTRY, %, GLOBAL, 2023 AND 2030
- Figure 24:
- VOLUME OF INSECT RESISTANT HYBRIDS RICE SEED, METRIC TON, GLOBAL, 2017 - 2030
- Figure 25:
- VALUE OF INSECT RESISTANT HYBRIDS RICE SEED, USD, GLOBAL, 2017 - 2030
- Figure 26:
- VALUE SHARE OF INSECT RESISTANT HYBRIDS RICE SEED BY COUNTRY, %, GLOBAL, 2023 AND 2030
- Figure 27:
- VOLUME OF OTHER TRAITS RICE SEED, METRIC TON, GLOBAL, 2017 - 2030
- Figure 28:
- VALUE OF OTHER TRAITS RICE SEED, USD, GLOBAL, 2017 - 2030
- Figure 29:
- VALUE SHARE OF OTHER TRAITS RICE SEED BY COUNTRY, %, GLOBAL, 2023 AND 2030
- Figure 30:
- VOLUME OF OPEN POLLINATED VARIETIES & HYBRID DERIVATIVES RICE SEED, METRIC TON, GLOBAL, 2017 - 2030
- Figure 31:
- VALUE OF OPEN POLLINATED VARIETIES & HYBRID DERIVATIVES RICE SEED, USD, GLOBAL, 2017 - 2030
- Figure 32:
- VALUE SHARE OF OPEN POLLINATED VARIETIES & HYBRID DERIVATIVES RICE SEED BY COUNTRY, %, GLOBAL, 2023 AND 2030
- Figure 33:
- VOLUME OF RICE SEED BY REGION, METRIC TON, GLOBAL, 2017 - 2030
- Figure 34:
- VALUE OF RICE SEED BY REGION, USD, GLOBAL, 2017 - 2030
- Figure 35:
- VOLUME SHARE OF RICE SEED BY REGION, %, GLOBAL, 2017 VS 2023 VS 2030
- Figure 36:
- VALUE SHARE OF RICE SEED BY REGION, %, GLOBAL, 2017 VS 2023 VS 2030
- Figure 37:
- VOLUME OF RICE SEED BY BREEDING TECHNOLOGY CATEGORIES, METRIC TON, AFRICA, 2017 - 2030
- Figure 38:
- VALUE OF RICE SEED BY BREEDING TECHNOLOGY CATEGORIES, USD, AFRICA, 2017 - 2030
- Figure 39:
- VOLUME SHARE OF RICE SEED BY BREEDING TECHNOLOGY CATEGORIES, %, AFRICA, 2017 VS 2023 VS 2030
- Figure 40:
- VALUE SHARE OF RICE SEED BY BREEDING TECHNOLOGY CATEGORIES, %, AFRICA, 2017 VS 2023 VS 2030
- Figure 41:
- VOLUME OF RICE SEED BY COUNTRY, METRIC TON, AFRICA, 2017 - 2030
- Figure 42:
- VALUE OF RICE SEED BY COUNTRY, USD, AFRICA, 2017 - 2030
- Figure 43:
- VOLUME SHARE OF RICE SEED BY COUNTRY, %, AFRICA, 2017 VS 2023 VS 2030
- Figure 44:
- VALUE SHARE OF RICE SEED BY COUNTRY, %, AFRICA, 2017 VS 2023 VS 2030
- Figure 45:
- VOLUME OF EGYPT RICE SEED, METRIC TON, AFRICA, 2017 - 2030
- Figure 46:
- VALUE OF EGYPT RICE SEED, USD, AFRICA, 2017 - 2030
- Figure 47:
- VALUE SHARE OF EGYPT RICE SEED BY BREEDING TECHNOLOGY, %, AFRICA, 2023 AND 2030
- Figure 48:
- VOLUME OF ETHIOPIA RICE SEED, METRIC TON, AFRICA, 2017 - 2030
- Figure 49:
- VALUE OF ETHIOPIA RICE SEED, USD, AFRICA, 2017 - 2030
- Figure 50:
- VALUE SHARE OF ETHIOPIA RICE SEED BY BREEDING TECHNOLOGY, %, AFRICA, 2023 AND 2030
- Figure 51:
- VOLUME OF GHANA RICE SEED, METRIC TON, AFRICA, 2017 - 2030
- Figure 52:
- VALUE OF GHANA RICE SEED, USD, AFRICA, 2017 - 2030
- Figure 53:
- VALUE SHARE OF GHANA RICE SEED BY BREEDING TECHNOLOGY, %, AFRICA, 2023 AND 2030
- Figure 54:
- VOLUME OF KENYA RICE SEED, METRIC TON, AFRICA, 2017 - 2030
- Figure 55:
- VALUE OF KENYA RICE SEED, USD, AFRICA, 2017 - 2030
- Figure 56:
- VALUE SHARE OF KENYA RICE SEED BY BREEDING TECHNOLOGY, %, AFRICA, 2023 AND 2030
- Figure 57:
- VOLUME OF NIGERIA RICE SEED, METRIC TON, AFRICA, 2017 - 2030
- Figure 58:
- VALUE OF NIGERIA RICE SEED, USD, AFRICA, 2017 - 2030
- Figure 59:
- VALUE SHARE OF NIGERIA RICE SEED BY BREEDING TECHNOLOGY, %, AFRICA, 2023 AND 2030
- Figure 60:
- VOLUME OF SOUTH AFRICA RICE SEED, METRIC TON, AFRICA, 2017 - 2030
- Figure 61:
- VALUE OF SOUTH AFRICA RICE SEED, USD, AFRICA, 2017 - 2030
- Figure 62:
- VALUE SHARE OF SOUTH AFRICA RICE SEED BY BREEDING TECHNOLOGY, %, AFRICA, 2023 AND 2030
- Figure 63:
- VOLUME OF TANZANIA RICE SEED, METRIC TON, AFRICA, 2017 - 2030
- Figure 64:
- VALUE OF TANZANIA RICE SEED, USD, AFRICA, 2017 - 2030
- Figure 65:
- VALUE SHARE OF TANZANIA RICE SEED BY BREEDING TECHNOLOGY, %, AFRICA, 2023 AND 2030
- Figure 66:
- VOLUME OF REST OF AFRICA RICE SEED, METRIC TON, AFRICA, 2017 - 2030
- Figure 67:
- VALUE OF REST OF AFRICA RICE SEED, USD, AFRICA, 2017 - 2030
- Figure 68:
- VALUE SHARE OF REST OF AFRICA RICE SEED BY BREEDING TECHNOLOGY, %, AFRICA, 2023 AND 2030
- Figure 69:
- VOLUME OF RICE SEED BY BREEDING TECHNOLOGY CATEGORIES, METRIC TON, ASIA-PACIFIC, 2017 - 2030
- Figure 70:
- VALUE OF RICE SEED BY BREEDING TECHNOLOGY CATEGORIES, USD, ASIA-PACIFIC, 2017 - 2030
- Figure 71:
- VOLUME SHARE OF RICE SEED BY BREEDING TECHNOLOGY CATEGORIES, %, ASIA-PACIFIC, 2017 VS 2023 VS 2030
- Figure 72:
- VALUE SHARE OF RICE SEED BY BREEDING TECHNOLOGY CATEGORIES, %, ASIA-PACIFIC, 2017 VS 2023 VS 2030
- Figure 73:
- VOLUME OF RICE SEED BY COUNTRY, METRIC TON, ASIA-PACIFIC, 2017 - 2030
- Figure 74:
- VALUE OF RICE SEED BY COUNTRY, USD, ASIA-PACIFIC, 2017 - 2030
- Figure 75:
- VOLUME SHARE OF RICE SEED BY COUNTRY, %, ASIA-PACIFIC, 2017 VS 2023 VS 2030
- Figure 76:
- VALUE SHARE OF RICE SEED BY COUNTRY, %, ASIA-PACIFIC, 2017 VS 2023 VS 2030
- Figure 77:
- VOLUME OF AUSTRALIA RICE SEED, METRIC TON, ASIA-PACIFIC, 2017 - 2030
- Figure 78:
- VALUE OF AUSTRALIA RICE SEED, USD, ASIA-PACIFIC, 2017 - 2030
- Figure 79:
- VALUE SHARE OF AUSTRALIA RICE SEED BY BREEDING TECHNOLOGY, %, ASIA-PACIFIC, 2023 AND 2030
- Figure 80:
- VOLUME OF BANGLADESH RICE SEED, METRIC TON, ASIA-PACIFIC, 2017 - 2030
- Figure 81:
- VALUE OF BANGLADESH RICE SEED, USD, ASIA-PACIFIC, 2017 - 2030
- Figure 82:
- VALUE SHARE OF BANGLADESH RICE SEED BY BREEDING TECHNOLOGY, %, ASIA-PACIFIC, 2023 AND 2030
- Figure 83:
- VOLUME OF CHINA RICE SEED, METRIC TON, ASIA-PACIFIC, 2017 - 2030
- Figure 84:
- VALUE OF CHINA RICE SEED, USD, ASIA-PACIFIC, 2017 - 2030
- Figure 85:
- VALUE SHARE OF CHINA RICE SEED BY BREEDING TECHNOLOGY, %, ASIA-PACIFIC, 2023 AND 2030
- Figure 86:
- VOLUME OF INDIA RICE SEED, METRIC TON, ASIA-PACIFIC, 2017 - 2030
- Figure 87:
- VALUE OF INDIA RICE SEED, USD, ASIA-PACIFIC, 2017 - 2030
- Figure 88:
- VALUE SHARE OF INDIA RICE SEED BY BREEDING TECHNOLOGY, %, ASIA-PACIFIC, 2023 AND 2030
- Figure 89:
- VOLUME OF INDONESIA RICE SEED, METRIC TON, ASIA-PACIFIC, 2017 - 2030
- Figure 90:
- VALUE OF INDONESIA RICE SEED, USD, ASIA-PACIFIC, 2017 - 2030
- Figure 91:
- VALUE SHARE OF INDONESIA RICE SEED BY BREEDING TECHNOLOGY, %, ASIA-PACIFIC, 2023 AND 2030
- Figure 92:
- VOLUME OF JAPAN RICE SEED, METRIC TON, ASIA-PACIFIC, 2017 - 2030
- Figure 93:
- VALUE OF JAPAN RICE SEED, USD, ASIA-PACIFIC, 2017 - 2030
- Figure 94:
- VALUE SHARE OF JAPAN RICE SEED BY BREEDING TECHNOLOGY, %, ASIA-PACIFIC, 2023 AND 2030
- Figure 95:
- VOLUME OF MYANMAR RICE SEED, METRIC TON, ASIA-PACIFIC, 2017 - 2030
- Figure 96:
- VALUE OF MYANMAR RICE SEED, USD, ASIA-PACIFIC, 2017 - 2030
- Figure 97:
- VALUE SHARE OF MYANMAR RICE SEED BY BREEDING TECHNOLOGY, %, ASIA-PACIFIC, 2023 AND 2030
- Figure 98:
- VOLUME OF PAKISTAN RICE SEED, METRIC TON, ASIA-PACIFIC, 2017 - 2030
- Figure 99:
- VALUE OF PAKISTAN RICE SEED, USD, ASIA-PACIFIC, 2017 - 2030
- Figure 100:
- VALUE SHARE OF PAKISTAN RICE SEED BY BREEDING TECHNOLOGY, %, ASIA-PACIFIC, 2023 AND 2030
- Figure 101:
- VOLUME OF PHILIPPINES RICE SEED, METRIC TON, ASIA-PACIFIC, 2017 - 2030
- Figure 102:
- VALUE OF PHILIPPINES RICE SEED, USD, ASIA-PACIFIC, 2017 - 2030
- Figure 103:
- VALUE SHARE OF PHILIPPINES RICE SEED BY BREEDING TECHNOLOGY, %, ASIA-PACIFIC, 2023 AND 2030
- Figure 104:
- VOLUME OF THAILAND RICE SEED, METRIC TON, ASIA-PACIFIC, 2017 - 2030
- Figure 105:
- VALUE OF THAILAND RICE SEED, USD, ASIA-PACIFIC, 2017 - 2030
- Figure 106:
- VALUE SHARE OF THAILAND RICE SEED BY BREEDING TECHNOLOGY, %, ASIA-PACIFIC, 2023 AND 2030
- Figure 107:
- VOLUME OF VIETNAM RICE SEED, METRIC TON, ASIA-PACIFIC, 2017 - 2030
- Figure 108:
- VALUE OF VIETNAM RICE SEED, USD, ASIA-PACIFIC, 2017 - 2030
- Figure 109:
- VALUE SHARE OF VIETNAM RICE SEED BY BREEDING TECHNOLOGY, %, ASIA-PACIFIC, 2023 AND 2030
- Figure 110:
- VOLUME OF REST OF ASIA-PACIFIC RICE SEED, METRIC TON, ASIA-PACIFIC, 2017 - 2030
- Figure 111:
- VALUE OF REST OF ASIA-PACIFIC RICE SEED, USD, ASIA-PACIFIC, 2017 - 2030
- Figure 112:
- VALUE SHARE OF REST OF ASIA-PACIFIC RICE SEED BY BREEDING TECHNOLOGY, %, ASIA-PACIFIC, 2023 AND 2030
- Figure 113:
- VOLUME OF RICE SEED BY BREEDING TECHNOLOGY CATEGORIES, METRIC TON, EUROPE, 2017 - 2030
- Figure 114:
- VALUE OF RICE SEED BY BREEDING TECHNOLOGY CATEGORIES, USD, EUROPE, 2017 - 2030
- Figure 115:
- VOLUME SHARE OF RICE SEED BY BREEDING TECHNOLOGY CATEGORIES, %, EUROPE, 2017 VS 2023 VS 2030
- Figure 116:
- VALUE SHARE OF RICE SEED BY BREEDING TECHNOLOGY CATEGORIES, %, EUROPE, 2017 VS 2023 VS 2030
- Figure 117:
- VOLUME OF RICE SEED BY COUNTRY, METRIC TON, EUROPE, 2017 - 2030
- Figure 118:
- VALUE OF RICE SEED BY COUNTRY, USD, EUROPE, 2017 - 2030
- Figure 119:
- VOLUME SHARE OF RICE SEED BY COUNTRY, %, EUROPE, 2017 VS 2023 VS 2030
- Figure 120:
- VALUE SHARE OF RICE SEED BY COUNTRY, %, EUROPE, 2017 VS 2023 VS 2030
- Figure 121:
- VOLUME OF FRANCE RICE SEED, METRIC TON, EUROPE, 2017 - 2030
- Figure 122:
- VALUE OF FRANCE RICE SEED, USD, EUROPE, 2017 - 2030
- Figure 123:
- VALUE SHARE OF FRANCE RICE SEED BY BREEDING TECHNOLOGY, %, EUROPE, 2023 AND 2030
- Figure 124:
- VOLUME OF ITALY RICE SEED, METRIC TON, EUROPE, 2017 - 2030
- Figure 125:
- VALUE OF ITALY RICE SEED, USD, EUROPE, 2017 - 2030
- Figure 126:
- VALUE SHARE OF ITALY RICE SEED BY BREEDING TECHNOLOGY, %, EUROPE, 2023 AND 2030
- Figure 127:
- VOLUME OF ROMANIA RICE SEED, METRIC TON, EUROPE, 2017 - 2030
- Figure 128:
- VALUE OF ROMANIA RICE SEED, USD, EUROPE, 2017 - 2030
- Figure 129:
- VALUE SHARE OF ROMANIA RICE SEED BY BREEDING TECHNOLOGY, %, EUROPE, 2023 AND 2030
- Figure 130:
- VOLUME OF RUSSIA RICE SEED, METRIC TON, EUROPE, 2017 - 2030
- Figure 131:
- VALUE OF RUSSIA RICE SEED, USD, EUROPE, 2017 - 2030
- Figure 132:
- VALUE SHARE OF RUSSIA RICE SEED BY BREEDING TECHNOLOGY, %, EUROPE, 2023 AND 2030
- Figure 133:
- VOLUME OF SPAIN RICE SEED, METRIC TON, EUROPE, 2017 - 2030
- Figure 134:
- VALUE OF SPAIN RICE SEED, USD, EUROPE, 2017 - 2030
- Figure 135:
- VALUE SHARE OF SPAIN RICE SEED BY BREEDING TECHNOLOGY, %, EUROPE, 2023 AND 2030
- Figure 136:
- VOLUME OF TURKEY RICE SEED, METRIC TON, EUROPE, 2017 - 2030
- Figure 137:
- VALUE OF TURKEY RICE SEED, USD, EUROPE, 2017 - 2030
- Figure 138:
- VALUE SHARE OF TURKEY RICE SEED BY BREEDING TECHNOLOGY, %, EUROPE, 2023 AND 2030
- Figure 139:
- VOLUME OF UKRAINE RICE SEED, METRIC TON, EUROPE, 2017 - 2030
- Figure 140:
- VALUE OF UKRAINE RICE SEED, USD, EUROPE, 2017 - 2030
- Figure 141:
- VALUE SHARE OF UKRAINE RICE SEED BY BREEDING TECHNOLOGY, %, EUROPE, 2023 AND 2030
- Figure 142:
- VOLUME OF REST OF EUROPE RICE SEED, METRIC TON, EUROPE, 2017 - 2030
- Figure 143:
- VALUE OF REST OF EUROPE RICE SEED, USD, EUROPE, 2017 - 2030
- Figure 144:
- VALUE SHARE OF REST OF EUROPE RICE SEED BY BREEDING TECHNOLOGY, %, EUROPE, 2023 AND 2030
- Figure 145:
- VOLUME OF RICE SEED BY BREEDING TECHNOLOGY CATEGORIES, METRIC TON, MIDDLE EAST, 2017 - 2030
- Figure 146:
- VALUE OF RICE SEED BY BREEDING TECHNOLOGY CATEGORIES, USD, MIDDLE EAST, 2017 - 2030
- Figure 147:
- VOLUME SHARE OF RICE SEED BY BREEDING TECHNOLOGY CATEGORIES, %, MIDDLE EAST, 2017 VS 2023 VS 2030
- Figure 148:
- VALUE SHARE OF RICE SEED BY BREEDING TECHNOLOGY CATEGORIES, %, MIDDLE EAST, 2017 VS 2023 VS 2030
- Figure 149:
- VOLUME OF RICE SEED BY COUNTRY, METRIC TON, MIDDLE EAST, 2017 - 2030
- Figure 150:
- VALUE OF RICE SEED BY COUNTRY, USD, MIDDLE EAST, 2017 - 2030
- Figure 151:
- VOLUME SHARE OF RICE SEED BY COUNTRY, %, MIDDLE EAST, 2017 VS 2023 VS 2030
- Figure 152:
- VALUE SHARE OF RICE SEED BY COUNTRY, %, MIDDLE EAST, 2017 VS 2023 VS 2030
- Figure 153:
- VOLUME OF IRAN RICE SEED, METRIC TON, MIDDLE EAST, 2017 - 2030
- Figure 154:
- VALUE OF IRAN RICE SEED, USD, MIDDLE EAST, 2017 - 2030
- Figure 155:
- VALUE SHARE OF IRAN RICE SEED BY BREEDING TECHNOLOGY, %, MIDDLE EAST, 2023 AND 2030
- Figure 156:
- VOLUME OF REST OF MIDDLE EAST RICE SEED, METRIC TON, MIDDLE EAST, 2017 - 2030
- Figure 157:
- VALUE OF REST OF MIDDLE EAST RICE SEED, USD, MIDDLE EAST, 2017 - 2030
- Figure 158:
- VALUE SHARE OF REST OF MIDDLE EAST RICE SEED BY BREEDING TECHNOLOGY, %, MIDDLE EAST, 2023 AND 2030
- Figure 159:
- VOLUME OF RICE SEED BY BREEDING TECHNOLOGY CATEGORIES, METRIC TON, NORTH AMERICA, 2017 - 2030
- Figure 160:
- VALUE OF RICE SEED BY BREEDING TECHNOLOGY CATEGORIES, USD, NORTH AMERICA, 2017 - 2030
- Figure 161:
- VOLUME SHARE OF RICE SEED BY BREEDING TECHNOLOGY CATEGORIES, %, NORTH AMERICA, 2017 VS 2023 VS 2030
- Figure 162:
- VALUE SHARE OF RICE SEED BY BREEDING TECHNOLOGY CATEGORIES, %, NORTH AMERICA, 2017 VS 2023 VS 2030
- Figure 163:
- VOLUME OF RICE SEED BY COUNTRY, METRIC TON, NORTH AMERICA, 2017 - 2030
- Figure 164:
- VALUE OF RICE SEED BY COUNTRY, USD, NORTH AMERICA, 2017 - 2030
- Figure 165:
- VOLUME SHARE OF RICE SEED BY COUNTRY, %, NORTH AMERICA, 2017 VS 2023 VS 2030
- Figure 166:
- VALUE SHARE OF RICE SEED BY COUNTRY, %, NORTH AMERICA, 2017 VS 2023 VS 2030
- Figure 167:
- VOLUME OF MEXICO RICE SEED, METRIC TON, NORTH AMERICA, 2017 - 2030
- Figure 168:
- VALUE OF MEXICO RICE SEED, USD, NORTH AMERICA, 2017 - 2030
- Figure 169:
- VALUE SHARE OF MEXICO RICE SEED BY BREEDING TECHNOLOGY, %, NORTH AMERICA, 2023 AND 2030
- Figure 170:
- VOLUME OF UNITED STATES RICE SEED, METRIC TON, NORTH AMERICA, 2017 - 2030
- Figure 171:
- VALUE OF UNITED STATES RICE SEED, USD, NORTH AMERICA, 2017 - 2030
- Figure 172:
- VALUE SHARE OF UNITED STATES RICE SEED BY BREEDING TECHNOLOGY, %, NORTH AMERICA, 2023 AND 2030
- Figure 173:
- VOLUME OF REST OF NORTH AMERICA RICE SEED, METRIC TON, NORTH AMERICA, 2017 - 2030
- Figure 174:
- VALUE OF REST OF NORTH AMERICA RICE SEED, USD, NORTH AMERICA, 2017 - 2030
- Figure 175:
- VALUE SHARE OF REST OF NORTH AMERICA RICE SEED BY BREEDING TECHNOLOGY, %, NORTH AMERICA, 2023 AND 2030
- Figure 176:
- VOLUME OF RICE SEED BY BREEDING TECHNOLOGY CATEGORIES, METRIC TON, SOUTH AMERICA, 2017 - 2030
- Figure 177:
- VALUE OF RICE SEED BY BREEDING TECHNOLOGY CATEGORIES, USD, SOUTH AMERICA, 2017 - 2030
- Figure 178:
- VOLUME SHARE OF RICE SEED BY BREEDING TECHNOLOGY CATEGORIES, %, SOUTH AMERICA, 2017 VS 2023 VS 2030
- Figure 179:
- VALUE SHARE OF RICE SEED BY BREEDING TECHNOLOGY CATEGORIES, %, SOUTH AMERICA, 2017 VS 2023 VS 2030
- Figure 180:
- VOLUME OF RICE SEED BY COUNTRY, METRIC TON, SOUTH AMERICA, 2017 - 2030
- Figure 181:
- VALUE OF RICE SEED BY COUNTRY, USD, SOUTH AMERICA, 2017 - 2030
- Figure 182:
- VOLUME SHARE OF RICE SEED BY COUNTRY, %, SOUTH AMERICA, 2017 VS 2023 VS 2030
- Figure 183:
- VALUE SHARE OF RICE SEED BY COUNTRY, %, SOUTH AMERICA, 2017 VS 2023 VS 2030
- Figure 184:
- VOLUME OF ARGENTINA RICE SEED, METRIC TON, SOUTH AMERICA, 2017 - 2030
- Figure 185:
- VALUE OF ARGENTINA RICE SEED, USD, SOUTH AMERICA, 2017 - 2030
- Figure 186:
- VALUE SHARE OF ARGENTINA RICE SEED BY BREEDING TECHNOLOGY, %, SOUTH AMERICA, 2023 AND 2030
- Figure 187:
- VOLUME OF BRAZIL RICE SEED, METRIC TON, SOUTH AMERICA, 2017 - 2030
- Figure 188:
- VALUE OF BRAZIL RICE SEED, USD, SOUTH AMERICA, 2017 - 2030
- Figure 189:
- VALUE SHARE OF BRAZIL RICE SEED BY BREEDING TECHNOLOGY, %, SOUTH AMERICA, 2023 AND 2030
- Figure 190:
- VOLUME OF REST OF SOUTH AMERICA RICE SEED, METRIC TON, SOUTH AMERICA, 2017 - 2030
- Figure 191:
- VALUE OF REST OF SOUTH AMERICA RICE SEED, USD, SOUTH AMERICA, 2017 - 2030
- Figure 192:
- VALUE SHARE OF REST OF SOUTH AMERICA RICE SEED BY BREEDING TECHNOLOGY, %, SOUTH AMERICA, 2023 AND 2030
- Figure 193:
- MOST ACTIVE COMPANIES BY NUMBER OF STRATEGIC MOVES, COUNT, GLOBAL, 2017-2023
- Figure 194:
- MOST ADOPTED STRATEGIES, COUNT, GLOBAL, 2017-2023
- Figure 195:
- VALUE SHARE OF MAJOR PLAYERS, %, GLOBAL
Rice Seed Industry Segmentation
Hybrids, Open Pollinated Varieties & Hybrid Derivatives are covered as segments by Breeding Technology. Africa, Asia-Pacific, Europe, Middle East, North America, South America are covered as segments by Region.| Breeding Technology | Hybrids | Non-Transgenic Hybrids | ||
| Transgenic Hybrids | Herbicide Tolerant Hybrids | |||
| Insect Resistant Hybrids | ||||
| Other Traits | ||||
| Open Pollinated Varieties & Hybrid Derivatives | ||||
| Region | Africa | By Breeding Technology | ||
| By Country | Egypt | |||
| Ethiopia | ||||
| Ghana | ||||
| Kenya | ||||
| Nigeria | ||||
| South Africa | ||||
| Tanzania | ||||
| Rest of Africa | ||||
| Asia-Pacific | By Breeding Technology | |||
| Australia | ||||
| Bangladesh | ||||
| China | ||||
| India | ||||
| Indonesia | ||||
| Japan | ||||
| Myanmar | ||||
| Pakistan | ||||
| Philippines | ||||
| Thailand | ||||
| Vietnam | ||||
| Rest of Asia-Pacific | ||||
| Europe | By Breeding Technology | |||
| France | ||||
| Italy | ||||
| Romania | ||||
| Russia | ||||
| Spain | ||||
| Turkey | ||||
| Ukraine | ||||
| Rest of Europe | ||||
| Middle East | By Breeding Technology | |||
| Iran | ||||
| Rest of Middle East | ||||
| North America | By Breeding Technology | |||
| Mexico | ||||
| United States | ||||
| Rest of North America | ||||
| South America | By Breeding Technology | |||
| Argentina | ||||
| Brazil | ||||
| Rest of South America | ||||
Need A Different Region or Segment?
Customize Now
Market Definition
- Commercial Seed - For the purpose of this study, only commercial seeds have been included as part of the scope. Farm-saved Seeds, which are not commercially labeled are excluded from scope, even though a minor percentage of farm-saved seeds are exchanged commercially among farmers. The scope also excludes vegetatively reproduced crops and plant parts, which may be commercially sold in the market.
- Crop Acreage - While calculating the acreage under different crops, the Gross Cropped Area has been considered. Also known as Area Harvested, according to the Food & Agricultural Organization (FAO), this includes the total area cultivated under a particular crop across seasons.
- Seed Replacement Rate - Seed Replacement Rate is the percentage of area sown out of the total area of crop planted in the season by using certified/quality seeds other than the farm-saved seed.
- Protected Cultivation - The report defines protected cultivation as the process of growing crops in a controlled environment. This includes greenhouses, glasshouses, hydroponics, aeroponics, or any other cultivation system that protects the crop against any abiotic stress. However, cultivation in an open field using plastic mulch is excluded from this definition and is included under open field.
| Keyword | Definition |
|---|---|
| Row Crops | These are usually the field crops which include the different crop categories like grains & cereals, oilseeds, fiber crops like cotton, pulses, and forage crops. |
| Solanaceae | These are the family of flowering plants which includes tomato, chili, eggplants, and other crops. |
| Cucurbits | It represents a gourd family consisting of about 965 species in around 95 genera. The major crops considered for this study include Cucumber & Gherkin, Pumpkin and squash, and other crops. |
| Brassicas | It is a genus of plants in the cabbage and mustard family. It includes crops such as carrots, cabbage, cauliflower & broccoli. |
| Roots & Bulbs | The roots and bulbs segment includes onion, garlic, potato, and other crops. |
| Unclassified Vegetables | This segment in the report includes the crops which don’t belong to any of the above-mentioned categories. These include crops such as okra, asparagus, lettuce, peas, spinach, and others. |
| Hybrid Seed | It is the first generation of the seed produced by controlling cross-pollination and by combining two or more varieties, or species. |
| Transgenic Seed | It is a seed that is genetically modified to contain certain desirable input and/or output traits. |
| Non-Transgenic Seed | The seed produced through cross-pollination without any genetic modification. |
| Open-Pollinated Varieties & Hybrid Derivatives | Open-pollinated varieties produce seeds true to type as they cross-pollinate only with other plants of the same variety. |
| Other Solanaceae | The crops considered under other Solanaceae include bell peppers and other different peppers based on the locality of the respective countries. |
| Other Brassicaceae | The crops considered under other brassicas include radishes, turnips, Brussels sprouts, and kale. |
| Other Roots & Bulbs | The crops considered under other roots & bulbs include Sweet Potatoes and cassava. |
| Other Cucurbits | The crops considered under other cucurbits include gourds (bottle gourd, bitter gourd, ridge gourd, Snake gourd, and others). |
| Other Grains & Cereals | The crops considered under other grains & cereals include Barley, Buck Wheat, Canary Seed, Triticale, Oats, Millets, and Rye. |
| Other Fibre Crops | The crops considered under other fibers include Hemp, Jute, Agave fibers, Flax, Kenaf, Ramie, Abaca, Sisal, and Kapok. |
| Other Oilseeds | The crops considered under other oilseeds include Ground nut, Hempseed, Mustard seed, Castor seeds, safflower seeds, Sesame seeds, and Linseeds. |
| Other Forage Crops | The crops considered under other forages include Napier grass, Oat grass, White clover, Ryegrass, and Timothy. Other forage crops were considered based on the locality of the respective countries. |
| Pulses | Pigeon peas, Lentils, Broad and horse beans, Vetches, Chickpeas, Cowpeas, Lupins, and Bambara beans are the crops considered under pulses. |
| Other Unclassified Vegetables | The crops considered under other unclassified vegetables include Artichokes, Cassava Leaves, Leeks, Chicory, and String beans. |
Need More Details on Market Definition?
Ask a Question
Research Methodology
Mordor Intelligence follows a four-step methodology in all our reports.
- Step-1: IDENTIFY KEY VARIABLES: In order to build a robust forecasting methodology, the variables and factors identified in Step-1 are tested against available historical market numbers. Through an iterative process, the variables required for market forecast are set and the model is built on the basis of these variables.
- Step-2: Build a Market Model: Market-size estimations for the forecast years are in nominal terms. Inflation is not a part of the pricing, and the average selling price (ASP) is kept constant throughout the forecast period.
- Step-3: Validate and Finalize: In this important step, all market numbers, variables and analyst calls are validated through an extensive network of primary research experts from the market studied. The respondents are selected across levels and functions to generate a holistic picture of the market studied.
- Step-4: Research Outputs: Syndicated Reports, Custom Consulting Assignments, Databases, and Subscription Platforms

Get More Details On Research Methodology
Download PDF


