| Study Period | 2017 - 2030 |
| Base Year For Estimation | 2024 |
| Forecast Data Period | 2025 - 2030 |
| Market Size (2025) | USD 0.9 Billion |
| Market Size (2030) | USD 1.51 Billion |
| CAGR (2025 - 2030) | 10.74 % |
| Market Concentration | Low |
Major Players*Disclaimer: Major Players sorted in no particular order |

Rhizobium Market Analysis
The Rhizobium Market size is estimated at 0.9 billion USD in 2025, and is expected to reach 1.51 billion USD by 2030, growing at a CAGR of 10.74% during the forecast period (2025-2030).
The agricultural industry is experiencing a significant shift toward sustainable farming practices, with rhizobium biofertilizer emerging as a crucial component of modern agriculture. Rhizobium-based solutions have gained particular prominence due to their ability to fix atmospheric nitrogen, with studies showing they can fix between 40-250 kg of nitrogen per hectare annually. This biological nitrogen fixation capability has become increasingly important as farmers worldwide seek to reduce their dependence on chemical fertilizers while maintaining or improving crop yields. The agricultural sector's focus on sustainability has led to increased investment in research and development of more efficient Rhizobium strains and application methods.
Technological advancements in biological fertilizer production and application have revolutionized the Rhizobium market landscape. Modern formulations can now deliver 50-70% of a crop's total nitrogen requirements, significantly reducing the need for synthetic fertilizers. These innovations have led to improved product stability, longer shelf life, and enhanced effectiveness under various environmental conditions. The integration of precision agriculture techniques with rhizobium biofertilizer applications has enabled farmers to optimize usage and maximize benefits, particularly in leguminous crop production.
Industry collaborations and partnerships have accelerated the development of novel Rhizobium-based solutions. For instance, in 2023, Heliae Agriculture and Rizobacter collaborated to develop innovative soil and crop nutrition technologies, demonstrating the industry's commitment to advancing biological fertilizer solutions. The market has witnessed significant progress in product formulations, with Rhizobium accounting for 25.4% of global biofertilizer consumption in 2022, highlighting its growing acceptance among farmers worldwide. These partnerships have also facilitated knowledge transfer and improved distribution networks, making Rhizobium products more accessible to farmers across different regions.
The environmental and economic benefits of Rhizobium applications have been well-documented through field trials and commercial usage. In Brazil, recent studies have shown that Rhizobium inoculation improved soybean yields by up to 750 kg per hectare while simultaneously enhancing soil fertility. This dual benefit of improved crop yields and soil health has made Rhizobium-based solutions increasingly attractive to farmers transitioning to sustainable agricultural practices. The ability of these beneficial microorganism biofertilizers to reduce chemical nitrogen fertilizer requirements by 30-40% has also positioned them as a cost-effective solution for farmers facing rising input costs while meeting growing environmental regulations.
Global Rhizobium Market Trends
Organic production is at an all-time high in North America and Europe, due to the increasing awareness and Government initiatives.
- Organic agriculture has emerged as a significant contributor to sustainable food systems, with 187 countries practicing it globally. As of 2021, there was 72.3 million ha of organic agricultural land worldwide, with an average increase of 2.9% across all regions from 2018 to 2021. Organic arable land accounted for 14.4 million ha, representing 19.9% of the total organic agricultural land.
- The strongest markets for organic farming are North America and Europe, accounting for 41.0% of the global organic arable land. In 2022, Europe had 6.5 million ha of organic arable land, equivalent to 44.1% of the overall organic arable agricultural area. The most significant crops grown organically in North America and Europe are apples, strawberries, cereals, and olives.
- Developing countries in Asia-Pacific are also joining the organic agriculture movement and becoming self-sufficient in producing and providing fresh organic produce to meet their domestic demand. The trend of organic farming is gaining momentum in Asia-Pacific, with the region recording an 18.8% increase in organic arable land from 2017 to 2022. The major initiatives by governments in the region also play a vital role in the growing trend of organic farming. For example, Japan's Basic Plan for Food, Agriculture, and Rural Areas aims to triple the number of organic farmers and lands by 2030.
- The growth of organic agriculture is driven by the rising awareness of the benefits of organic farming, such as promoting soil health, reducing environmental impacts, and producing healthier food.

Understand The Key Trends Shaping This Market
Download PDF
Per capita spending of organic food majorly observed in United States and Germany, attributed to the consumer demand for healthier and sustainable food
- The organic food market experienced significant growth in the past few years, with global sales reaching USD 120.6 billion in 2020, up from USD 70.8 billion in 2012. The trend toward organic food is being driven by several factors, such as increasing consumer demand for healthier, more sustainable food options and a growing awareness of the environmental impact of conventional agriculture. The global organic food market is expected to continue its growth trend over the coming years.
- According to a survey conducted by the Organic Trade Association in 2021, sales of organic fruits and vegetables increased by around 4.5% in the same year, accounting for 15% of the overall organic sales. North America dominates the market in terms of average spending on organic products, with per capita spending in the United States reaching USD 186.7 in 2021, the highest among all North American countries. Europe is also expected to experience significant growth in the organic food market, with Germany accounting for the highest per capita spending of USD 75.6 in 2021.
- While the organic food market is still dominated by developed countries with high consumer disposable incomes, it is also expected to grow in developing nations. For example, the increasing number of working-class people in the Asia-Pacific region may contribute to the market's expansion due to the growing availability and affordability of organic food products.

Segment Analysis: Crop Type
Row Crops Segment in Rhizobium Market
Row crops dominate the global rhizobium market, accounting for approximately 71% of the total market value in 2024. The segment's prominence is primarily attributed to the extensive cultivation of crops like barley, maize, wheat, rapeseed, rye, sunflower, soybean inoculant, and rice globally. The interaction between rhizobium and legume roots results in a highly regulated process known as nodulation, which converts atmospheric nitrogen into an assimilable plant nutrient. This symbiotic relationship has made nitrogen-fixing biofertilizer particularly valuable for row crop cultivation, especially in North America and Europe, regions which together account for over 40% of the global organic arable land. The segment is also experiencing the fastest growth trajectory, projected to grow at nearly 11% annually from 2024 to 2029, driven by the increasing organic cultivation of field crops and the growing awareness about legume inoculant's ability to reduce overall chemical nitrogen requirements by 20-25% in some crops.
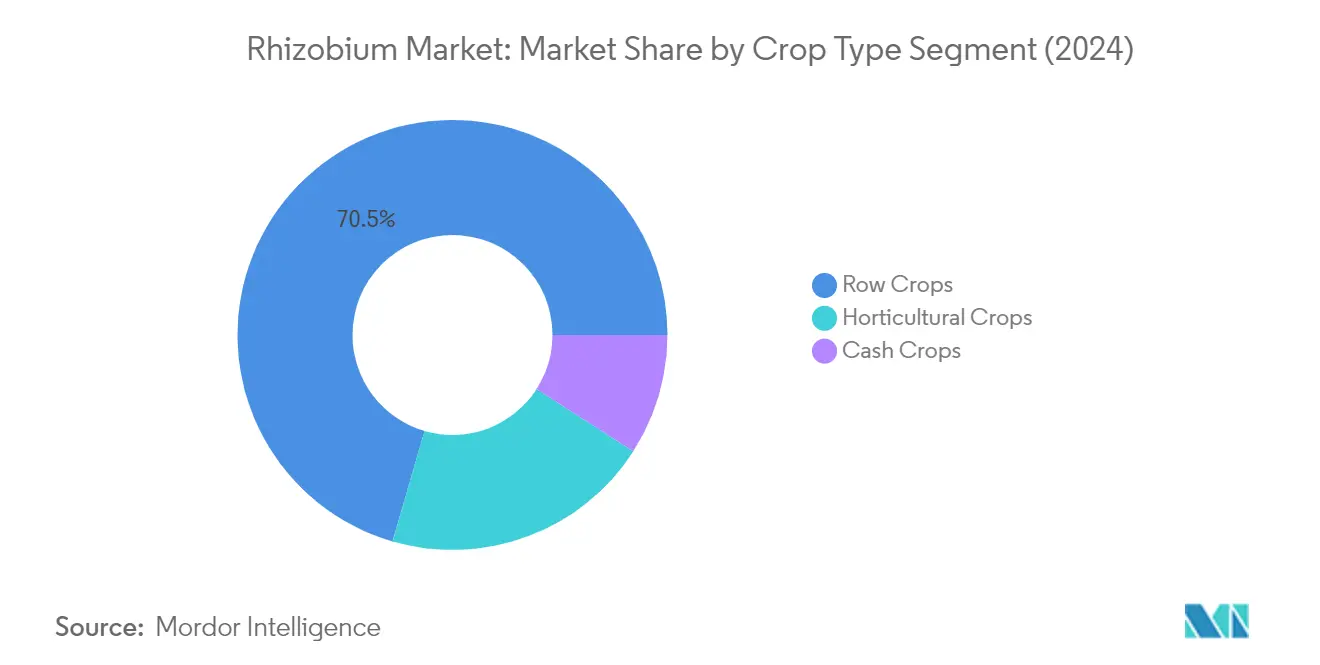
Remaining Segments in Crop Type
The horticultural crops and cash crops segments complete the rhizobium market landscape, each serving distinct agricultural needs. The horticultural segment encompasses various fruits and vegetables, where rhizobium strains colonize the roots of crops like tomato and pepper plants to promote development at various production phases, improving seedling and fruit yield quality. This segment is particularly strong in greenhouse cultivation and other horticultural fruit-growing operations. The cash crops segment, which includes crops like coffee, tea, cocoa, cotton, sugarcane, rapeseed, sunflower, and tobacco, represents a smaller but significant portion of the market. Both segments benefit from rhizobium's ability to enhance nutrient mobilization and alleviate soil moisture stress, contributing to improved crop productivity and sustainable farming practices.
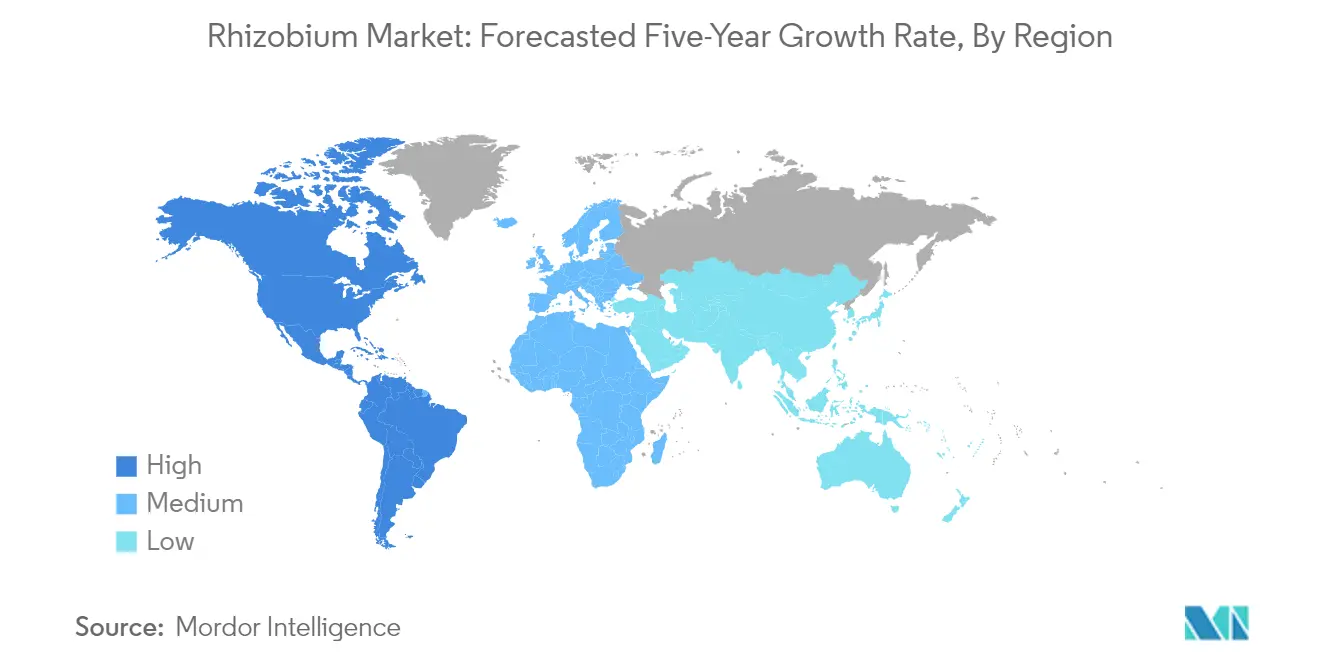
Rhizobium Market Geography Segment Analysis
Rhizobium Market in Africa
The African rhizobium market landscape is characterized by diverse agricultural practices across Egypt, Nigeria, and South Africa. These countries are focusing on sustainable farming practices and organic cultivation methods to reduce dependency on chemical fertilizers. The region's agricultural sector is witnessing a transformation with increasing adoption of rhizobial biofertilizer solutions for crop nutrition, particularly in leguminous crops where rhizobium plays a crucial role in nitrogen fixation.
Rhizobium Market in South Africa
South Africa represents the largest rhizobium market in the African region, with approximately 1% market share in 2024. The country's agricultural sector emphasizes sustainable farming practices, particularly in row crops, which dominate the rhizobium consumption. South Africa's market is driven by increasing awareness among farmers about the negative impacts of chemical fertilizer overuse and the benefits of microbial fertilizer alternatives. The government's support through various agricultural initiatives and subsidies has encouraged farmers to adopt organic farming methods, leading to increased demand for rhizobium-based biofertilizers.
Rhizobium Market in Egypt
Egypt emerges as the fastest-growing market for rhizobium in Africa, with a projected growth rate of approximately 11% from 2024 to 2029. The country's agricultural sector is experiencing a significant shift toward organic farming practices, particularly in fruit and vegetable cultivation. Egypt's favorable climate conditions and increasing focus on sustainable agriculture practices have created optimal conditions for rhizobium application. The government's initiatives to promote organic farming and reduce chemical fertilizer usage have further catalyzed market growth.
Rhizobium Market in Asia-Pacific
The Asia-Pacific region demonstrates a robust market for rhizobium biofertilizers, encompassing diverse agricultural economies from Australia to Vietnam. The region's agricultural sector is experiencing a significant transformation with increasing adoption of organic farming practices. Countries like China, India, and Australia are leading the way in implementing sustainable agricultural practices, while emerging economies such as Thailand, the Philippines, and Vietnam are rapidly advancing in organic farming techniques.
Rhizobium Market in China
China dominates the Asia-Pacific rhizobium market with approximately 94% market share in 2024. The country's vast agricultural landscape and growing emphasis on sustainable farming practices have created a strong demand for rhizobium-based biofertilizers. China's focus on reducing chemical fertilizer usage and improving soil health has led to increased adoption of biological solutions. The country's agricultural policies strongly support the use of rhizobial biofertilizer, particularly in major crops like rice, maize, and wheat.
Rhizobium Market in Thailand
Thailand emerges as the fastest-growing market in the Asia-Pacific region, with a projected growth rate of approximately 10% from 2024 to 2029. The country's agricultural sector is undergoing a significant transformation with an increasing focus on organic farming practices. Thailand's government has implemented various initiatives to promote organic agriculture and sustainable farming practices. The country's favorable climate conditions and growing awareness about the benefits of agricultural biological fertilizers have created optimal conditions for market growth.
Rhizobium Market in Europe
The European rhizobium market is characterized by strong environmental regulations and increasing adoption of sustainable agricultural practices across countries including France, Germany, Italy, the Netherlands, Russia, Spain, Turkey, and the UK. The region's commitment to reducing chemical fertilizer usage and promoting organic farming has created a favorable environment for rhizobium-based biofertilizers. The European Union's policies supporting sustainable agriculture have significantly influenced market growth across member states.
Rhizobium Market in France
France leads the European rhizobium market with approximately 17% market share in 2024. The country's strong agricultural sector and commitment to sustainable farming practices have driven the adoption of rhizobium-based biofertilizers. France's emphasis on reducing chemical fertilizer usage and promoting organic farming has created a robust market for biological solutions. The country's well-established organic farming sector and supportive government policies have contributed to market leadership.
Rhizobium Market in Germany
Germany shows the highest growth potential in Europe with a projected growth rate of approximately 10% from 2024 to 2029. The country's strong focus on environmental sustainability and organic farming has created significant opportunities for rhizobium-based biofertilizers. Germany's agricultural policies strongly support the transition to organic farming methods, with ambitious targets for increasing organic agricultural land. The country's well-developed research and development infrastructure continues to drive innovation in biological fertilizer solutions.
Rhizobium Market in Middle East
The Middle Eastern rhizobium market is evolving with an increasing focus on sustainable agriculture, particularly in Iran and Saudi Arabia. Despite challenging climate conditions, the region is witnessing growing adoption of biological fertilizers. Saudi Arabia leads the market in the region, while Iran shows the fastest growth potential. The region's governments are implementing various initiatives to promote sustainable farming practices and reduce dependency on chemical fertilizers, particularly in areas where water scarcity is a major concern.
Rhizobium Market in North America
The North American rhizobium market is characterized by advanced agricultural practices and strong research infrastructure across the United States, Canada, and Mexico. The region demonstrates high adoption rates of biological solutions in agriculture, supported by robust regulatory frameworks and increasing consumer demand for organically grown products. The United States leads the market and shows the highest growth potential, driven by extensive research and development activities and strong government support for sustainable agriculture practices.
Rhizobium Market in South America
The South American rhizobium market is significantly influenced by the region's extensive agricultural activities, particularly in Argentina and Brazil. The region's favorable climate conditions and large-scale cultivation of leguminous crops create optimal conditions for rhizobium applications. Argentina leads the market in the region, while Brazil shows the fastest growth potential. The increasing adoption of sustainable farming practices and government initiatives supporting organic agriculture continue to drive market growth across the region.
Get Analysis on Important Geographic Markets
Download PDF
Rhizobium Industry Overview
Top Companies in Rhizobium Market
The global rhizobium market is characterized by companies actively pursuing innovation and strategic partnerships to strengthen their market positions. Product development initiatives are primarily focused on enhancing nitrogen-fixing capabilities and improving compatibility with different leguminous crops. Companies are investing significantly in research and development activities, with major players allocating substantial portions of their revenue to develop specialized formulations based on soil types and crop requirements. Strategic collaborations between manufacturers and research institutions have become increasingly common to advance biotechnology solutions. Market leaders are expanding their geographical presence through distribution partnerships while also focusing on organic certifications to meet growing demand for sustainable agricultural solutions. Manufacturing facilities are being strategically placed near shipping docks and raw materials to optimize operational efficiency and reduce costs.
Moderate Fragmentation with Regional Leadership Dynamics
The competitive landscape exhibits moderate fragmentation with a mix of global conglomerates and specialized regional players. Large multinational corporations dominate the market through their extensive research capabilities and established distribution networks, while regional players leverage their local market knowledge and specialized product offerings. The market structure is characterized by the presence of both pure-play biofertilizer rhizobium manufacturers and diversified agricultural input companies that have expanded into the rhizobium segment.
Market consolidation is gradually increasing through strategic acquisitions and partnerships, particularly in emerging markets. Leading companies are acquiring smaller, specialized manufacturers to expand their product portfolios and geographical reach. Regional players are maintaining their competitive edge through customized solutions and strong relationships with local farming communities. The industry is witnessing increased collaboration between established players and biotechnology startups to develop innovative solutions and enhance product effectiveness.
Innovation and Distribution Network Drive Success
Success in the rhizobium market increasingly depends on developing innovative formulations that demonstrate consistent performance across various agricultural conditions. Companies need to invest in advanced research facilities and maintain strong partnerships with agricultural research institutions to develop new strains and improve existing products. Building and maintaining an extensive distribution network, supported by technical expertise to provide guidance to farmers, is becoming crucial for market success. Manufacturers must also focus on obtaining necessary regulatory approvals and organic certifications to meet evolving market requirements.
Market players need to address the growing demand for sustainable agricultural solutions while maintaining competitive pricing. Companies must develop strategies to educate farmers about the benefits of rhizobium-based products and provide comprehensive technical support. The ability to offer customized solutions for different crops and soil conditions will become increasingly important. Future success will also depend on developing efficient production processes to maintain cost competitiveness while meeting stringent quality standards. Companies need to establish strong relationships with agricultural cooperatives and farming communities to ensure steady market penetration and growth. The integration of agricultural biological and agricultural microbial technologies is essential to enhance product effectiveness and sustainability.
Rhizobium Market Leaders
-
Indian Farmers Fertiliser Cooperative Limited
-
Madras Fertilizers Limited
-
National Fertilizers Limited
-
Novozymes
-
Rizobacter
- *Disclaimer: Major Players sorted in no particular order

Need More Details on Market Players and Competiters?
Download PDF
Rhizobium Market News
- July 2022: A brand-new granular inoculant called LALFIX® START SPHERICAL Granule combines Bacillus velezensis, a plant growth-promoting microbe, with two distinct rhizobium strains. This powerful and well-tested PGPM, brand-new to the Canadian market, boosts phosphorus solubilization and improves root mass.
- January 2022: Novozymes and AgroFresh formed a partnership to utilize the potential of biotechnology to continue improving post-harvest quality and reduce food waste. This is an important venture for Novozymes with the company's intention to satisfy increasing consumer demand for fruits and vegetables with less food waste and less impact to the environment
- January 2021: Heliae Agriculture and Rizobacter collaborate to develop Innovative Soil and Crop Nutrition Technologies that will help the company manufacture better and more efficient solutions, enhancing its product portfolio.
Free With This Report
Along with the report, We also offer a comprehensive and exhaustive data pack on Areas under organic cultivation, one of the key trends that affect the market size of agricultural biologicals. This data pack also includes areas under cultivation by crop types, such as Row Crops (Cereals, Pulses, and Oilseeds), Horticultural Crops (Fruits and Vegetables), and Cash Crops in North America, Europe, Asia-Pacific, South America and Africa.


Rhizobium Market Report - Table of Contents
1. EXECUTIVE SUMMARY & KEY FINDINGS
2. REPORT OFFERS
3. INTRODUCTION
- 3.1 Study Assumptions & Market Definition
- 3.2 Scope of the Study
- 3.3 Research Methodology
4. KEY INDUSTRY TRENDS
- 4.1 Area Under Organic Cultivation
- 4.2 Per Capita Spending On Organic Products
-
4.3 Regulatory Framework
- 4.3.1 Argentina
- 4.3.2 Australia
- 4.3.3 Brazil
- 4.3.4 Canada
- 4.3.5 China
- 4.3.6 Egypt
- 4.3.7 France
- 4.3.8 Germany
- 4.3.9 India
- 4.3.10 Indonesia
- 4.3.11 Italy
- 4.3.12 Japan
- 4.3.13 Mexico
- 4.3.14 Netherlands
- 4.3.15 Nigeria
- 4.3.16 Philippines
- 4.3.17 Russia
- 4.3.18 South Africa
- 4.3.19 Spain
- 4.3.20 Thailand
- 4.3.21 Turkey
- 4.3.22 United Kingdom
- 4.3.23 United States
- 4.3.24 Vietnam
- 4.4 Value Chain & Distribution Channel Analysis
5. MARKET SEGMENTATION (includes market size in Value in USD and Volume, Forecasts up to 2030 and analysis of growth prospects)
-
5.1 Crop Type
- 5.1.1 Cash Crops
- 5.1.2 Horticultural Crops
- 5.1.3 Row Crops
-
5.2 Region
- 5.2.1 Africa
- 5.2.1.1 By Country
- 5.2.1.1.1 Egypt
- 5.2.1.1.2 Nigeria
- 5.2.1.1.3 South Africa
- 5.2.1.1.4 Rest of Africa
- 5.2.2 Asia-Pacific
- 5.2.2.1 By Country
- 5.2.2.1.1 Australia
- 5.2.2.1.2 China
- 5.2.2.1.3 India
- 5.2.2.1.4 Indonesia
- 5.2.2.1.5 Japan
- 5.2.2.1.6 Philippines
- 5.2.2.1.7 Thailand
- 5.2.2.1.8 Vietnam
- 5.2.2.1.9 Rest of Asia-Pacific
- 5.2.3 Europe
- 5.2.3.1 By Country
- 5.2.3.1.1 France
- 5.2.3.1.2 Germany
- 5.2.3.1.3 Italy
- 5.2.3.1.4 Netherlands
- 5.2.3.1.5 Russia
- 5.2.3.1.6 Spain
- 5.2.3.1.7 Turkey
- 5.2.3.1.8 United Kingdom
- 5.2.3.1.9 Rest of Europe
- 5.2.4 Middle East
- 5.2.4.1 By Country
- 5.2.4.1.1 Iran
- 5.2.4.1.2 Saudi Arabia
- 5.2.4.1.3 Rest of Middle East
- 5.2.5 North America
- 5.2.5.1 By Country
- 5.2.5.1.1 Canada
- 5.2.5.1.2 Mexico
- 5.2.5.1.3 United States
- 5.2.5.1.4 Rest of North America
- 5.2.6 South America
- 5.2.6.1 By Country
- 5.2.6.1.1 Argentina
- 5.2.6.1.2 Brazil
- 5.2.6.1.3 Rest of South America
6. COMPETITIVE LANDSCAPE
- 6.1 Key Strategic Moves
- 6.2 Market Share Analysis
- 6.3 Company Landscape
-
6.4 Company Profiles (includes Global Level Overview, Market Level Overview, Core Business Segments, Financials, Headcount, Key Information, Market Rank, Market Share, Products and Services, and Analysis of Recent Developments).
- 6.4.1 Indian Farmers Fertiliser Cooperative Limited
- 6.4.2 Indogulf BioAg LLC (Biotech Division of Indogulf Company)
- 6.4.3 IPL Biologicals Limited
- 6.4.4 Lallemand Inc.
- 6.4.5 Madras Fertilizers Limited
- 6.4.6 National Fertilizers Limited
- 6.4.7 Novozymes
- 6.4.8 Rizobacter
- 6.4.9 T Stanes and Company Limited
- 6.4.10 Vittia Group
7. KEY STRATEGIC QUESTIONS FOR AGRICULTURAL BIOLOGICALS CEOS
8. APPENDIX
-
8.1 Global Overview
- 8.1.1 Overview
- 8.1.2 Porter’s Five Forces Framework
- 8.1.3 Global Value Chain Analysis
- 8.1.4 Market Dynamics (DROs)
- 8.2 Sources & References
- 8.3 List of Tables & Figures
- 8.4 Primary Insights
- 8.5 Data Pack
- 8.6 Glossary of Terms
You Can Purchase Parts Of This Report. Check Out Prices For Specific Sections
Get Price Break-up Now
List of Tables & Figures
- Figure 1:
- AREA UNDER ORGANIC CULTIVATION IN HECTARES, GLOBAL, 2017 - 2022
- Figure 2:
- PER CAPITA SPENDING ON ORGANIC PRODUCTS IN USD, GLOBAL, 2017 - 2022
- Figure 3:
- GLOBAL RHIZOBIUM MARKET, VOLUME, METRIC TON, 2017 - 2029
- Figure 4:
- GLOBAL RHIZOBIUM MARKET, VALUE, USD, 2017 - 2029
- Figure 5:
- RHIZOBIUM CONSUMPTION IN METRIC TON, GLOBAL, 2017 - 2029
- Figure 6:
- RHIZOBIUM CONSUMPTION IN USD, GLOBAL, 2017 - 2029
- Figure 7:
- RHIZOBIUM CONSUMPTION VOLUME BY CROP TYPE IN %, GLOBAL, 2017 VS 2023 VS 2029
- Figure 8:
- RHIZOBIUM CONSUMPTION VALUE BY CROP TYPE IN %, GLOBAL, 2017 VS 2023 VS 2029
- Figure 9:
- RHIZOBIUM CONSUMPTION BY CASH CROPS IN METRIC TON, GLOBAL, 2017 - 2029
- Figure 10:
- RHIZOBIUM CONSUMPTION BY CASH CROPS IN USD, GLOBAL, 2017 - 2029
- Figure 11:
- RHIZOBIUM CONSUMPTION VALUE BY REGION IN %, GLOBAL, 2021 VS 2028
- Figure 12:
- RHIZOBIUM CONSUMPTION BY HORTICULTURAL CROPS IN METRIC TON, GLOBAL, 2017 - 2029
- Figure 13:
- RHIZOBIUM CONSUMPTION BY HORTICULTURAL CROPS IN USD, GLOBAL, 2017 - 2029
- Figure 14:
- RHIZOBIUM CONSUMPTION VALUE BY REGION IN %, GLOBAL, 2021 VS 2028
- Figure 15:
- RHIZOBIUM CONSUMPTION BY ROW CROPS IN METRIC TON, GLOBAL, 2017 - 2029
- Figure 16:
- RHIZOBIUM CONSUMPTION BY ROW CROPS IN USD, GLOBAL, 2017 - 2029
- Figure 17:
- RHIZOBIUM CONSUMPTION VALUE BY REGION IN %, GLOBAL, 2021 VS 2028
- Figure 18:
- RHIZOBIUM CONSUMPTION IN METRIC TON, GLOBAL, 2017 - 2029
- Figure 19:
- RHIZOBIUM CONSUMPTION IN USD, GLOBAL, 2017 - 2029
- Figure 20:
- RHIZOBIUM CONSUMPTION VOLUME BY REGION IN %, GLOBAL, 2017 VS 2023 VS 2029
- Figure 21:
- RHIZOBIUM CONSUMPTION VALUE BY REGION IN %, GLOBAL, 2017 VS 2023 VS 2029
- Figure 22:
- RHIZOBIUM CONSUMPTION IN METRIC TON, AFRICA, 2017 - 2029
- Figure 23:
- RHIZOBIUM CONSUMPTION IN USD, AFRICA, 2017 - 2029
- Figure 24:
- RHIZOBIUM CONSUMPTION VOLUME BY COUNTRY IN %, AFRICA, 2017 VS 2023 VS 2029
- Figure 25:
- RHIZOBIUM CONSUMPTION VALUE BY COUNTRY IN %, AFRICA, 2017 VS 2023 VS 2029
- Figure 26:
- RHIZOBIUM CONSUMPTION IN METRIC TON, EGYPT, 2017 - 2029
- Figure 27:
- RHIZOBIUM CONSUMPTION IN USD, EGYPT, 2017 - 2029
- Figure 28:
- RHIZOBIUM CONSUMPTION VALUE BY CROP TYPE IN %, EGYPT, 2021 VS 2028
- Figure 29:
- RHIZOBIUM CONSUMPTION IN METRIC TON, NIGERIA, 2017 - 2029
- Figure 30:
- RHIZOBIUM CONSUMPTION IN USD, NIGERIA, 2017 - 2029
- Figure 31:
- RHIZOBIUM CONSUMPTION VALUE BY CROP TYPE IN %, NIGERIA, 2021 VS 2028
- Figure 32:
- RHIZOBIUM CONSUMPTION IN METRIC TON, SOUTH AFRICA, 2017 - 2029
- Figure 33:
- RHIZOBIUM CONSUMPTION IN USD, SOUTH AFRICA, 2017 - 2029
- Figure 34:
- RHIZOBIUM CONSUMPTION VALUE BY CROP TYPE IN %, SOUTH AFRICA, 2021 VS 2028
- Figure 35:
- RHIZOBIUM CONSUMPTION IN METRIC TON, REST OF AFRICA, 2017 - 2029
- Figure 36:
- RHIZOBIUM CONSUMPTION IN USD, REST OF AFRICA, 2017 - 2029
- Figure 37:
- RHIZOBIUM CONSUMPTION VALUE BY CROP TYPE IN %, REST OF AFRICA, 2021 VS 2028
- Figure 38:
- RHIZOBIUM CONSUMPTION IN METRIC TON, ASIA-PACIFIC, 2017 - 2029
- Figure 39:
- RHIZOBIUM CONSUMPTION IN USD, ASIA-PACIFIC, 2017 - 2029
- Figure 40:
- RHIZOBIUM CONSUMPTION VOLUME BY COUNTRY IN %, ASIA-PACIFIC, 2017 VS 2023 VS 2029
- Figure 41:
- RHIZOBIUM CONSUMPTION VALUE BY COUNTRY IN %, ASIA-PACIFIC, 2017 VS 2023 VS 2029
- Figure 42:
- RHIZOBIUM CONSUMPTION IN METRIC TON, AUSTRALIA, 2017 - 2029
- Figure 43:
- RHIZOBIUM CONSUMPTION IN USD, AUSTRALIA, 2017 - 2029
- Figure 44:
- RHIZOBIUM CONSUMPTION VALUE BY CROP TYPE IN %, AUSTRALIA, 2021 VS 2028
- Figure 45:
- RHIZOBIUM CONSUMPTION IN METRIC TON, CHINA, 2017 - 2029
- Figure 46:
- RHIZOBIUM CONSUMPTION IN USD, CHINA, 2017 - 2029
- Figure 47:
- RHIZOBIUM CONSUMPTION VALUE BY CROP TYPE IN %, CHINA, 2021 VS 2028
- Figure 48:
- RHIZOBIUM CONSUMPTION IN METRIC TON, INDIA, 2017 - 2029
- Figure 49:
- RHIZOBIUM CONSUMPTION IN USD, INDIA, 2017 - 2029
- Figure 50:
- RHIZOBIUM CONSUMPTION VALUE BY CROP TYPE IN %, INDIA, 2021 VS 2028
- Figure 51:
- RHIZOBIUM CONSUMPTION IN METRIC TON, INDONESIA, 2017 - 2029
- Figure 52:
- RHIZOBIUM CONSUMPTION IN USD, INDONESIA, 2017 - 2029
- Figure 53:
- RHIZOBIUM CONSUMPTION VALUE BY CROP TYPE IN %, INDONESIA, 2021 VS 2028
- Figure 54:
- RHIZOBIUM CONSUMPTION IN METRIC TON, JAPAN, 2017 - 2029
- Figure 55:
- RHIZOBIUM CONSUMPTION IN USD, JAPAN, 2017 - 2029
- Figure 56:
- RHIZOBIUM CONSUMPTION VALUE BY CROP TYPE IN %, JAPAN, 2021 VS 2028
- Figure 57:
- RHIZOBIUM CONSUMPTION IN METRIC TON, PHILIPPINES, 2017 - 2029
- Figure 58:
- RHIZOBIUM CONSUMPTION IN USD, PHILIPPINES, 2017 - 2029
- Figure 59:
- RHIZOBIUM CONSUMPTION VALUE BY CROP TYPE IN %, PHILIPPINES, 2021 VS 2028
- Figure 60:
- RHIZOBIUM CONSUMPTION IN METRIC TON, THAILAND, 2017 - 2029
- Figure 61:
- RHIZOBIUM CONSUMPTION IN USD, THAILAND, 2017 - 2029
- Figure 62:
- RHIZOBIUM CONSUMPTION VALUE BY CROP TYPE IN %, THAILAND, 2021 VS 2028
- Figure 63:
- RHIZOBIUM CONSUMPTION IN METRIC TON, VIETNAM, 2017 - 2029
- Figure 64:
- RHIZOBIUM CONSUMPTION IN USD, VIETNAM, 2017 - 2029
- Figure 65:
- RHIZOBIUM CONSUMPTION VALUE BY CROP TYPE IN %, VIETNAM, 2021 VS 2028
- Figure 66:
- RHIZOBIUM CONSUMPTION IN METRIC TON, REST OF ASIA-PACIFIC, 2017 - 2029
- Figure 67:
- RHIZOBIUM CONSUMPTION IN USD, REST OF ASIA-PACIFIC, 2017 - 2029
- Figure 68:
- RHIZOBIUM CONSUMPTION VALUE BY CROP TYPE IN %, REST OF ASIA-PACIFIC, 2021 VS 2028
- Figure 69:
- RHIZOBIUM CONSUMPTION IN METRIC TON, EUROPE, 2017 - 2029
- Figure 70:
- RHIZOBIUM CONSUMPTION IN USD, EUROPE, 2017 - 2029
- Figure 71:
- RHIZOBIUM CONSUMPTION VOLUME BY COUNTRY IN %, EUROPE, 2017 VS 2023 VS 2029
- Figure 72:
- RHIZOBIUM CONSUMPTION VALUE BY COUNTRY IN %, EUROPE, 2017 VS 2023 VS 2029
- Figure 73:
- RHIZOBIUM CONSUMPTION IN METRIC TON, FRANCE, 2017 - 2029
- Figure 74:
- RHIZOBIUM CONSUMPTION IN USD, FRANCE, 2017 - 2029
- Figure 75:
- RHIZOBIUM CONSUMPTION VALUE BY CROP TYPE IN %, FRANCE, 2021 VS 2028
- Figure 76:
- RHIZOBIUM CONSUMPTION IN METRIC TON, GERMANY, 2017 - 2029
- Figure 77:
- RHIZOBIUM CONSUMPTION IN USD, GERMANY, 2017 - 2029
- Figure 78:
- RHIZOBIUM CONSUMPTION VALUE BY CROP TYPE IN %, GERMANY, 2021 VS 2028
- Figure 79:
- RHIZOBIUM CONSUMPTION IN METRIC TON, ITALY, 2017 - 2029
- Figure 80:
- RHIZOBIUM CONSUMPTION IN USD, ITALY, 2017 - 2029
- Figure 81:
- RHIZOBIUM CONSUMPTION VALUE BY CROP TYPE IN %, ITALY, 2021 VS 2028
- Figure 82:
- RHIZOBIUM CONSUMPTION IN METRIC TON, NETHERLANDS, 2017 - 2029
- Figure 83:
- RHIZOBIUM CONSUMPTION IN USD, NETHERLANDS, 2017 - 2029
- Figure 84:
- RHIZOBIUM CONSUMPTION VALUE BY CROP TYPE IN %, NETHERLANDS, 2021 VS 2028
- Figure 85:
- RHIZOBIUM CONSUMPTION IN METRIC TON, RUSSIA, 2017 - 2029
- Figure 86:
- RHIZOBIUM CONSUMPTION IN USD, RUSSIA, 2017 - 2029
- Figure 87:
- RHIZOBIUM CONSUMPTION VALUE BY CROP TYPE IN %, RUSSIA, 2021 VS 2028
- Figure 88:
- RHIZOBIUM CONSUMPTION IN METRIC TON, SPAIN, 2017 - 2029
- Figure 89:
- RHIZOBIUM CONSUMPTION IN USD, SPAIN, 2017 - 2029
- Figure 90:
- RHIZOBIUM CONSUMPTION VALUE BY CROP TYPE IN %, SPAIN, 2021 VS 2028
- Figure 91:
- RHIZOBIUM CONSUMPTION IN METRIC TON, TURKEY, 2017 - 2029
- Figure 92:
- RHIZOBIUM CONSUMPTION IN USD, TURKEY, 2017 - 2029
- Figure 93:
- RHIZOBIUM CONSUMPTION VALUE BY CROP TYPE IN %, TURKEY, 2021 VS 2028
- Figure 94:
- RHIZOBIUM CONSUMPTION IN METRIC TON, UNITED KINGDOM, 2017 - 2029
- Figure 95:
- RHIZOBIUM CONSUMPTION IN USD, UNITED KINGDOM, 2017 - 2029
- Figure 96:
- RHIZOBIUM CONSUMPTION VALUE BY CROP TYPE IN %, UNITED KINGDOM, 2021 VS 2028
- Figure 97:
- RHIZOBIUM CONSUMPTION IN METRIC TON, REST OF EUROPE, 2017 - 2029
- Figure 98:
- RHIZOBIUM CONSUMPTION IN USD, REST OF EUROPE, 2017 - 2029
- Figure 99:
- RHIZOBIUM CONSUMPTION VALUE BY CROP TYPE IN %, REST OF EUROPE, 2021 VS 2028
- Figure 100:
- RHIZOBIUM CONSUMPTION IN METRIC TON, MIDDLE EAST, 2017 - 2029
- Figure 101:
- RHIZOBIUM CONSUMPTION IN USD, MIDDLE EAST, 2017 - 2029
- Figure 102:
- RHIZOBIUM CONSUMPTION VOLUME BY COUNTRY IN %, MIDDLE EAST, 2017 VS 2023 VS 2029
- Figure 103:
- RHIZOBIUM CONSUMPTION VALUE BY COUNTRY IN %, MIDDLE EAST, 2017 VS 2023 VS 2029
- Figure 104:
- RHIZOBIUM CONSUMPTION IN METRIC TON, IRAN, 2017 - 2029
- Figure 105:
- RHIZOBIUM CONSUMPTION IN USD, IRAN, 2017 - 2029
- Figure 106:
- RHIZOBIUM CONSUMPTION VALUE BY CROP TYPE IN %, IRAN, 2021 VS 2028
- Figure 107:
- RHIZOBIUM CONSUMPTION IN METRIC TON, SAUDI ARABIA, 2017 - 2029
- Figure 108:
- RHIZOBIUM CONSUMPTION IN USD, SAUDI ARABIA, 2017 - 2029
- Figure 109:
- RHIZOBIUM CONSUMPTION VALUE BY CROP TYPE IN %, SAUDI ARABIA, 2021 VS 2028
- Figure 110:
- RHIZOBIUM CONSUMPTION IN METRIC TON, REST OF MIDDLE EAST, 2017 - 2029
- Figure 111:
- RHIZOBIUM CONSUMPTION IN USD, REST OF MIDDLE EAST, 2017 - 2029
- Figure 112:
- RHIZOBIUM CONSUMPTION VALUE BY CROP TYPE IN %, REST OF MIDDLE EAST, 2021 VS 2028
- Figure 113:
- RHIZOBIUM CONSUMPTION IN METRIC TON, NORTH AMERICA, 2017 - 2029
- Figure 114:
- RHIZOBIUM CONSUMPTION IN USD, NORTH AMERICA, 2017 - 2029
- Figure 115:
- RHIZOBIUM CONSUMPTION VOLUME BY COUNTRY IN %, NORTH AMERICA, 2017 VS 2023 VS 2029
- Figure 116:
- RHIZOBIUM CONSUMPTION VALUE BY COUNTRY IN %, NORTH AMERICA, 2017 VS 2023 VS 2029
- Figure 117:
- RHIZOBIUM CONSUMPTION IN METRIC TON, CANADA, 2017 - 2029
- Figure 118:
- RHIZOBIUM CONSUMPTION IN USD, CANADA, 2017 - 2029
- Figure 119:
- RHIZOBIUM CONSUMPTION VALUE BY CROP TYPE IN %, CANADA, 2021 VS 2028
- Figure 120:
- RHIZOBIUM CONSUMPTION IN METRIC TON, MEXICO, 2017 - 2029
- Figure 121:
- RHIZOBIUM CONSUMPTION IN USD, MEXICO, 2017 - 2029
- Figure 122:
- RHIZOBIUM CONSUMPTION VALUE BY CROP TYPE IN %, MEXICO, 2021 VS 2028
- Figure 123:
- RHIZOBIUM CONSUMPTION IN METRIC TON, UNITED STATES, 2017 - 2029
- Figure 124:
- RHIZOBIUM CONSUMPTION IN USD, UNITED STATES, 2017 - 2029
- Figure 125:
- RHIZOBIUM CONSUMPTION VALUE BY CROP TYPE IN %, UNITED STATES, 2021 VS 2028
- Figure 126:
- RHIZOBIUM CONSUMPTION IN METRIC TON, REST OF NORTH AMERICA, 2017 - 2029
- Figure 127:
- RHIZOBIUM CONSUMPTION IN USD, REST OF NORTH AMERICA, 2017 - 2029
- Figure 128:
- RHIZOBIUM CONSUMPTION VALUE BY CROP TYPE IN %, REST OF NORTH AMERICA, 2021 VS 2028
- Figure 129:
- RHIZOBIUM CONSUMPTION IN METRIC TON, SOUTH AMERICA, 2017 - 2029
- Figure 130:
- RHIZOBIUM CONSUMPTION IN USD, SOUTH AMERICA, 2017 - 2029
- Figure 131:
- RHIZOBIUM CONSUMPTION VOLUME BY COUNTRY IN %, SOUTH AMERICA, 2017 VS 2023 VS 2029
- Figure 132:
- RHIZOBIUM CONSUMPTION VALUE BY COUNTRY IN %, SOUTH AMERICA, 2017 VS 2023 VS 2029
- Figure 133:
- RHIZOBIUM CONSUMPTION IN METRIC TON, ARGENTINA, 2017 - 2029
- Figure 134:
- RHIZOBIUM CONSUMPTION IN USD, ARGENTINA, 2017 - 2029
- Figure 135:
- RHIZOBIUM CONSUMPTION VALUE BY CROP TYPE IN %, ARGENTINA, 2021 VS 2028
- Figure 136:
- RHIZOBIUM CONSUMPTION IN METRIC TON, BRAZIL, 2017 - 2029
- Figure 137:
- RHIZOBIUM CONSUMPTION IN USD, BRAZIL, 2017 - 2029
- Figure 138:
- RHIZOBIUM CONSUMPTION VALUE BY CROP TYPE IN %, BRAZIL, 2021 VS 2028
- Figure 139:
- RHIZOBIUM CONSUMPTION IN METRIC TON, REST OF SOUTH AMERICA, 2017 - 2029
- Figure 140:
- RHIZOBIUM CONSUMPTION IN USD, REST OF SOUTH AMERICA, 2017 - 2029
- Figure 141:
- RHIZOBIUM CONSUMPTION VALUE BY CROP TYPE IN %, REST OF SOUTH AMERICA, 2021 VS 2028
- Figure 142:
- GLOBAL RHIZOBIUM MARKET, MOST ACTIVE COMPANIES, BY NUMBER OF STRATEGIC MOVES, 2017-2022
- Figure 143:
- GLOBAL RHIZOBIUM MARKET, MOST ADOPTED STRATEGIES, 2017-2022
- Figure 144:
- GLOBAL RHIZOBIUM MARKET SHARE(%), BY MAJOR PLAYERS
Rhizobium Industry Segmentation
Cash Crops, Horticultural Crops, Row Crops are covered as segments by Crop Type. Africa, Asia-Pacific, Europe, Middle East, North America, South America are covered as segments by Region.| Crop Type | Cash Crops | |||
| Horticultural Crops | ||||
| Row Crops | ||||
| Region | Africa | By Country | Egypt | |
| Nigeria | ||||
| South Africa | ||||
| Rest of Africa | ||||
| Asia-Pacific | By Country | Australia | ||
| China | ||||
| India | ||||
| Indonesia | ||||
| Japan | ||||
| Philippines | ||||
| Thailand | ||||
| Vietnam | ||||
| Rest of Asia-Pacific | ||||
| Europe | By Country | France | ||
| Germany | ||||
| Italy | ||||
| Netherlands | ||||
| Russia | ||||
| Spain | ||||
| Turkey | ||||
| United Kingdom | ||||
| Rest of Europe | ||||
| Middle East | By Country | Iran | ||
| Saudi Arabia | ||||
| Rest of Middle East | ||||
| North America | By Country | Canada | ||
| Mexico | ||||
| United States | ||||
| Rest of North America | ||||
| South America | By Country | Argentina | ||
| Brazil | ||||
| Rest of South America | ||||
Need A Different Region or Segment?
Customize Now
Market Definition
- AVERAGE DOSAGE RATE - The average application rate is the average volume of Rhizobium applied per hectare of farmland in the respective region/country.
- CROP TYPE - Crop type includes Row crops (Cereals, Pulses, Oilseeds), Horticultural Crops (Fruits and vegetables) and Cash Crops (Plantation Crops, Fibre Crops and Other Industrial Crops)
- FUNCTION - The crop nutrition function of agricultural biological consists of various products that provide essential plant nutrients and enhance soil quality.
- TYPE - Rhizobium are beneficial microorganisms that form an endosymbiotic relationship with crops and help in nitrogen fixation.
| Keyword | Definition |
|---|---|
| Cash Crops | Cash crops are non-consumable crops sold as a whole or part of the crop to manufacture end-products to make a profit. |
| Integrated Pest Management (IPM) | IPM is an environment-friendly and sustainable approach to control pests in various crops. It involves a combination of methods, including biological controls, cultural practices, and selective use of pesticides. |
| Bacterial biocontrol agents | Bacteria used to control pests and diseases in crops. They work by producing toxins harmful to the target pests or competing with them for nutrients and space in the growing environment. Some examples of commonly used bacterial biocontrol agents include Bacillus thuringiensis (Bt), Pseudomonas fluorescens, and Streptomyces spp. |
| Plant Protection Product (PPP) | A plant protection product is a formulation applied to crops to protect from pests, such as weeds, diseases, or insects. They contain one or more active substances with other co-formulants such as solvents, carriers, inert material, wetting agents or adjuvants formulated to give optimum product efficacy. |
| Pathogen | A pathogen is an organism causing disease to its host, with the severity of the disease symptoms. |
| Parasitoids | Parasitoids are insects that lay their eggs on or within the host insect, with their larvae feeding on the host insect. In agriculture, parasitoids can be used as a form of biological pest control, as they help to control pest damage to crops and decrease the need for chemical pesticides. |
| Entomopathogenic Nematodes (EPN) | Entomopathogenic nematodes are parasitic roundworms that infect and kill pests by releasing bacteria from their gut. Entomopathogenic nematodes are a form of biocontrol agents used in agriculture. |
| Vesicular-arbuscular mycorrhiza (VAM) | VAM fungi are mycorrhizal species of fungus. They live in the roots of different higher-order plants. They develop a symbiotic relationship with the plants in the roots of these plants. |
| Fungal biocontrol agents | Fungal biocontrol agents are the beneficial fungi that control plant pests and diseases. They are an alternative to chemical pesticides. They infect and kill the pests or compete with pathogenic fungi for nutrients and space. |
| Biofertilizers | Biofertilizers contain beneficial microorganisms that enhance soil fertility and promote plant growth. |
| Biopesticides | Biopesticides are natural/bio-based compounds used to manage agricultural pests using specific biological effects. |
| Predators | Predators in agriculture are the organisms that feed on pests and help control pest damage to the crops. Some common predator species used in agriculture include ladybugs, lacewings, and predatory mites. |
| Biocontrol agents | Biocontrol agents are living organisms used to control pests and diseases in agriculture. They are alternatives to chemical pesticides and are known for their lesser impact on the environment and human health. |
| Organic Fertilizers | Organic fertilizer is composed of animal or vegetable matter used alone or in combination with one or more non-synthetically derived elements or compounds used for soil fertility and plant growth. |
| Protein hydrolysates (PHs) | Protein hydrolysate-based biostimulants contain free amino acids, oligopeptides, and polypeptides produced by enzymatic or chemical hydrolysis of proteins, primarily from vegetal or animal sources. |
| Biostimulants/Plant Growth Regulators (PGR) | Biostimulants/Plant Growth Regulators (PGR) are substances derived from natural resources to enhance plant growth and health by stimulating plant processes (metabolism). |
| Soil Amendments | Soil Amendments are substances applied to soil that improve soil health, such as soil fertility and soil structure. |
| Seaweed Extract | Seaweed extracts are rich in micro and macronutrients, proteins, polysaccharides, polyphenols, phytohormones, and osmolytes. These substances boost seed germination and crop establishment, total plant growth and productivity. |
| Compounds related to biocontrol and/or promoting growth (CRBPG) | Compounds related to biocontrol or promoting growth (CRBPG) are the ability of a bacteria to produce compounds for phytopathogen biocontrol and plant growth promotion. |
| Symbiotic Nitrogen-Fixing Bacteria | Symbiotic nitrogen-fixing bacteria such as Rhizobium obtain food and shelter from the host, and in return, they help by providing fixed nitrogen to the plants. |
| Nitrogen Fixation | Nitrogen fixation is a chemical process in soil which converts molecular nitrogen into ammonia or related nitrogenous compounds. |
| ARS (Agricultural Research Service) | ARS is the U.S. Department of Agriculture's chief scientific in-house research agency. It aims to find solutions to agricultural problems faced by the farmers in the country. |
| Phytosanitary Regulations | Phytosanitary regulations imposed by the respective government bodies check or prohibit the importation and marketing of certain insects, plant species, or products of these plants to prevent the introduction or spread of new plant pests or pathogens. |
| Ectomycorrhizae (ECM) | Ectomycorrhiza (ECM) is a symbiotic interaction of fungi with the feeder roots of higher plants in which both the plant and the fungi benefit through the association for survival. |
Need More Details on Market Definition?
Ask a Question
Research Methodology
Mordor Intelligence follows a four-step methodology in all our reports.
- Step-1: Identify Key Variables: In order to build a robust forecasting methodology, the variables and factors identified in Step-1 are tested against available historical market numbers. Through an iterative process, the variables required for market forecast are set and the model is built on the basis of these variables.
- Step-2: Build a Market Model: Market-size estimations for the forecast years are in nominal terms. Inflation is not a part of the pricing, and the average selling price (ASP) is kept constant throughout the forecast period.
- Step-3: Validate and Finalize: In this important step, all market numbers, variables and analyst calls are validated through an extensive network of primary research experts from the market studied. The respondents are selected across levels and functions to generate a holistic picture of the market studied.
- Step-4: Research Outputs: Syndicated Reports, Custom Consulting Assignments, Databases & Subscription Platforms.

Get More Details On Research Methodology
Download PDF


