
Rhamnolipids Market Size and Share
Market Overview
| Study Period | 2021 - 2031 |
|---|---|
| Market Volume (2026) | 14.15 kilotons |
| Market Volume (2031) | 70.97 kilotons |
| Growth Rate (2026 - 2031) | 38.06 % |
| Fastest Growing Market | Europe |
| Largest Market | Europe |
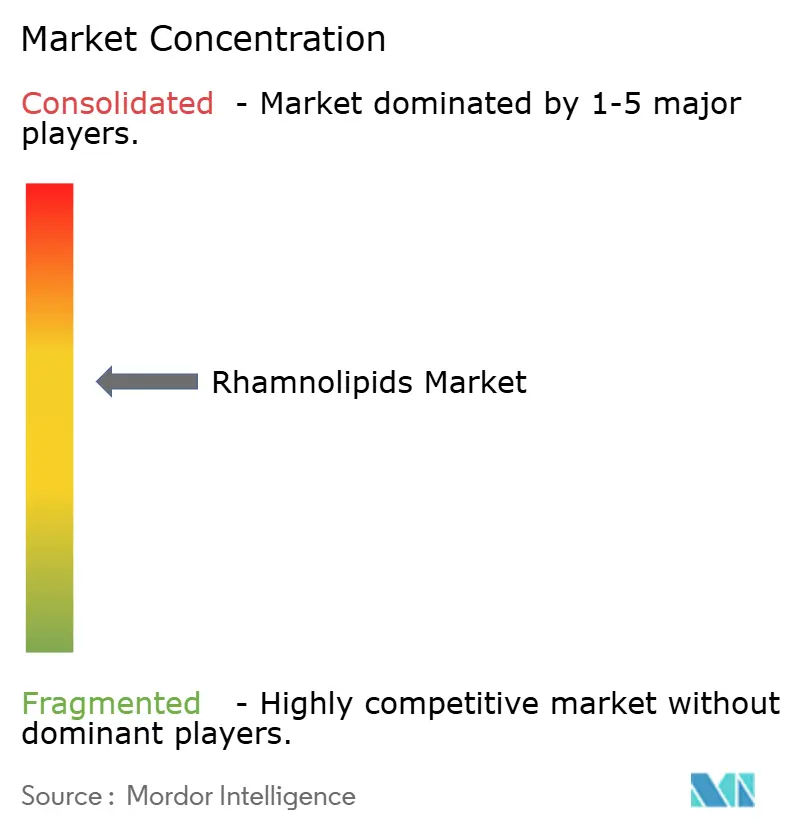
| Market Concentration | Medium |
Major Players *Disclaimer: Major Players sorted in no particular order Image © Mordor Intelligence. Reuse requires attribution under CC BY 4.0. | |
Rhamnolipids Market Analysis by Mordor Intelligence
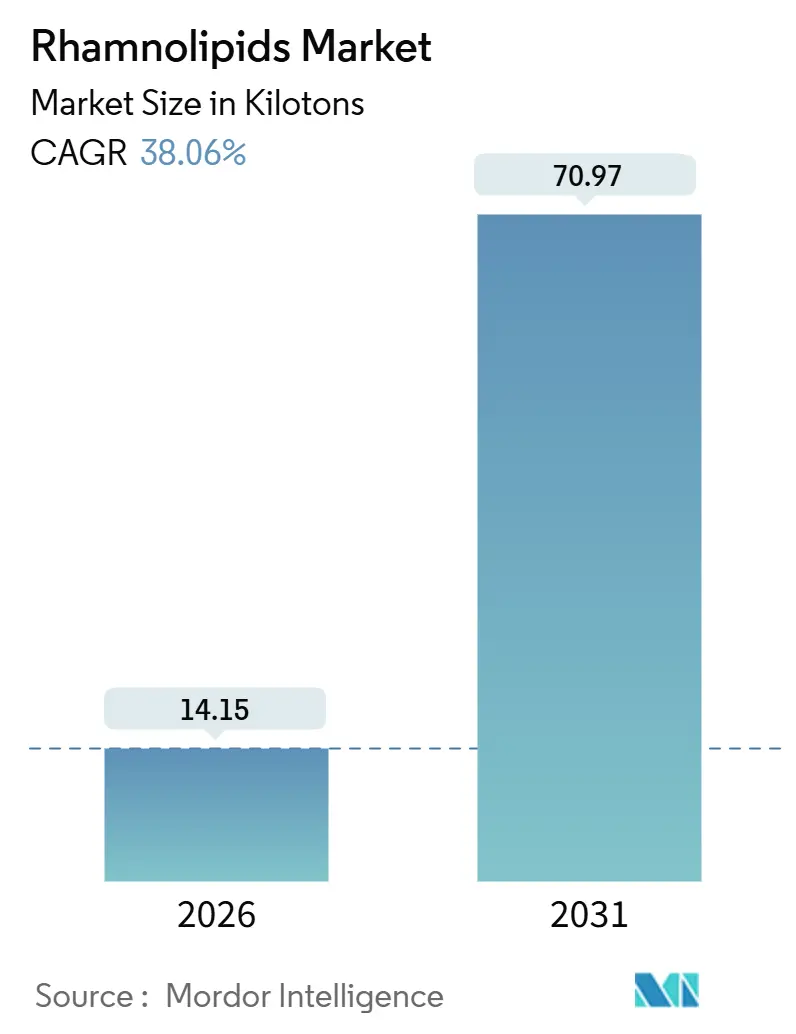
The Rhamnolipids Market size is estimated at 14.15 kilotons in 2026, and is expected to reach 70.97 kilotons by 2031, at a CAGR of 38.06% during the forecast period (2026-2031). Shifting preference toward fermentation-derived surfactants, mounting regulatory pressure on petrochemical ingredients, and commercial‐scale capacity additions in Europe and Asia place the rhamnolipids market on an accelerated growth path. Europe currently dominates demand as Unilever launches dishwashing liquids sourced from Evonik’s Slovakian plant, while Asia rapidly scales owing to AGAE Technologies’ 1,000-metric-ton facility and growing personal-care consumption in China, Japan, and India. Surfactant formulators value rhamnolipids’ lower critical micelle concentration, skin-mildness profile, and 28–30 mN/m surface-tension performance, enabling clean-label positioning without sacrificing foaming or detergency. Feedstock flexibility, from waste glycerol to renewable methanol, further reinforces supply resilience and cost competitiveness in the rhamnolipids market. Competitive intensity is tightening as Holiferm, Biotensidon, and other fermentation specialists draw fresh capital to close the price gap with synthetic lauryl ether sulfates.
Key Report Takeaways
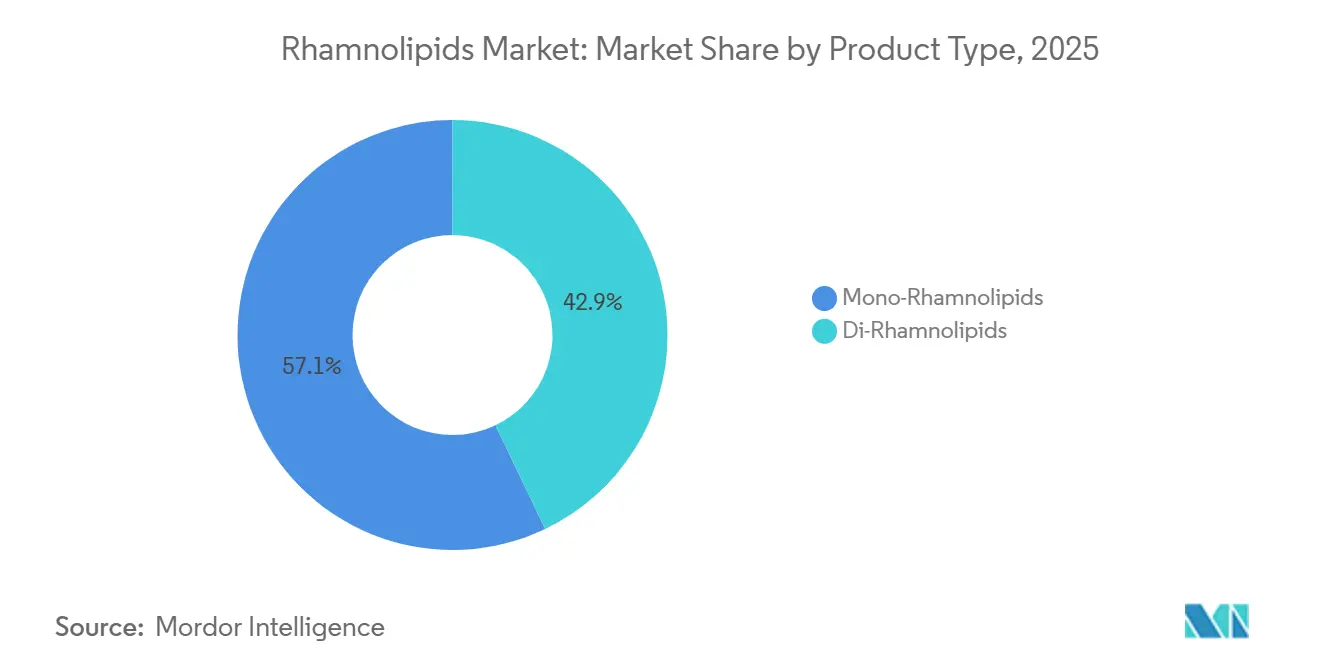
- By product type, mono-rhamnolipids captured 57.09% of global volume in 2025, and their market share is expected to grow with a CAGR of 40.42% during the forecast period (2026-2031).
- By feedstock, vegetable-oils-derived feedstock held a 44.16% share in 2025, whereas waste glycerol feeds are advancing at a 41.18% CAGR, reflecting superior cost and carbon metrics.
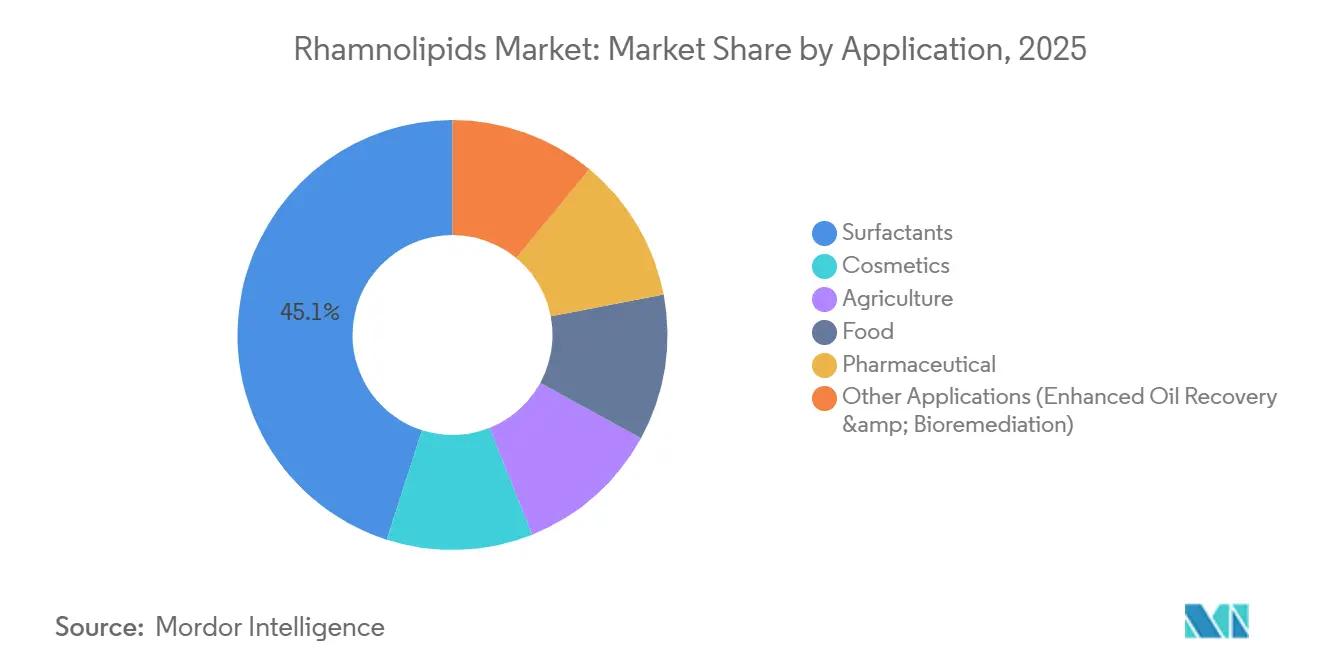
- By application, surfactant uses accounted for 45.05% of demand in 2025 and are expanding at a 47.74% CAGR to 2031, outpacing all other end uses.
- By geography, Europe led with 62.76% of the rhamnolipids market share in 2025, and this share is expected to grow with a CAGR of 43.76% during the forecast period (2026-2031).
Note: Market size and forecast figures in this report are generated using Mordor Intelligence’s proprietary estimation framework, updated with the latest available data and insights as of January 2026.
Market Trends and Insights
Drivers Impact Analysis of Rhamnolipids Market*
| Driver | (~) % Impact on CAGR Forecast | Geographic Relevance | Impact Timeline |
|---|---|---|---|
| Rising demand for eco-friendly surfactants in Home & Personal Care | +9.2% | Global, with concentration in Western Europe and North America | Medium term (2–4 years) |
| Regulatory push for biodegradable, low-toxicity ingredients | +8.5% | North America & EU, spillover to APAC urban markets | Short term (≤ 2 years) |
| Increasing usage in agriculture and biopesticide applications | +6.8% | Brazil, India, ASEAN countries | Long term (≥ 4 years) |
| Adoption of rhamnolipid nano-micelles as alcohol-free hospital sanitizers | +5.3% | Global, early traction in Middle East and Asia-Pacific healthcare systems | Medium term (2–4 years) |
| Increasing demand from oil recovery and remediation applications | +4.7% | Middle East (Saudi Arabia, UAE), North America (shale basins) | Long term (≥ 4 years) |
| Source: Mordor Intelligence | |||
Rising Demand for Eco-Friendly Surfactants in Home & Personal Care
Penetration of certified eco-label detergents exceeded 28% in Germany, France, and the United Kingdom during 2025 as millennials and Gen Z consumers prioritized ingredient transparency. Holiferm’s partnership with Trichem South illustrates adoption by tier-two detergent brands seeking mildness and sustainability without compromising foam or grease cutting.[1]. Dermatological patch tests confirm rhamnolipids’ reduced irritation, supporting deployment in baby-care and sensitive-skin products. Retail price premiums of 15–20% for bio-based micellar waters and shower gels reduce price elasticity, translating directly to volume displacement of sodium lauryl ether sulfate. As private-label and mass brands emulate early movers, the +9.2 percentage-point effect will remain visible through 2029, reinforcing the rhamnolipids market trajectory.
Regulatory Push for Biodegradable, Low-Toxicity Ingredients
The 2024 REACH Annex XIV update added three alkylphenol ethoxylates to Europe’s authorization list, effectively phasing them out by 2027. The U.S. EPA’s Safer Choice revisions tightened Daphnia magna LC₅₀ requirements above 10 mg/L, spurring formulators to adopt rhamnolipids, which display LC₅₀ values over 100 mg/L and >90% biodegradation within 28 days. Brand reformulations to meet 2026–2027 cut-off dates anchor near-term market growth, though momentum stabilizes post-2028 as compliant formulations gain wide penetration.
Increasing Usage in Agriculture and Biopesticide Applications
Brazil’s Bio-inputs Law reduced microbial registration times to one year, enabling multifunctional rhamnolipid products that pair pest suppression with nutrient uptake. Field trials in São Paulo showed 18–22% gains in glyphosate efficacy when paired with rhamnolipid adjuvants, cutting herbicide volumes. India mirrors this trajectory as smallholders pursue organic certification and integrated pest management. Long-term impact rests on extension-service training and distribution, positioning agriculture as a sustained growth pillar for the rhamnolipids market.
Adoption of Rhamnolipid Nano-Micelles as Alcohol-Free Hospital Sanitizers
Hospitals in high-temperature regions find alcohol gels suboptimal because evaporation shortens contact time below 20 seconds, the threshold for pathogen inactivation. Rhamnolipid nano-micelles achieve log-4 MRSA reduction within 15 seconds without flammability, enhancing safety in oxygen-rich environments. Saudi Arabia piloted rhamnolipid sanitizers in 12 tertiary hospitals during 2025, and wider procurement decisions are underway. FDA approval for over-the-counter U.S. use remains a gating factor, shifting full commercialization toward 2027–2028.
Restraints Impact Analysis of Rhamnolipids Market*
| Restraint | (~) % Impact on CAGR Forecast | Geographic Relevance | Impact Timeline |
|---|---|---|---|
| Foaming & downstream-processing costs | -6.4% | Global, acute in Asia-Pacific greenfield projects | Short term (≤ 2 years) |
| Safety concerns over endotoxins | -3.8% | North America, EU pharmaceutical and food-grade applications | Medium term (2–4 years) |
| Vegetable-oil price volatility | -4.2% | Palm-oil supply chains in Southeast Asia | Short term (≤ 2 years) |
| Source: Mordor Intelligence | |||
Foaming & Downstream-Processing Costs at Industrial Scale
Fermentation foam can exceed reactor capacity by 3–5 times, demanding mechanical breakers or antifoams that complicate purification. AGAE Technologies installed rapid foam-recycling loops and pressure-modulated aeration at its Asian plant to keep yields intact[2]. Downstream operations, solvent extraction, ultrafiltration, and spray drying still account for as much as 50% of the cost of goods, double the citric acid benchmarks. Continuous membrane contactors and in-situ product removal could halve recovery costs by 2028, but the learning curve remains a -6.4 percentage-point drag in the near term.
Safety Concerns Over Endotoxins
Gram-negative Pseudomonas strains shed lipopolysaccharides; residual endotoxin above 0.5 EU/mL can trigger pyrogenic responses. Depyrogenation via activated carbon or affinity chromatography adds USD 8–12/kg and trims yields by up to 15%. Biotensidon’s non-pathogenic strains are promising yet pre-commercial. Pharmaceutical and oral-care formulators, representing 12% of 2025 demand but commanding premium margins, remain risk-averse, imparting a -3.8 percentage-point constraint until engineered strains gain regulatory clearance.
*Our forecasts treat driver/restraint impacts as directional, not additive. The impact forecasts reflect baseline growth, mix effects, and variable interactions.
Rhamnolipids Market Segment Analysis
By Product Type:
Mono-Rhamnolipids Dominate on Solubility AdvantageMono-rhamnolipids commanded 57.09% volume in 2025, capturing the largest rhamnolipids market share due to water solubility and lower critical micelle concentration. Mono-rhamnolipids' market share is expected to increase at a CAGR of 40.425 during the forecast period (2026-2031). Evonik’s pH-controlled fermentation tunes mono-to-di ratios without costly fractionation, trimming production costs 15–18%. Waste glycerol substrates further tilt yields toward mono species, linking raw-material strategy to product mix. Patent filings center on rhamnosyltransferase gene optimization, with AGAE Technologies targeting more than 85% mono purity. Di-rhamnolipids retain a niche for antimicrobial cosmetics and industrial degreasers owing to heightened membrane disruption, but viscosity limits adoption where quick dissolution is critical.
Second-generation blends leveraging both species could emerge as suppliers pursue performance-cost trade-offs. If di-rhamnolipid titers improve through genetic knockouts of competing pathways, formulators may adopt tailored ratios for leave-on skincare and disinfectants, reinforcing product-type diversification within the rhamnolipids market.
By Feedstock:
Waste Glycerol Gains on Cost and Carbon MetricsVegetable oils held 44.16% share in 2025, but waste glycerol feeds grew at 41.18% CAGR, compressing feedstock costs to 15–20% of total production expense. Global biodiesel output generated 4.7 million tons of crude glycerol in 2025, creating a low-value substrate priced around USD 200–300/t. Fed-batch fermentation titers above 60 g/L on glycerol underscore commercial viability. Evonik’s European corn sugar approach meets EU locality criteria, whereas BASF’s renewable methanol collaboration with Acies Bio aims to bypass agricultural inputs entirely. Should OneCarbonBio yield top 40 g/L by 2027, carbon-negative pathways could remake the rhamnolipids market cost curve.
Hydrocarbon substrates stay niche for enhanced oil recovery, and sugar feedstocks risk price swings and food-fuel debates. A portfolio approach, glycerol for cost, methanol for carbon neutrality, may prove optimal as producers hedge volatility and sustainability scrutiny.
By Application:
Surfactants Lead, Agriculture AcceleratesSurfactants represented 45.05% of demand in 2025 and will advance at 47.74% CAGR to 2031, as retailers impose ingredient-count limits and detergent makers pivot to transparent labels. Rhamnolipids’ dual role as primary surfactant and foam booster enables streamlined formulations meeting clean-label scorecards. Cosmetics follow, leveraging antimicrobial action against Cutibacterium acnes in acne treatments.
Agriculture, though smaller in volume, posts the fastest percentage growth as Brazil and India institutionalize bioinputs. Rhamnolipid adjuvants lifted herbicide rainfastness by 30–35%, saving USD 12-15/ha for Punjab growers. Pharmaceutical uptake hinges on endotoxin mitigation, yet excipient demand for skin and transdermal delivery remains promising. Enhanced oil recovery rounds out applications; field pilots demonstrate 8–12% incremental crude extraction, pending cost reductions below USD 8/kg.

Geography Analysis
Europe Rhamnolipids Market
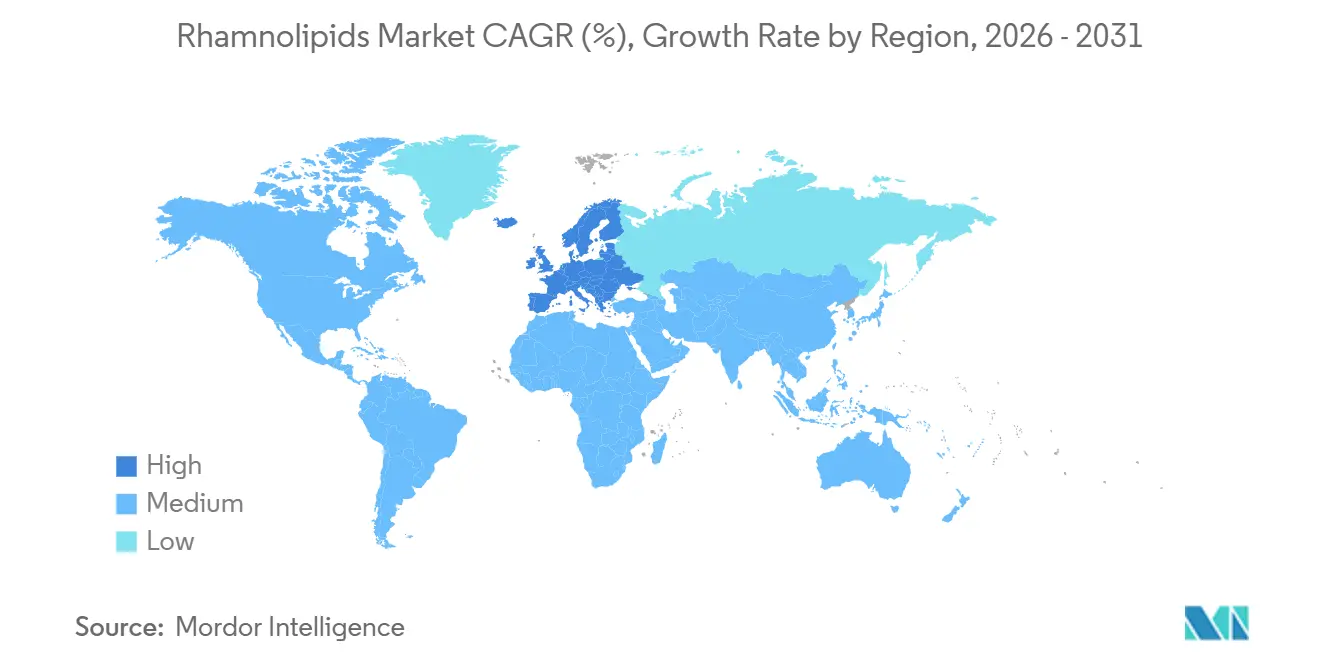
Europe accounted for 62.76% of the Rhamnolipids market size in 2025 and is set to grow at a 43.76% CAGR through 2031. Germany and France anchor demand, supported by Henkel and Unilever commitments to replace 50% of petrochemical surfactants by 2030. Evonik’s Slovakian plant supplies Unilever’s global dishwashing liquids, aligning regional supply chains with EU sustainability mandates. Post-Brexit UK regulations shorten review cycles for bio-based ingredients, accelerating market entry and spurring adoption by private-label producers in Italy and Spain.
APAC Rhamnolipids Market
Asia-Pacific is the fastest-growing region by volume. AGAE Technologies’ 1,000-t plant, commissioned in 2025, positions the region as a supply hub amid rising personal-care consumption. China’s 2025 Cosmetic Ingredient Safety update allows 2.0% rhamnolipid inclusion in leave-on products, unlocking a potential 10,000 t annual market if 5 % penetration is achieved. Japan authorized rhamnolipids as food emulsifiers at 0.5% in May 2025, pioneering direct food-contact approvals. India emphasizes agriculture, integrating rhamnolipid biopesticides under its National Mission for Sustainable Agriculture.
North America Rhamnolipids Market
North America is led by industrial and institutional cleaners certified under EPA’s Safer Choice program. Domestic full-scale production remains prospective; AGAE plans a US plant leveraging foam-control learnings from Asia. Canada’s modest adoption reflects limited personal-care manufacturing but could surge as exporters seek REACH-compliant formulations. Mexico lags given cheap synthetic imports, though USMCA rules may spur regional biosurfactant production.
Regulatory Landscape
Regulatory pull is strongest in the EU and the United States, where surfactants are increasingly assessed on biodegradability, aquatic toxicity, and traceability. In the EU, Regulation (EU) 2026/405 (adopted 11 February 2026) updates the detergents framework with modernized biodegradability criteria and stronger information requirements, including digital labeling and product-level documentation. This raises the compliance bar for petrochemical surfactants and supports fermentation-derived alternatives such as rhamnolipids.
In the United States, rhamnolipid biosurfactants have an established pathway in crop protection and bioinputs. Rhamnolipid is registered under FIFRA as a biochemical fungicide (EPA Reg. No. 72431-1), and residues are exempt from tolerance requirements under 40 CFR 180.1245. For consumer-facing uses, rhamnolipids also sit within mainstream chemical governance regimes, including the EU cosmetics ingredient inventory under Regulation (EC) 1223/2009, while broader EU chemical controls under REACH continue to shape substitution decisions for surfactant formulators.
Value Chain Analysis
The rhamnolipids value chain begins with renewable feedstocks, commonly sugar-based substrates such as corn-derived sugars, and increasingly waste glycerol, along with nutrients. Strain development and fermentation then follow, typically using engineered, non-pathogenic production hosts, including Pseudomonas putida in commercial efforts. Downstream purification, covering separation, concentration, and drying, remains the main cost and throughput bottleneck due to foam handling, water and energy intensity, and the need to manage bioburden and impurities for higher-purity grades.
Commercial supply is consolidating around players that can combine scale fermentation with recovery systems and quality documentation for FMCG and specialty customers. Evonik has anchored a European supply node through its industrial-scale biosurfactants facility in Slovenská Lupca, Slovakia (inaugurated May 2024), and it has expanded access via branded rhamnolipid surfactants such as REWOFERM RL 100 (announced February 2024). In Asia, AGAE Technologies brought online a retrofitted industrial-scale complex with more than 1,000 metric tons per year capacity (opened February 2025), supporting formulators and distributors that convert bulk rhamnolipids into finished home care, I and I cleaning, personal care, and agriculture formulations.
Competitive Landscape
The Rhamnolipids market is moderately consolidated. Strategic white space lies in food emulsifiers for plant-based proteins, oil-field chemicals where price thresholds near USD 8/kg approach viability, and organic agriculture adjuvants barred from synthetic surfactants. Patent filings intensified in 2024–2025: Evonik’s continuous foam-recycling bioreactors and AGAE Technologies’ membrane-contactor systems aim to slash downstream costs. With capacity additions projected to outpace short-term demand, margin compression may spark consolidation among smaller players lacking distinct IP or feedstock synergies. Investors monitor unit cost trajectories and regulatory milestones to gauge winners in the evolving rhamnolipids market.
Rhamnolipids Industry Leaders
-
Evonik Industries AG
-
AGAE Technologies, LLC
-
Stepan Company
-
Jeneil Biotech
-
Holiferm
- *Disclaimer: Major Players sorted in no particular order
Rhamnolipids Market Companies Covered in this Report
- AGAE Technologies, LLC
- BASF SE
- Biotensidon GmbH
- DEGUAN Biosurfactant Supplier
- Evonik Industries AG
- GlycoSurf Inc.
- Holiferm Ltd
- Jeneil Biotech
- Stepan Company
- TensioGreen LLC
Market Opportunities and Future Outlook
Near-term opportunities concentrate where regulation and retailer scorecards create immediate reformulation pressure, especially detergents and I and I cleaning in Europe. Regulation (EU) 2026/405, adopted in February 2026, increases compliance workload around surfactant performance and disclosure, and it favors suppliers that can support biodegradability data and product documentation at scale. Because Europe is already the largest demand center within this report scope, suppliers that can standardize rhamnolipid grades for mainstream formulations and consistently provide documentation have a clearer commercialization route.
A second opportunity centers on cost-down and capacity-linked adoption in high-volume channels, enabled by recent investment and scale-up activity. AGAE Technologies opened a 41,000-square-foot plant in Asia in February 2025 with over 1,000 metric tons per year capacity, expanding supply available to regional home and personal care manufacturers and brands. On the technology and operations side, continued debottlenecking of downstream recovery, foam control, and impurity management remains the primary lever for broader adoption beyond premium personal care into cost-sensitive applications such as agriculture adjuvants, plus parts of oilfield and remediation chemistry where price thresholds are tightly defined by incumbent surfactants.
Recent Industry Developments in Rhamnolipids Market
- April 2026: Evonik announced an approximately EUR 80 million investment to expand biotechnology capabilities at its Fermas site in Slovenska Lupca, Slovakia, adding downstream fermentation technology for drug substance manufacturing. While the investment targets pharma services, it strengthens the same biotechnology hub that already supports Evonik's rhamnolipid capability, reinforcing site-level infrastructure and know-how relevant to biosurfactant scale-up and purification.
- February 2025: AGAE Technologies announced industrial production of rhamnolipid biosurfactant from a full-scale, retrofitted manufacturing plant in Asia. The 41,000-square-foot complex has annual capacity of more than 1,000 metric tons, shifting supply availability from pilot volumes toward commercial supply programs for formulators that require consistent lot-to-lot quality.
- May 2024: Evonik inaugurated its industrial-scale rhamnolipid biosurfactant facility in Slovenska Lupca, Slovakia. The plant established a dedicated European production base for rhamnolipids, supporting packaged goods reformulations that require reliable regional supply and a documented sustainability profile.
Rhamnolipids Market Report Scope and Research Methodology
Market Definition and Coverage
For this methodology, the rhamnolipids market covers commercially produced rhamnolipid biosurfactants sold for use as functional surfactants across end-use formulations, measured in value terms for finished rhamnolipid ingredients.
Scope exclusions: We exclude broader biosurfactants and other glycolipids, and we also exclude internal transfers not priced at market terms.
Segments Covered in This Report
- By Product Type
- Mono-Rhamnolipids
- Di-Rhamnolipids
- By Feedstock
- Vegetable-Oil Derived
- Waste Glycerol / Crude Glycerin
- Sugar-Based
- Hydrocarbon-Based
- By Application
- Surfactants
- Cosmetics
- Agriculture
- Food
- Pharmaceutical
- Other Applications (Enhanced Oil Recovery & Bioremediation, etc.)
- By Geography
- Asia-Pacific
- China
- India
- Japan
- South Korea
- ASEAN Countries
- Rest of Asia-Pacific
- North America
- United States
- Canada
- Mexico
- Europe
- Germany
- United Kingdom
- France
- Italy
- Russia
- Rest of Europe
- South America
- Brazil
- Argentina
- Rest of South America
- Middle East and Africa
- Saudi Arabia
- South Africa
- Rest of Middle East and Africa
- Asia-Pacific
Data Sources, Market Sizing, and Validation
Desk Research
Desk research was first used to set the scientific and regulatory context for rhamnolipids, and to map realistic adoption pools across key end uses. Public sources that helped frame demand signals and constraints included items such as the US Environmental Protection Agency Safer Choice program, the European Chemicals Agency substance and regulation pages, the United States Patent and Trademark Office patent search, and peer-reviewed journal literature on biosurfactant performance and yields.
We also reviewed company annual reports, investor presentations, and press releases tied to new capacity to understand who is producing at scale and which applications are being targeted. For additional structure, we used paid subscriptions for company financials and intelligence, patent databases, and news and financials to cross-check timelines, pricing direction, and production announcements. These desk sources are not exhaustive, and additional public and paid references were used to collect data, validate assumptions, and clarify open points during the work.
Primary Interviews and Surveys
Primary interviews and surveys focused on validating pricing bands, typical use rates in formulations, and how fast rhamnolipids are displacing conventional surfactants in cleaning and personal care. We spoke with a mix of producers, distributors, formulators, and downstream buyers across the Americas, EMEA, and APAC so assumptions could be checked against procurement and qualification behavior.
Distribution of primary research fieldwork respondents
| Company type | Respondent position | Region |
|---|---|---|
| Top tier: 33% | CXOs: 22% | APAC: 44% |
| Mid tier: 45% | Functional/Unit leaders: 38% | EMEA: 35% |
| Smaller Players: 22% | Managers: 40% | Americas: 21% |
Market-Sizing & Forecasting
Sizing starts with a top-down build where production capacity signals, commissioning timelines, and likely operating rates are used to reconstruct supply that can realistically reach the market, and then it is translated into value using region-appropriate price ranges. The totals are then corroborated using selective bottom-up checks, such as sampling typical formulation treat rates, mapping major end-use demand pools, and applying price per kilogram ranges shared by participants during interviews.
Key inputs used in the model include announced nameplate capacity and ramp-up curves, fermentation yield and recovery assumptions that affect saleable output, average selling price by purity and format, the share of output going into cleaning and personal care versus other uses, and regional regulatory or labeling pull that accelerates substitution. For forecasting, scenario analysis was used because the market is sensitive to plant start-up dates, qualification cycles, and price erosion as volumes scale. Where bottom-up indicators were incomplete for smaller end uses, gaps were handled through conservative penetration assumptions that were subsequently re-checked with expert feedback before finalizing the totals.
Data Validation & Update Cycle
Outputs are checked through triangulation across independent signals, including capacity announcements, observed pricing direction, and adoption cues from formulators and distributors. When a result looks inconsistent, it is traced back to the driver that caused it, and the assumption is corrected or bounded before sign-off.
A multi-step review is followed where the model logic, inputs, and calculations are independently rechecked by another analyst. Reports are refreshed annually, with interim updates triggered by material events such as new plants, major expansions, or sudden pricing shifts. Before delivery, a final pass is performed so clients receive the most current view available at that time.
Mordor Intelligence's Rhamnolipids Market Size Versus Other Published Estimates
Published rhamnolipids market numbers can look far apart because the market is still early-stage and because estimates are built from different starting points. Some publishers anchor the size on broad biosurfactant revenues, while others start from capacity plans, then convert to value using their own pricing and utilization assumptions.
The table shows a wide spread mainly because of scope boundaries and how volume is translated into dollars, and then because forecast paths are set as aggressive or conservative. In Mordor Intelligence's model, the core scope is commercial rhamnolipid ingredient sales tied back to capacity ramp-up and sellable output, and then priced using interview-validated ranges rather than folding in adjacent biosurfactant categories.
Benchmark comparison
| Source | Market Size | Gaps in Research Methodology |
|---|---|---|
| Mordor Intelligence | USD 0.04 B (2024) | |
| Trade Journal A | USD 0.41 B (2023) | Often reflects an expanded definition that blends industrial rhamnolipids with broader biosurfactant revenue pools, which can overstate the addressable rhamnolipid-only ingredient value for a single year. |
| Global Consultancy B | USD 0.94 B (2024) | Typically uses high adoption assumptions and premium pricing across multiple end uses without transparently tying volumes back to plant ramp-up timing and qualification lead times, which inflates near-term revenue. |
Taken together, the comparison suggests that scope alignment matters as much as the math. When volumes are anchored to realistic supply build-out and then priced with clear, repeatable assumptions, the resulting market size becomes easier to explain, validate, and update as new capacity and pricing signals emerge.
Key Questions Answered in the Report
What is the current size of the rhamnolipids market and its growth outlook?
The market stood at 14.15 kilotons in 2026 and is projected to reach 70.97 kilotons by 2031, growing at a 38.06% CAGR.
Which product type leads demand?
Mono-rhamnolipids held 57.09% share in 2025, favored for low critical micelle concentration and rapid solubility.
Why are waste-glycerol feedstocks gaining traction?
Waste glycerol cuts feedstock costs to 15–20% of production expense and delivers fermentation titers above 60 g/L, accelerating commercial viability.
Which application segment is expanding fastest?
Surfactant formulations dominate volume and are rising at 47.74% CAGR, boosted by regulatory curbs on conventional ethoxylates.
What regions offer the highest growth potential?
Asia-Pacific posts the fastest volume growth as China, Japan, and India relax regulatory hurdles and capacity scales through new plants.