
RF Front End Module Market Size and Share
Market Overview
| Study Period | 2020 - 2031 |
|---|---|
| Market Size (2026) | USD 33.06 Billion |
| Market Size (2031) | USD 60.99 Billion |
| Growth Rate (2026 - 2031) | 13.02 % |
| Fastest Growing Market | Middle East and Africa |
| Largest Market | Asia Pacific |
| Market Concentration | Medium |
Major Players *Disclaimer: Major Players sorted in no particular order Image © Mordor Intelligence. Reuse requires attribution under CC BY 4.0. | |
RF Front End Module Market Analysis by Mordor Intelligence
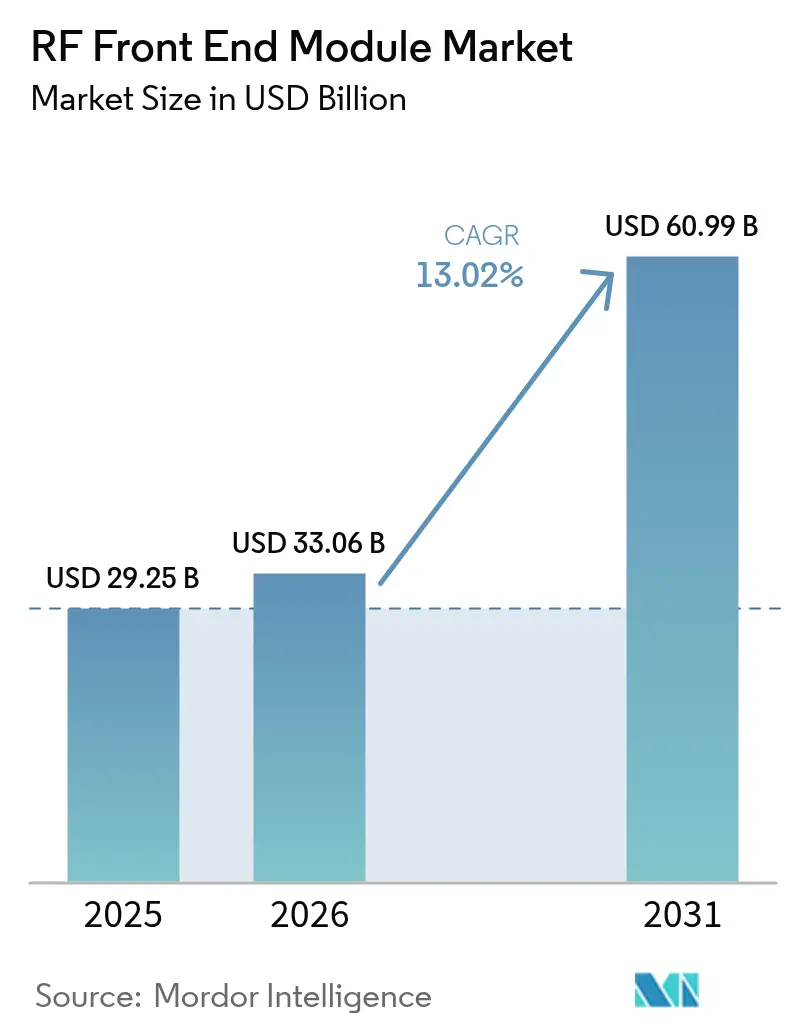
The RF front-end module market size is expected to grow from USD 29.25 billion in 2025 to USD 33.06 billion in 2026 and is forecast to reach USD 60.99 billion by 2031 at 13.02% CAGR over 2026-2031. Demand acceleration stems from smartphone makers insisting on single-package RF solutions that free board space, while network operators push for higher performance density. The convergence of mass-scale 5G sub-6 GHz coverage and the first commercial mmWave fixed-wireless access rollouts adds momentum. Integrated designs also mitigate thermal stress and shorten design cycles, giving suppliers who master system co-optimization a clear edge. Meanwhile, gallium and wafer capacity constraints encourage long-term supply partnerships and drive regional investments in compound-semiconductor fabs.[1]
Key Report Takeaways
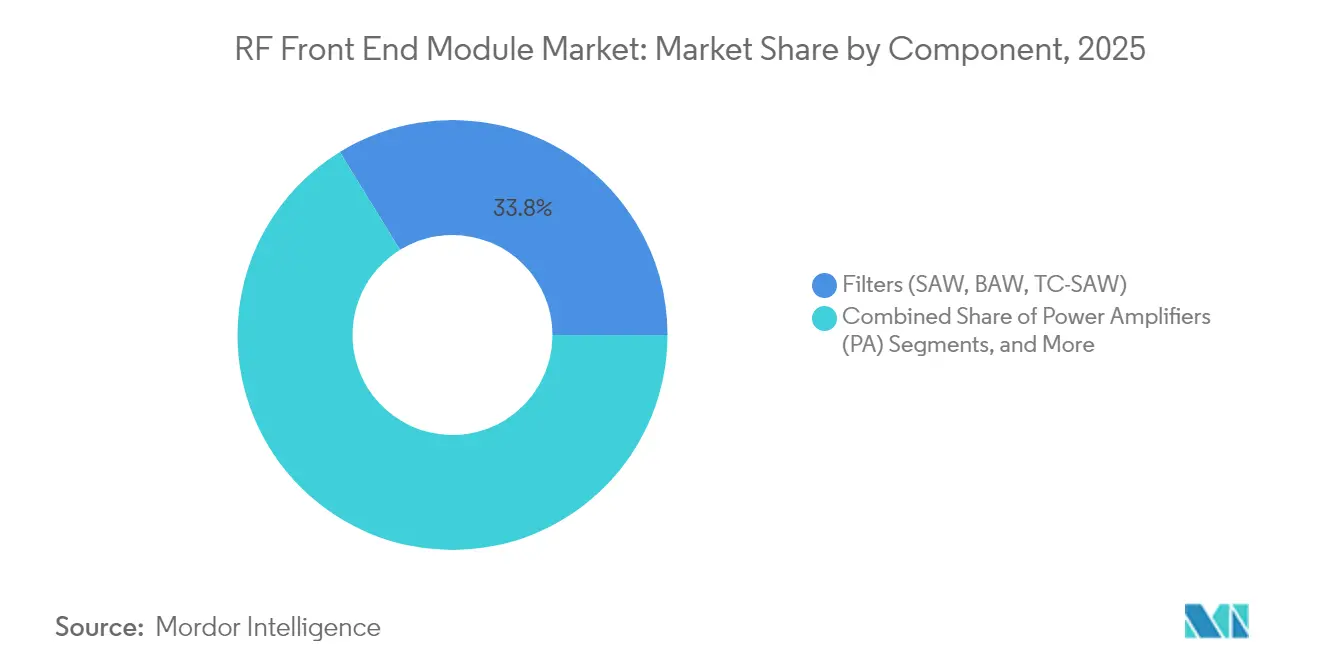
- By component, filters held 33.78% of the RF front end module market share in 2025; antenna tuners are projected to expand at a 13.98% CAGR through 2031.
- By application, consumer electronics led with 67.35% revenue share in 2025; automotive is forecast to advance at a 14.21% CAGR to 2031.
- By frequency range, sub-6 GHz accounted for 73.45% share of the RF front end module market size in 2025; mmWave (24–47 GHz, FR2) is forecast to advance at a 13.72% CAGR to 2031.
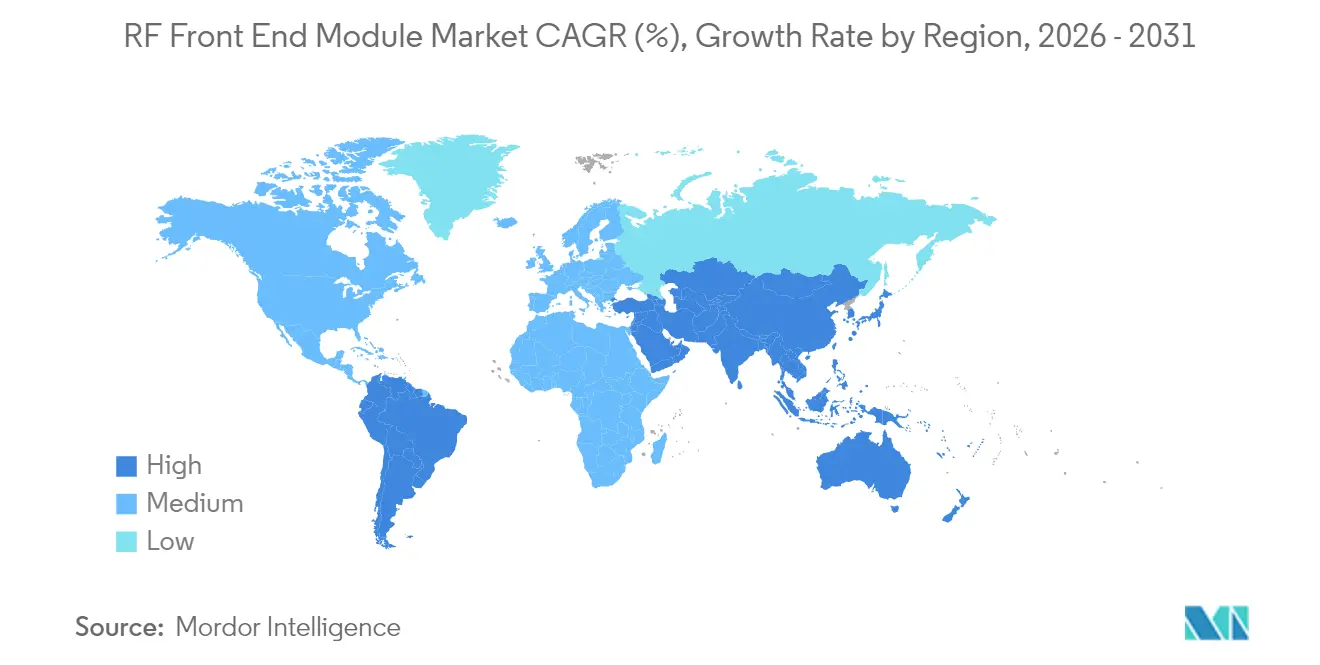
- By geography, Asia-Pacific commanded 56.88% share in 2025; Middle East and Africa is positioned to post the fastest 13.95% CAGR to 2031.
Note: Market size and forecast figures in this report are generated using Mordor Intelligence’s proprietary estimation framework, updated with the latest available data and insights as of 2026.
Market Trends and Insights
Drivers Impact Analysis of RF Front End Module Market*
| Driver | (~) % Impact on CAGR Forecast | Geographic Relevance | Impact Timeline |
|---|---|---|---|
| Explosive 5G design-wins in sub-6 GHz smartphones | +3.2% | Global, led by APAC and North America | Short term (≤ 2 years) |
| Rapid mmWave adoption in fixed wireless access (FWA) CPE | +2.8% | North America and EU, expanding to APAC | Medium term (2-4 years) |
| OEM push for integrated modem-to-antenna platforms | +2.1% | Global, concentrated in premium segments | Medium term (2-4 years) |
| GaAs wafer capacity expansion in Taiwan and China | +1.9% | APAC core, supply benefits global | Long term (≥ 4 years) |
| Defense demand for GaN-based AESA radar modules | +1.7% | North America, EU, select APAC markets | Long term (≥ 4 years) |
| "Right-to-Repair" laws extending handset lifecycles | +0.8% | EU and select US states, expanding globally | Long term (≥ 4 years) |
| Source: Mordor Intelligence | |||
Explosive 5G Design-Wins in Sub-6 GHz Smartphones
Carrier rollouts prioritize blanket coverage, making sub-6 GHz the volume engine for the RF front end module market. Samsung’s adoption of the SKY5 platform trimmed board area by 30% while boosting battery endurance.[2] Device makers now rate RF performance alongside camera quality when defining premium tiers. Tight footprints, multi-band carrier aggregation, and stricter SAR limits favor consolidated FEMs over discrete chains. Suppliers with algorithm-assisted envelope tracking add power efficiency, a point that resonates with sustainability targets. The result is a virtuous cycle in which every design win feeds production scale that, in turn, lowers per-unit cost.
Rapid mmWave Adoption in Fixed-Wireless Access (FWA) CPE
Verizon’s service footprint grew to 40 million homes in 2024, confirming the economic logic of mmWave FWA.[3] CPE devices accept bigger antennas, so each install embeds four to eight mmWave RF chains-up to 4× the smartphone content. Higher bill-of-materials value per node lifts the RF front end module market even with moderate unit volumes. Policy makers allocate spectrum preferentially to fixed services, reducing interference risk and facilitating beam-steering antennas that remain stationary. Suppliers that master thermal dissipation in outdoor units secure sizable margins, because mmWave PAs still command premium ASPs.
OEM Push for Integrated Modem-to-Antenna Platforms
Qualcomm and TDK formed RF360 with a USD 3 billion valuation, linking baseband IP and discrete RF skills into turnkey stacks.[4] Mid-tier handset brands lacking custom RF expertise gravitate toward such platforms, thus concentrating demand on vendors that offer silicon-to-antenna coverage. Platform control shifts bargaining power away from discrete specialists, pressuring them to buy or license missing elements. Integration also trims software validation cycles, a value proposition when launch windows shrink. The RF front end module market therefore tilts toward vendors able to synchronize firmware, filters, PAs, and tuners in one reference design.
GaAs Wafer Capacity Expansion in Taiwan and China
WIN Semiconductors and mainland peers are adding 40% wafer output to ease bottlenecks. Expanded fabs lower per-wafer costs, stabilizing gross margins despite falling ASPs in power amplifiers. The geographic spread mitigates single-region risk exposed during recent lockdowns. Long-term supply contracts now include audit clauses for ESG practices, ensuring continuity for defense and telecom customers. For the RF front end module industry, capacity visibility de-risks project timelines, letting OEMs plan multiyear platforms with confidence.
Restraints Impact Analysis of RF Front End Module Market*
| Restraint | (~) % Impact on CAGR Forecast | Geographic Relevance | Impact Timeline |
|---|---|---|---|
| Looming IP shortages for BAW filter patents | -1.8% | Global, most acute in Asia-Pacific | Medium term (2-4 years) |
| Talent gap in mmWave packaging engineers | -1.2% | North America and EU, expanding to APAC | Short term (≤ 2 years) |
| Tight gallium supply chain amid export restrictions | -2.3% | Global, most severe for GaN applications | Short term (≤ 2 years) |
| On-device AI reducing RF Tx duty-cycle | -0.9% | Premium smartphone segments globally | Long term (≥ 4 years) |
| Source: Mordor Intelligence | |||
Looming IP Shortages for BAW Filter Patents
Foundational BAW patents near expiry, yet follow-on innovations have plateaued. Few suppliers hold the residual know-how for GHz-range Q-factor leadership, so licensing fees climb. OEMs trying to add new bands must either pay premiums or switch to TC-SAW, which can underperform in high-temperature use. Patent cliffs motivate defensive litigation that diverts R&D funds. Smaller entrants face high barriers, concentrating bargaining power with incumbents and slowing price erosion in the filter slice of the RF front end module market.
Tight Gallium Supply Chain Amid Export Restrictions
China’s curbs on gallium export tighten feedstock for GaN wafers, vital to high-power PAs. Spot prices surged in 2024, prompting OEMs to dual-source or pre-buy inventory. Defense and satellite contracts, which cannot down-bin performance, absorb higher costs, but price-sensitive infrastructure projects consider silicon LDMOS substitutes. Western governments weigh strategic stockpiles, yet ramp-up timelines for alternative refining exceed two years. Such volatility injects risk premia into long-term supply agreements, mildly tempering the RF front-end module market CAGR despite ongoing volume growth.
*Our forecasts treat driver/restraint impacts as directional, not additive. The impact forecasts reflect baseline growth, mix effects, and variable interactions.
RF Front End Module Market Segment Analysis
By Component:
Integration Consolidates Value PoolsFilters controlled a 33.78% share of the RF front-end module market in 2025 and remain indispensable for band proliferation. Antenna tuners, however, post a category-leading 13.98% CAGR as impedance-matching across a fragmented spectrum turns into a design must-have. The RF front-end module market size for hybrid FEMs is projected to climb steadily because integrating switches, LNAs, and duplexers lowers insertion loss and simplifies thermal layout. Power amplifiers face ASP compression as OEMs bundle them with controllers, though GaN processes preserve margin in high-power niches. Switches enjoy steady pull from carrier aggregation, especially as 3-CC downlink becomes mainstream in mid-band devices.
Low-noise amplifiers ride coverage-extension campaigns in rural zones, where receiver sensitivity outweighs peak data rate. Discrete duplexers stay relevant for legacy LTE bands, but next-gen time-division duplex lowers their attach rate in select 5G frequencies. Qorvo’s 2024 FEM line shaved 40% PCB footprint versus prior discrete builds, highlighting how form-factor wins can substitute for raw component performance. As a result, component vendors recalibrate roadmaps to favor highly integrated SIPs, aligning with OEM procurement strategies that reward module-level cost per function.

By Application:
Automotive Upsets Consumption HierarchyConsumer electronics retained a 67.35% share in 2025, underscoring smartphones’ centrality to the RF front-end module market. Yet automotive applications clock a 14.21% CAGR as regulators mandate V2X capability and infotainment screens adopt Wi-Fi 7. Vehicle form-factors enable thicker boards and active-cooling PAs, widening the performance envelope. Industrial private-5G rollouts foster bespoke RF architectures tuned to factory-floor constraints, diverting some demand from broad-market chipsets. Aerospace and defense preserve premium ASPs through GaN-based AESA modules, a small-volume but margin-rich pocket.
Wireless infrastructure modules scale with mid-band macro base-station deployments, though commoditization persists as OEMs standardize RF lineups across regions. Automotive’s temperature and reliability mandates raise qualification costs but also lock in multiyear supply, stabilizing revenue. Suppliers adept at AEC-Q100 and ISO 26262 certification extract a higher share of the RF front-end module market size allocated to vehicles. Smartphone volatility, conversely, forces inventory agility, making platform reuse across price tiers a competitive requirement.
By Frequency Range:
Sub-6 GHz Retains Mass, mmWave Captures ValueSub-6 GHz held 73.45% of the RF front-end module market share in 2025, reflecting coverage-driven 5G priorities. Its unit dominance will persist, but mmWave segments expand at a 13.72% CAGR through 2031 on the back of urban densification and FWA. Suppliers bifurcate product lines: cost-optimized silicon for mid-band phones versus premium GaAs or SiGe for mmWave CPE and hotspots. Beamforming ASIC maturity lowers antenna-array bill-of-materials, trimming the adoption cost barrier for mmWave nodes. Research above 47 GHz remains exploratory, yet early 6G trials secure pipeline visibility for next-decade revenue.
The RF front-end module market size tied to mid-band frequencies benefits from high-yield processes and cheaper substrates. In contrast, mmWave modules command 2×-3× ASPs thanks to advanced packaging and phased-array complexity. Vendors capable of cross-frequency portfolios insulate themselves against cycles in any single band, while pure-play mmWave entrants bet on CAGR acceleration as spectrum demand grows.

Geography Analysis
APAC RF Front End Module Market
Asia-Pacific maintained 56.88% share of the RF front end module market in 2025, powered by China’s handset output and South Korea’s dense 5G builds. Integrated supply chains encompass raw gallium refining, wafer fabrication, and module assembly, yielding cost and cycle-time advantages few regions can match. Japan’s USD 10 trillion semiconductor program strengthens local ecosystem resilience and funds compound semiconductor pilot lines.
North America RF Front End Module Market
North America leverages defense budgets and early 5G adoption to sustain high-performance design leadership. MACOM’s USD 345 million GaN expansion joins multiple advanced-packaging initiatives aimed at closing the manufacturing gap with Asia. However, component imports still dominate the volume of consumer devices, exposing OEMs to cross-border logistics risk.
EMEA, South America and APAC RF Front End Module Market
Middle East and Africa posts a 13.95% CAGR as operators bypass 4G and leapfrog to standalone 5G. Government digital-economy strategies fund towers and spectrum, but device affordability dictates a sub-6 GHz focus. Europe enjoys demand from the automotive and Industry 4.0, where GDPR and supply-chain sovereignty push brands to source locally. South America and emerging ASEAN markets absorb technology transfer as suppliers chase untapped subscriber growth.
Regulatory Landscape
Regulatory compliance for RF front-end modules is shaped by radio equipment market-access rules and conformance testing requirements that flow down from end devices. In the European Union, the Radio Equipment Directive (RED, 2014/53/EU) sets essential requirements that cascade to FEM designs through OEM type-approval and harmonized testing, while the United States uses FCC frameworks, including 47 CFR Part 15, which influence emissions, spurious performance, and coexistence behavior within integrated RF chains.
In 2026, standards activity adds additional test anchors for OEM qualification cycles, including ETSI TS 138 161 V19.3.0 (Release 19) defining TRP/TRS methods for 5G NR user equipment, and ETSI EN 302 326-2 with a national transposition milestone dated March 12, 2026 for fixed radio systems. Alongside technical compliance, policy tools also affect sourcing and cost, including a US Federal Register proclamation dated January 20, 2026 that imposes a 25% ad valorem tariff on a narrow category of advanced computing chips and derivative products, with specified exemptions tied to domestic supply chain buildout, and US congressional scrutiny of semiconductor export controls through H.R. 8287 (Semiconductor Controls Effectiveness Act of 2026).
Value Chain Analysis
The RF front-end module value chain begins with specialized materials and substrates, including gallium-based compounds and piezoelectric films, then moves into device fabrication on RF-focused process nodes that are not interchangeable with mainstream logic. GaAs HBT supports power amplifiers, RF-SOI supports switches and control, and SAW/BAW processes support acoustic filters. Fabricated die then transition to advanced packaging and module assembly (SiP, AiP for higher frequencies), followed by RF test, calibration, and OEM qualification, where end-product type approval (FCC/RED and carrier requirements) becomes a gating step before high-volume ramps.
Bottlenecks concentrate upstream, particularly in acoustic filter capacity where only a limited set of fabs can produce smartphone-grade SAW/BAW at volume, which makes filters a key constraint and an area of vendor leverage. Midstream dynamics are increasingly shaped by integration and heterogeneous packaging to reduce board area and insertion loss. For example, GlobalFoundries announced in July 2026 that its SLATE wafer-to-wafer bonding technology is production-ready on its 9SW RF-SOI platform for cellular front-end modules, highlighting packaging as a differentiator that links foundries, OSATs, and module houses. On the demand side, platform-style procurement, such as turnkey modem-to-antenna stacks, tightens coupling between component selection and software/tuning, raising switching costs once a handset or CPE design is locked.
Competitive Landscape
Three dynamics now frame competition. First, systems integration overtakes discrete component specmanship. Skyworks partnered with Samsung to embed transceiver-to-antenna chains that save 30% board space, a response to OEM calls for turnkey stacks. Second, customer concentration cuts both ways: Apple’s decision to trim Skyworks orders by up to 25% revealed revenue fragility when top clients pivot sourcing. Third, patent depth in BAW filters and GaN epitaxy sustains defensive moats that slow commoditization.
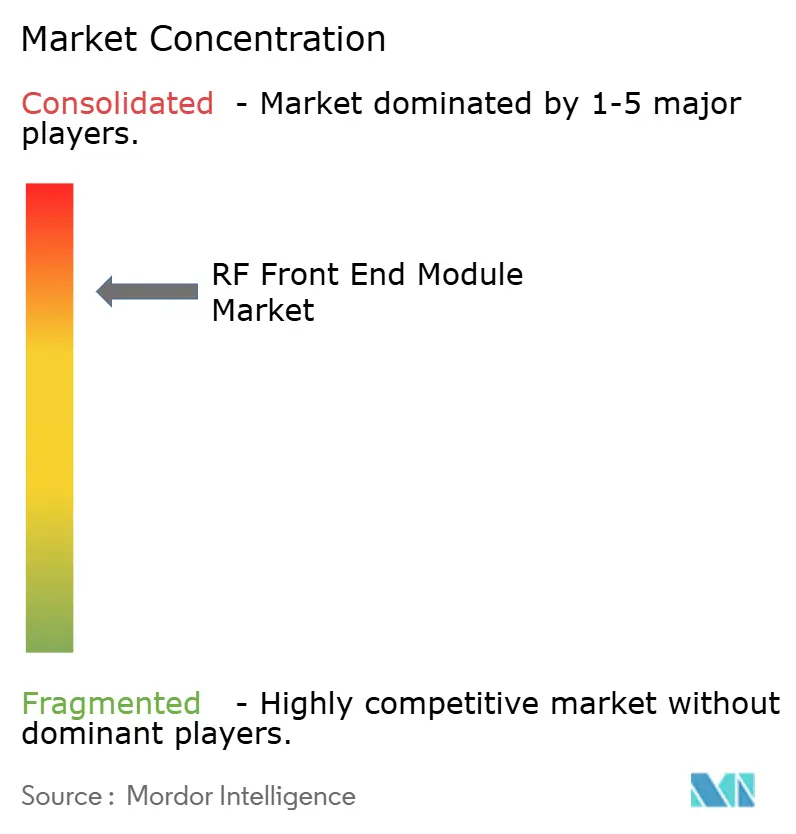
The top five firms, Broadcom, Skyworks, Qorvo, Qualcomm-TDK RF360, and Murata, controlled about 60% of the RF front end module market share in 2024. Yet mid-tier challengers gain ground in automotive and industrial niches where incumbents remain phone-centric. M&A reshapes capability maps: Qorvo bought Anokiwave for beamforming ASICs, Guerrilla RF picked up a GaN PA portfolio, and pSemi introduced AI-tuned antenna modules. Price wars intensify for sub-6 GHz sockets, but mmWave and defense platforms defend margins through technology differentiation.
Intellectual-property leverage determines royalty flows, especially in filters. Vendors with aging portfolios accelerate next-gen TC-SAW or XBAR R&D to sustain licensing revenues. Contract manufacturing partnerships, particularly in Taiwan, help pure-play design houses scale output without capex overload. Sustainability metrics enter RF module RFQs, rewarding factories that document energy use and recyclable packaging.
RF Front End Module Industry Leaders
-
Qualcomm Technologies, Inc.
-
Skyworks Solutions, Inc.
-
Murata Manufacturing Co., Ltd.
-
Qorvo, Inc.
-
Broadcom Inc.
- *Disclaimer: Major Players sorted in no particular order
RF Front End Module Market Companies Covered in this Report
- Skyworks Solutions, Inc.
- Qorvo, Inc.
- Murata Manufacturing Co., Ltd.
- Qualcomm Technologies, Inc.
- Broadcom Inc.
- NXP Semiconductors N.V.
- Infineon Technologies AG
- Taiyo Yuden Co., Ltd.
- TDK Corporation
- Skyworks Aerolab Pte. Ltd.
- Wisol Co., Ltd.
- Akoustis Technologies, Inc.
- Resonant Inc.
- pSemi Corporation
- Maxscend Microelectronics Co., Ltd.
- Unisoc (Shanghai) Technologies Co., Ltd.
- Jiangsu Hengxin Technology Co., Ltd.
- Kyocera Corporation
- RFHIC Corporation
- MACOM Technology Solutions Holdings, Inc.
- WIN Semiconductors Corp.
- Silterra Malaysia Sdn. Bhd.
- Optimum Semiconductor Technologies Inc.
- Finwave Semiconductor, Inc.
- UMC RF Solution Business Unit
- Tower Semiconductor Ltd.
Market Opportunities and Future Outlook
A key whitespace is securing and regionalizing high-performance acoustic filter capacity (SAW/BAW) and associated module integration for premium smartphones and multi-band devices. Supply is concentrated, and redesign costs are high once sockets are won. A concrete 2026 signal is Apple and Broadcom’s multi-year agreement exceeding USD 30 billion for US-made custom silicon, including FBAR filters and wireless connectivity components, alongside a USD 1.5 billion expansion and modernization of Broadcom facilities in Fort Collins, Colorado. This type of capacity-linked commitment improves opportunities for suppliers that can provide assured filter output, qualification support, and long-term roadmaps across sub-6 GHz and emerging bands.
Another opportunity area is higher-frequency and new-band readiness, especially FR3 (7-15 GHz) and mmWave modules that demand tighter co-design across PAs, LNAs, filters, and antennas with advanced packaging. AiP is a mainstream approach below 60 GHz, while AoC exploration starts to take hold above 60 GHz. In 2026, ecosystem activity around FR3 hardware, including Sivers Semiconductors Daybreak beamforming ICs for 7-15 GHz and Skyworks public FR3 demonstrations, supports active development pathways where module suppliers can differentiate through thermal management, calibration, and antenna integration for fixed wireless access CPE, enterprise gateways, and early 5G-Advanced and 6G trial hardware.
Recent Industry Developments in RF Front End Module Market
- July 2026: Skyworks Solutions launched a Sky5 5G NR front-end module for US mid-band 5G and reported carrier approval. The launch reinforces its position in tightly qualified operator ecosystems where approved RFFE designs can become reference sockets for multiple device tiers. It also underscores the move toward single-package solutions that save PCB area and simplify RF design-in for OEMs.
- March 2026: Skyworks Solutions and MediaTek demonstrated early FR3 and Power Class 1 RFFE innovations at Mobile World Congress 2026, including an FR3 LNA and a PA module with integrated filters. The demonstrations align RFFE roadmaps with emerging band discussions and highlight integration approaches needed to manage loss, filtering, and linearity at higher frequencies. Visibility at MWC also signals which vendors are positioning for pre-standard platform engagements with OEMs and infrastructure partners.
- December 2024: Samsung Electronics and Skyworks Solutions disclosed a strategic partnership to integrate SKY5 platforms in Galaxy smartphones, citing a 30% RF board area reduction. This collaboration shows how flagship handset design constraints are pushing vendors toward more integrated FEM platforms rather than discrete chains. The board-space and power-efficiency benefits also raise the competitive bar for rivals that lack modem-to-antenna co-optimization.
RF Front End Module Market Report Scope and Research Methodology
Market Definition and Coverage
This market covers the revenue generated from RF front end modules that sit between the antenna and the baseband, combining amplification, filtering, switching, duplexing, and tuning to support wireless connectivity in devices and systems.
Scope exclusions: We exclude baseband processors, antennas, and full radio units where the RF front end cannot be separated as a module value.
Segments Covered in This Report
- By Component
- Power Amplifiers (PA)
- Duplexers and Diplexers
- Filters (SAW, BAW, TC-SAW)
- Switches
- Low-Noise Amplifiers (LNA)
- Antenna Tuners
- Integrated/Hybrid FEMs
- By Application
- Consumer Electronics (Smartphones, Wearables)
- Automotive (ADAS, V2X Communication)
- Wireless Communication (5G, Wi-Fi 6/6E)
- Industrial
- Aerospace and Defense
- Others Applications
- By Frequency Range
- Sub-6 GHz (FR1)
- mmWave (24-47 GHz, FR2)
- More than 47 GHz (6G R&D bands)
- By Geography
- North America
- United States
- Canada
- Mexico
- South America
- Brazil
- Argentina
- Chile
- Rest of South America
- Europe
- United Kingdom
- Germany
- France
- Italy
- Spain
- Rest of Europe
- Asia-Pacific
- China
- Japan
- India
- South Korea
- Australia
- Singapore
- Malaysia
- Rest of Asia-Pacific
- Middle East and Africa
- Middle East
- Saudi Arabia
- United Arab Emirates
- Turkey
- Rest of Middle East
- Africa
- South Africa
- Nigeria
- Rest of Africa
- Middle East
- North America
Data Sources, Market Sizing, and Validation
Desk Research
Desk research helps set the boundaries of what counts as an RF front end module and what does not. It also provides starting points for device shipments and network build activity. We mainly lean on public sources such as ITU spectrum and technology references, FCC equipment authorization data, OECD digital economy indicators, World Bank macro series, and UN Comtrade trade statistics for relevant electronics categories.
On top of that, we review company annual reports, earnings call transcripts, investor presentations, and credible press coverage to understand product-mix changes, capacity moves, and regional demand signals. Patent databases and public standards documentation (for example, 3GPP releases) are used to sanity check timing for technology transitions such as sub-6 GHz to mmWave adoption. For company financials and news context, we also use a paid subscription database that aggregates filings and corporate actions. The desk sources listed here are illustrative, and other public references were also used for data collection, cross-checking, and clarification.
Primary Interviews and Surveys
Primary work is used to pressure-test the desk assumptions and to fill gaps such as module-level pricing direction, typical bill-of-material share, and how quickly 5G and Wi-Fi design cycles translate into shipments. We spoke with a mix of component makers, module integrators, OEM and ODM ecosystem participants, and downstream buyers across major regions so demand signals are not taken from one geography alone.
Distribution of primary research fieldwork respondents
| Company type | Respondent position | Region |
|---|---|---|
| Top tier: 28% | CXOs: 19% | APAC: 49% |
| Mid tier: 50% | Functional/Unit leaders: 37% | EMEA: 32% |
| Smaller Players: 22% | Managers: 44% | Americas: 19% |
Market-Sizing & Forecasting
Sizing starts with a top-down build where device and system demand pools are reconstructed from shipment and deployment indicators, then translated into RF front end module value using attach rates and price logic that fits each application. Because design content differs by use case, we separate the model by smartphones and other consumer devices, vehicles with connectivity, wireless infrastructure, and industrial and defense demand.
Key inputs include smartphone and connected-device shipments, the 4G to 5G mix progression, frequency band mix (sub-6 GHz versus mmWave where applicable), average module content per device, and observed pricing movement for filters, power amplifiers, switches, and integrated FEMs. When the top-down totals look too high or too low, we corroborate them through selective bottom-up approximations, such as sampled ASP times shipment volumes for a set of commonly shipped device categories, plus channel checks on component availability and lead times. Where module pricing is not directly visible, gaps are handled using component-mix proxies and conservative ranges that are then narrowed through interviews.
For forecasting, scenario analysis is used first to reflect different adoption speeds for 5G, Wi-Fi upgrades, and automotive connectivity, followed by regression-based checks against macro demand indicators and shipment consensus. The final path is chosen after aligning the variable outlook with what experts expect for design cycles and inventory normalization.
Data Validation & Update Cycle
Validation is done through multiple checks so one single data point does not drive the output. Model totals are compared against independent signals such as regional electronics production trends, trade flows for relevant categories, and the implied module value per device, and then outliers are reviewed until the assumptions are explainable.
Before sign-off, the numbers go through multi-step analyst reviews, with re-contact triggers used when a key variable shifts materially, such as a sudden change in smartphone mix or a swing in component pricing. The report is refreshed annually, and interim updates are made when major events occur that can change demand or pricing. Right before delivery, a final pass is completed so clients receive the latest updated view.
Mordor Intelligence's Rf Front End Module Market Sizing Compared With Other Published Estimates
Published market sizes for RF front end modules often do not match because the timing and mechanics behind the math are not the same, even when the topic name looks identical. Differences usually come from how module scope is defined, which device and infrastructure demand pools are counted, and how pricing is converted into USD for the stated year.
A refresh-led gap is also common in this market because ASPs can move quickly with filter mix changes, integration levels, and inventory corrections. Currency timing used for conversion can also shift a stated value by a noticeable amount. By rechecking ASP direction and FX assumptions close to publication and cross-validating them with shipment and design-cycle signals, Mordor Intelligence keeps the 2026 market value closer to what buyers and suppliers saw during that year.
Benchmark comparison
| Source | Market Size | Gaps in Research Methodology |
|---|---|---|
| Mordor Intelligence | USD 33.06 B (2026) | |
| Industry Publisher A | USD 26.54 B (2024) | Uses an earlier base year and a receiver-chain definition that can miss some integrated transmitter-side content, and the USD value is sensitive to the conversion timing used for 2024. |
| Industry Publisher B | USD 28.40 B (2025) | Applies a narrower component basket and a different approach to price evolution across filters and amplifiers, which can dampen the step-up expected from higher 5G content. |
The table shows that the spread is mainly explained by year selection, what is counted as a module versus a set of components, and how pricing and currency are treated in fast-moving periods. When the scope is stated clearly and the value is tied back to visible demand indicators, the result becomes easier to reproduce and to update as new shipment and pricing signals come in.
Key Questions Answered in the Report
How large is the RF front end module market in 2026?
The RF front end module market size is USD 33.06 billion in 2026.
What is the forecast CAGR for RF front-end modules through 2031?
The market is projected to grow at a 13.02% CAGR from 2026 to 2031.
Which region leads demand for RF front-end modules?
Asia-Pacific commands 56.88% share owing to its combined manufacturing base and 5G deployment scale.
Which segment is the fastest-growing application?
Automotive applications expand at a 14.21% CAGR as V2X and infotainment connectivity become standard.
Why are antenna tuners growing faster than other components?
Adaptive impedance matching across fragmented 5G bands lifts antenna tuner demand, driving a 13.98% CAGR.
What is driving mmWave module adoption?
Fixed-wireless access deployments allow larger CPE units that incorporate multiple mmWave RF chains, boosting module value per install.