
Revenue Assurance Market Size and Share
Market Overview
| Study Period | 2020 - 2031 |
|---|---|
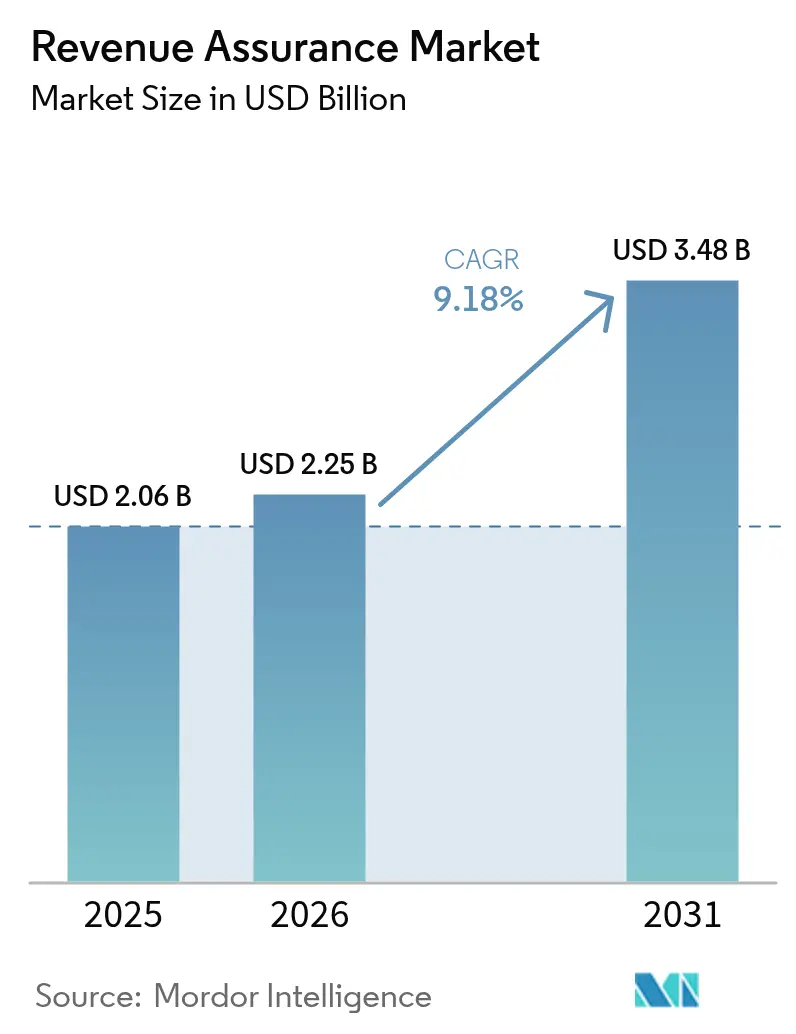
| Market Size (2026) | USD 2.25 Billion |
| Market Size (2031) | USD 3.48 Billion |
| Growth Rate (2026 - 2031) | 9.18 % |
| Fastest Growing Market | Asia Pacific |
| Largest Market | North America |
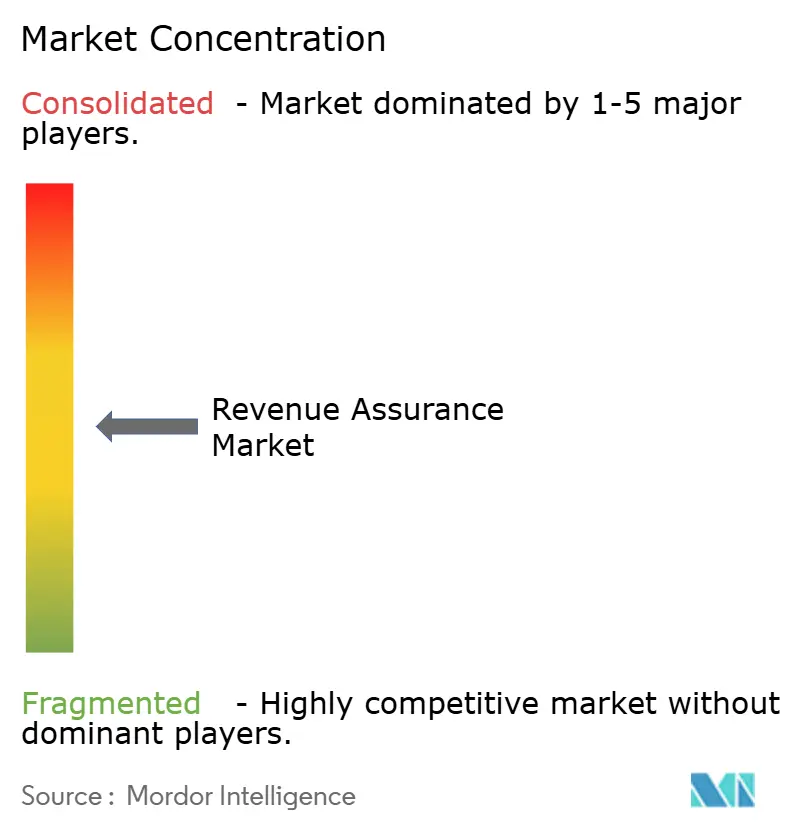
| Market Concentration | Medium |
Major Players *Disclaimer: Major Players sorted in no particular order Image © Mordor Intelligence. Reuse requires attribution under CC BY 4.0. | |
Revenue Assurance Market Analysis by Mordor Intelligence
The revenue assurance market size in 2026 is estimated at USD 2.25 billion, growing from 2025 value of USD 2.06 billion with 2031 projections showing USD 3.48 billion, growing at 9.18% CAGR over 2026-2031. Rising data volumes from 5G network slicing, usage-based software subscriptions, and smart meter rollouts are exposing gaps in legacy billing engines, prompting operators and enterprises to deploy AI-driven analytics that reconcile transactions in real-time. Adoption is moving beyond telecom into utilities, BFSI, healthcare, and government as stakeholders recognize that revenue, cost, and margin leakages all erode profitability if left unchecked. Cloud-native delivery is accelerating adoption by reducing capital expenditure requirements, while managed services alleviate the shortage of data engineers who understand both billing protocols and machine learning pipelines. At the same time, privacy regulations that limit cross-border call-detail-record transfers are prompting regionally distributed deployments that favor vendors with flexible data-residency controls.[1]
Key Report Takeaways
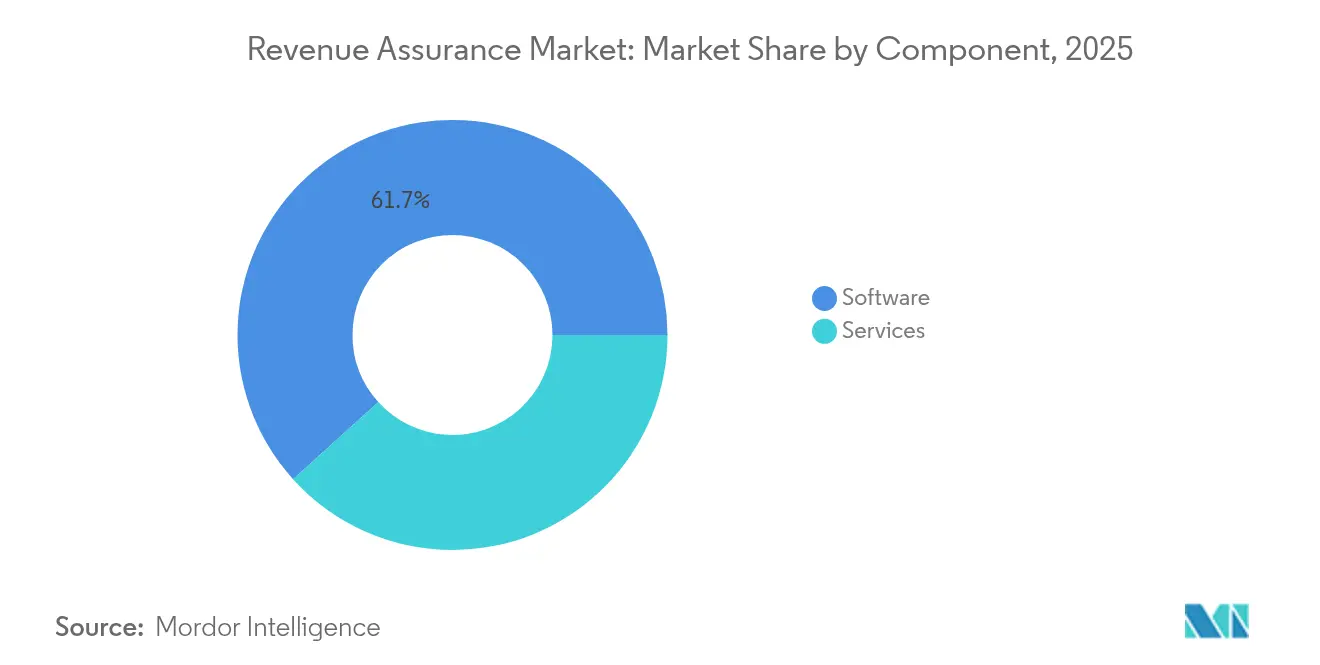
- By component, software captured 61.70% of the revenue assurance market share in 2025, while the services segment is expected to expand at a 10.62% CAGR through 2031.
- By deployment mode, cloud deployment accounted for 56.30% of the revenue assurance market size in 2025 and is forecast to grow at an 10.88% CAGR to 2031.
- By end-use industry, telecom held 48.20% of revenue of the revenue assurance market share in 2025; utilities are the fastest-growing end-use vertical, advancing at a 12.96% CAGR through 2031.
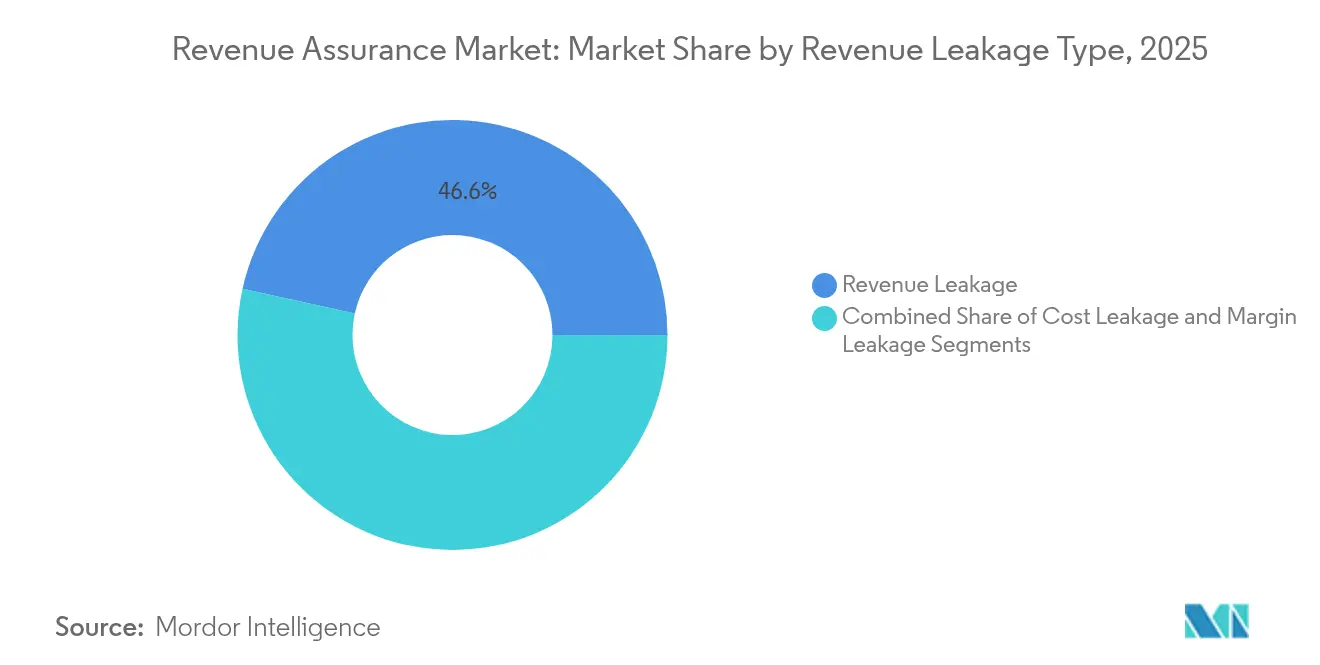
- By revenue leakage type, revenue leakage represented 46.55% of the 2025 base of the revenue assurance market share; however, margin leakage is the fastest-growing leakage category, with a 11.74% CAGR forecast.
- By organization size, large enterprises commanded 64.40% of the 2025 spending of the revenue assurance market share; small and medium-sized enterprises are expected to adopt cloud modules at a 10.63% CAGR through 2031.
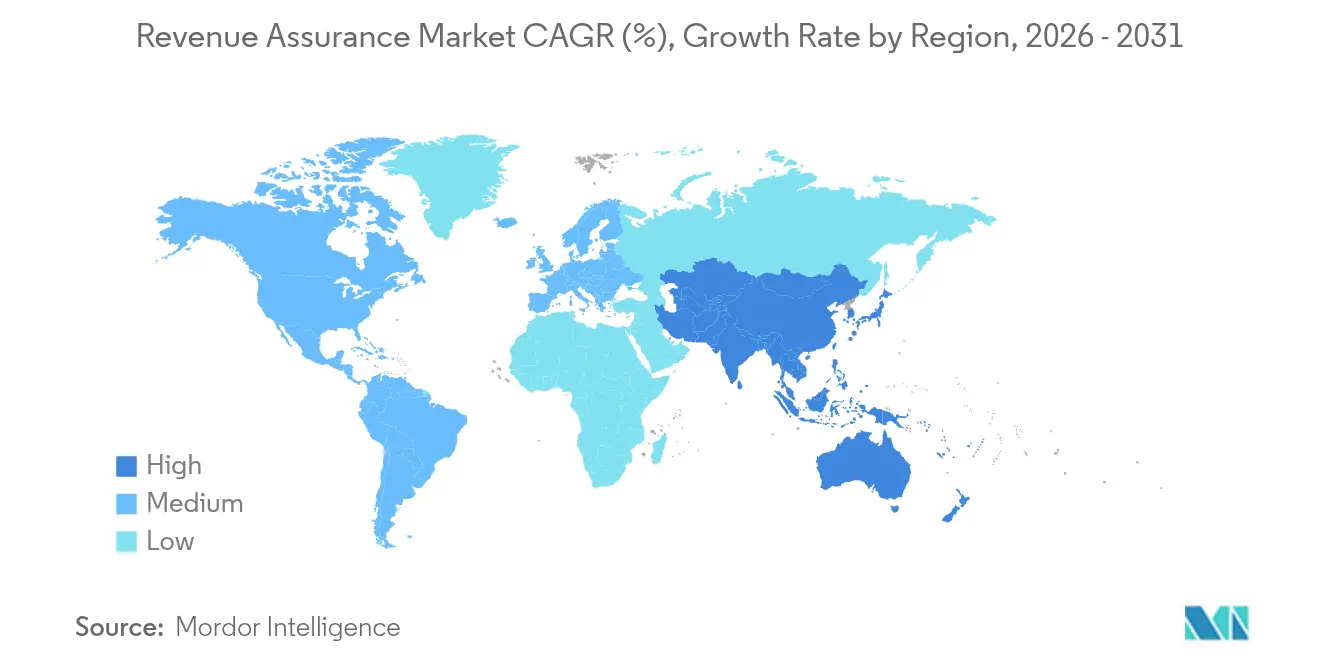
- By geography, North America led with a 35.95% share of the global revenue assurance market in 2025, while the Asia-Pacific is projected to record the highest regional CAGR of 11.98% through 2031.
Note: Market size and forecast figures in this report are generated using Mordor Intelligence’s proprietary estimation framework, updated with the latest available data and insights as of 2026.
Market Trends and Insights
Drivers Impact Analysis of Revenue Assurance Market*
| Driver | (~) % Impact on CAGR Forecast | Geographic Relevance | Impact Timeline |
|---|---|---|---|
| Rising complex business environment and practices | +1.8% | Global, pronounced in North America and Europe | Medium term (2-4 years) |
| Rising need to adhere to numerous revenue streams | +1.6% | Global, especially Asia-Pacific and North America | Short term (≤2 years) |
| Proliferation of subscription-based business models | +1.9% | North America, Europe, Asia-Pacific urban centers | Medium term (2-4 years) |
| Real-time AI-driven anomaly detection adoption | +2.1% | Global, led by North America and Asia-Pacific | Short term (≤2 years) |
| Emergence of blockchain-based smart contracts | +1.3% | Europe, Middle East, select Asia-Pacific markets | Long term (≥4 years) |
| 5G network slicing monetization complexity | +1.5% | Asia-Pacific, North America, Europe | Medium term (2-4 years) |
| Source: Mordor Intelligence | |||
Rising Complex Business Environment And Practices
Digitally enabled supply chains now encompass direct sales, e-commerce, channel partners, and API ecosystems, generating heterogeneous transaction files that exceed the reconciliation capabilities of legacy billing engines. Siemens documented manual interventions in project-based revenue recognition when contract amendments spanned fiscal periods, reinforcing the need for automated allocation logic.[2] The TM Forum’s Open Digital Architecture, adopted by more than 800 service providers in 2024, harmonizes API contracts while still leaving gaps when third-party applications inject pricing overrides. SAP’s convergent invoicing release consolidates subscription charges, usage fees, and one-time items onto a single invoice, thereby reducing reconciliation cycles that historically masked leakage. Softcat disclosed that principal-versus-agent classification missteps materially skewed margins, demonstrating how nuanced accounting logic drives demand for analytics that parse contract clauses at scale. As enterprises normalize multi-channel commerce, CFOs increasingly view revenue assurance as essential infrastructure rather than optional insurance.
Rising Need To Adhere To Numerous Revenue Streams
Organizations selling bundled hardware, software, and services face highly granular revenue-recognition calendars that shift with every contract modification. Industrial firms juggling milestone-based projects and product-as-a-service contracts must synchronize progress percentages, time-based subscriptions, and usage triggers in a single ledger. The result is a proliferation of sub-ledgers, each vulnerable to timing mismatches that leak invoiceable events. Utilities replacing flat-rate tariffs with real-time, time-of-use pricing encounter similar challenges as millions of 15-minute smart-meter reads multiply transaction counts. Government agencies digitizing tax collection mirror the dynamic, multiple filing channels feed a central treasury, and mismatched identifiers cause leakage when returns cannot be matched to payments. Enterprises, therefore, deploy analytics engines that ingest heterogeneous feeds, standardize identifiers, and surface missing or duplicated events before they hit the general ledger.
Proliferation Of Subscription-Based Business Models
Recurring-revenue models magnify even small rating errors because a mispriced unit propagates across every renewal cycle. Adecco demonstrated that compressing days-sales-outstanding by four days unlocked USD 120 million in working capital, proof that billing precision influences cash velocity.[3] Zuora’s Subscription Economy Index revealed that involuntary churn from failed payments accounted for up to 40% of total churn among small SaaS vendors, a risk that revenue assurance platforms mitigate through automated dunning and payment method refreshing. Netflix and Spotify pioneered retry logic, but many mid-market firms lack engineering bandwidth, creating demand for SaaS-based assurance modules. Usage-based pricing deepens complexity because consumption meters may under-report due to throttling or misconfigured APIs, eroding revenue even when invoices technically reconcile with logs. Automated validation against entitlement rules, therefore, becomes central to recurring models.
Real-Time AI-Driven Anomaly Detection Adoption
Batch reconciliation exposes discrepancies only after the financial close, leaving operators to chase errors that are weeks old. Neural Technologies’ 2024 deployment with a Middle Eastern carrier reduced detection latency from 72 hours to under five seconds, exemplifying the value of streaming analytics. Tecton’s feature platform automates feature engineering, enabling data science teams to deploy anomaly detection models in hours instead of weeks. PwC found that the share of telecom executives using AI for fraud management grew from 38% in 2023 to 51% in 2024. StarTree’s real-time database, built on Apache Pinot, delivers sub-second scans over billions of billing events, allowing operators to flag unauthorized promotional discounts before month-end. As models mature, enterprises are feeding margin, cost, and revenue attributes into unified pipelines, expanding detection beyond fraud to profitability leakage.
Restraints Impact Analysis of Revenue Assurance Market*
| Restraint | (~) % Impact on CAGR Forecast | Geographic Relevance | Impact Timeline |
|---|---|---|---|
| Economic slowdown and currency fluctuations | –1.2% | Global, acute in Europe and emerging markets | Short term (≤2 years) |
| High implementation and integration costs for SMEs | –1.4% | Global, pronounced in South America and Africa | Medium term (2-4 years) |
| Shortage of skilled revenue-assurance data engineers | –0.9% | Global, severe in Asia-Pacific and Middle East | Long term (≥4 years) |
| Privacy regulations limiting cross-border CDR data transfer | –0.7% | Europe, North America, emerging Asia-Pacific | Medium term (2-4 years) |
| Source: Mordor Intelligence | |||
Economic Slowdown And Currency Fluctuations
Macroeconomic headwinds tighten IT budgets and lengthen procurement cycles, delaying projects even when margin erosion occurs. Flexera’s 2025 survey reported that firms waste 27% of cloud spending, yet 84% actively manage costs, signaling finance leaders’ willingness to cut discretionary initiatives before core optimizations. Currency volatility inflates imported software costs for operators in South America and Africa, depressing ROI calculations. Public-sector austerity further postpones modernization; the U.K. Treasury’s 2024 audit cited a GBP 21.9 billion overspend, forcing agencies to prioritize frontline services over system upgrades. In this atmosphere, vendors emphasize modular SaaS pricing and outcome-based contracts to preserve pipeline momentum.
High Implementation And Integration Costs For SMEs
Legacy billing platforms from the early 2000s often lack documented APIs, requiring bespoke connectors that add USD 50,000–USD 200,000 to deployment budgets. Oracle’s NetSuite SuiteBilling, priced at USD 999 per month, reduces licensing expenses but still relies on professional services engagements that can double the total cost of ownership. Many SME telecom operators in Latin America and Africa operate on thin EBITDA margins, which forces them to adhere to strict payback thresholds. Although managed services shift spending from capex to opex, stakeholders remain cautious until reference cases prove hard savings within 12 months. Vendors are responding with pre-configured templates and success-based pricing, yet cost remains the leading adoption hurdle below the enterprise tier.
*Our forecasts treat driver/restraint impacts as directional, not additive. The impact forecasts reflect baseline growth, mix effects, and variable interactions.
Revenue Assurance Market Segment Analysis
By Component:
Services Gain As Integration Complexity RisesServices are expanding at an 10.62% CAGR through 2031, reflecting enterprise demand for integration, data engineering, and model tuning expertise that complements packaged applications. Although software retained 61.70% of the 2025 value, cloud migrations and 5G monetization have made bespoke configuration unavoidable. Oracle’s purchase of Cerner’s revenue-cycle team included 1,200 consultants specializing in convergent billing, underscoring the strategic pivot toward bundled implementation support. The rise of managed services further blurs traditional lines, as providers remotely operate assurance stacks on behalf of clients seeking managed detection and response for billing events.
Professional services remain the largest sub-segment, but managed services are gaining ground as SMEs adopt outcome-based contracts. eClerx reported double-digit growth in outsourced assurance for hospitality and retail clients, industries that view billing accuracy as non-core. This momentum suggests the revenue assurance market will see services outpace license growth through 2031, particularly where AI models must be trained on client-specific leakage patterns.

By Deployment Mode:
Cloud Dominance Driven By SaaS EconomicsCloud deployment captured 56.30% of 2025 spending and is forecast to grow at an 10.88% CAGR, enabled by elastic compute and subscription pricing that lower barriers for proof-of-concept pilots. Amdocs’ CES on Azure lets telecom operators scale resources during rating peaks without permanently over-provisioning on-premises hardware. CSG’s cloud-only Ascendon reduces implementation timelines from 18 months to under 16 weeks, accelerating time to revenue when launching new 5G tariffs.
On-premises deployment remains necessary in jurisdictions with strict data-sovereignty mandates. The European Union’s GDPR prohibits exporting call-detail records outside the EEA, forcing regional nodes despite the cost-benefit of public clouds. Hybrid architectures are therefore proliferating: Netcracker’s 2024 Middle East rollout kept subscriber identifiers on private servers while streaming anonymized metrics to cloud AI engines. The revenue assurance market size for hybrid environments is projected to outgrow pure on-premises installations as compliance and cost optimization strategies converge.
By End-Use Industry:
Utilities Surge On Smart-Meter Data VolumesTelecom generated 48.20% of total revenue in 2025, but utilities are advancing at a 12.96% CAGR amid nationwide smart-meter rollouts that multiply billing events ninety-six fold. Itron’s deployment of 2.5 million meters across Europe introduced 15-minute interval reads, which overwhelmed manual reconciliation and cemented the case for automated analytics. Landis+Gyr’s Gridstream identified negative consumption spikes that previously went undetected, resulting in a 22% reduction in truck rolls in North America.
Healthcare, BFSI, and government are next-wave adopters. The U.S. GAO’s documentation of a USD 606 billion annual tax gap prompted public agencies to import telecom-style assurance into indirect tax collection. Oracle’s integration of Cerner assets aligns healthcare billing with insurance reimbursement, mirroring the convergence of telecom services. This industry diversification supports resiliency, insulating the revenue assurance market from telecom-specific capex cycles.
By Revenue Leakage Type:
Margin Leakage Gains Focus As Profitability Pressures MountRevenue leakage accounted for a 46.55% share in 2025, as unbilled usage and rating errors directly impacted top-line results. However, margin leakage’s 11.74% CAGR suggests that CFOs are now prioritizing profitability. Siemens reported that project overruns required manual margin reviews, a vulnerability now mitigated by dashboards that compare actual versus budget data in real-time. Softcat showed margin swings of 30 percentage points depending on principal-agent judgments, highlighting that correct invoices can still mask earnings erosion.
Platforms increasingly integrate cost feeds and pricing rules, enabling finance teams to trace leakages across revenue, cost, and margin dimensions. Oracle’s Fusion ERP links revenue recognition to project costing, surfacing budget deviations before quarter close. As macro conditions tighten, enterprises view margin assurance not as a luxury add-on but as the next evolution of billing accuracy.
By Organization Size:
SMEs Adopt Cloud Modules As Vendors Unbundle CapabilitiesLarge enterprises controlled 64.40% of 2025 outlays, reflecting transaction volumes that demand customized solutions. Tier-1 carriers deploying Amdocs’ CES routinely process billions of call records monthly, projects with professional services tags exceeding USD 10 million.
Conversely, SMEs are forecast to post an 10.63% CAGR as vendors unbundle monolithic suites into modular SaaS offerings. NetSuite SuiteBilling’s flat monthly fee and Subex’s ROC Fraud Management-as-a-Service, priced at USD 5,000 per month, democratize access to core functionality while masking infrastructure complexity behind managed services. Zuora found that SME SaaS vendors suffer involuntary churn rates up to 40%, making even small leakage fixes high-ROI. The pattern underscores how the revenue assurance market can drive volume growth by targeting underserved mid-market users.
Geography Analysis
North America Revenue Assurance Market
North America generated 35.95% of 2025 revenue as telecom, financial, and utility incumbents embedded assurance workflows over the last decade. AT&T and Verizon reduced SIM-swap fraud detection times to seconds by utilizing real-time AI, and government agencies drew lessons from a USD 606 billion tax gap report to digitize audit trails. Privacy mandates, such as the California Consumer Privacy Act, force operators to keep CDR data in-region, complicating vendor consolidation but driving demand for flexible, multi-cloud architectures. Despite market maturity, the region remains an incubator for AI and blockchain pilots that later scale globally.
APAC Revenue Assurance Market
The Asia-Pacific is the fastest-growing territory, with a 11.98% CAGR, thanks to 5G standalone deployments by China Mobile, Bharti Airtel, Reliance Jio, KDDI, and SoftBank. China Mobile’s industrial IoT slicing imposes dynamic pricing tied to latency, a billing challenge addressed by real-time assurance engines. Regional talent shortages are prompting operators to turn to managed services provided by Tata Consultancy Services and Tech Mahindra. By the early 2030s, rapid subscriber and data-usage growth is expected to make the Asia-Pacific the largest regional contributor to the revenue assurance market size.
EMEA Revenue Assurance Market
Europe, the Middle East, and Africa together present a mixed picture. GDPR’s strict data-residency rules create headwinds for centralized cloud deployment, yet operators like Vodafone and Orange achieved 15%–20% leakage reductions after rolling out AI fraud platforms. Middle Eastern carriers, such as Etisalat, leverage sovereign-wealth funding to modernize quickly, deploying convergent charging that aligns 5G and fixed services in a single ledger. Sub-Saharan Africa’s mobile-money surge introduces payment-processing risks that legacy voice-centric billing never managed. Currency volatility and economic cycles restrain near-term spending, but regulatory pressure for consumer protection sustains baseline demand.
Regulatory Landscape
Revenue assurance deployments in telecom are shaped by mandatory revenue reporting rules and data governance requirements. In the United States, the FCC updates guidance for contributor revenue reporting used for Universal Service Fund and related regulatory fee calculations through the FCC Forms 499-A and 499-Q instruction set for 2026, keeping revenue classification and reporting controls central to operator assurance workflows.
In India, the Telecom Regulatory Authority of India (TRAI) issued the Telecommunication Tariff (Seventy Second Amendment) Order, 2026 alongside the Accounting Separation (Amendment) Regulations, 2026 in March 2026, introducing graded financial disincentives tied to non-compliance with reporting requirements. Alongside these regulator requirements, telecom operators and vendors commonly align process controls to industry frameworks such as TM Forum GB941 revenue assurance standards and applicable ITU-T recommendations, supporting consistent leakage classification, reconciliations, and auditability across multi-operator ecosystems.
Value Chain Analysis
The revenue assurance value chain begins with upstream data creation and capture across network and digital service layers (CDRs, xDRs, mediation records, charging logs, payment events, CRM orders, and partner settlement files) and then expands through data transport, storage, and processing, increasingly in cloud and hybrid environments. Core solution providers (telecom BSS vendors and specialist assurance firms) deliver rating validation, reconciliation, anomaly detection, and case management, while system integrators and managed service providers operationalize these capabilities through data engineering, integration to OSS/BSS/ERP stacks, model tuning, and run operations.
The main bottlenecks remain integration and normalization across multi-vendor stacks and partner ecosystems (interconnect, CPaaS, roaming, and fintech adjacencies). Inconsistent identifiers and contract terms can create structural leakage. Recent ecosystem activity also shows how workflow design is shaped by vendors and industry bodies: XConnect partnered with the GSMA in January 2025 to strengthen international revenue share fraud controls, and Openmind Networks deployed AI-powered revenue assurance for XL Axiata in Indonesia in March 2025 to secure A2P SMS revenues. Downstream, operators and enterprises use assurance outputs as closed-loop actions, including pricing corrections, billing adjustments, partner dispute management, and fraud blocking, with governance increasingly tied to audit-ready evidence trails and data residency controls.
Competitive Landscape
The market tilts toward moderate fragmentation. Incumbent BSS suppliers Amdocs, Oracle, Ericsson, Nokia, and CSG, bundle revenue assurance into broader charging and policy suites. Amdocs embedded real-time anomaly detection in its CES platform, reducing fraud latency from 72 hours to five seconds for a Gulf operator. Meanwhile, Oracle unified charging, revenue management, and payments on a single cloud stack, thereby slashing integration overhead for mid-tier carriers.[4]
Specialists such as Subex, Mobileum, TEOCO, and Araxxe focus on fraud analytics and reconciliation, often winning deals where buyers value best-of-breed tools over stack consolidation. Mobileum accelerated its roadmap by acquiring a fraud analytics startup in January 2024, adding 35 data scientists who enhanced latency-sensitive account takeover prevention.
System integrators, including Tata Consultancy Services, Tech Mahindra, and eClerx, capitalize on the skills gap by offering managed services that operate clients’ platforms. The TM Forum’s Open Digital Architecture weakens historical lock-ins, allowing challengers to interoperate through standardized APIs and creating whitespace opportunities in government tax collection and utility smart metering. Vendors with embedded GDPR compliance and data-sovereignty controls possess an edge in Europe and similarly regulated markets.
Revenue Assurance Industry Leaders
-
Amdocs Limited
-
Hewlett Packard Enterprise Development LP
-
Araxxe SAS
-
Cartesian Limited
-
Adapt IT Holdings Limited
- *Disclaimer: Major Players sorted in no particular order
Revenue Assurance Market Companies Covered in this Report
- Amdocs Limited
- Hewlett Packard Enterprise Development LP
- Araxxe SAS
- Cartesian Limited
- Adapt IT Holdings Limited
- eClerx Services Limited
- Subex Limited
- TransUnion LLC
- Tata Consultancy Services Limited
- Profit Insight LLC
- Mobileum Inc.
- TEOCO Corporation
- Nokia Corporation
- Telefonaktiebolaget LM Ericsson
- Oracle Corporation
- CSG Systems International Inc.
- Netcracker Technology Corporation
- Optiva Inc.
- Cerillion PLC
- WeDo Technologies B.V.
- Xintec Limited
- Sagacity Solutions Limited
- LATRO Services Inc.
- Tech Mahindra Limited
Market Opportunities and Future Outlook
A key whitespace is assurance that moves beyond traditional telecom billing into multi-ecosystem settlements and compliance-driven auditing, where transaction integrity spans partner platforms, CPaaS messaging, roaming, and adjacent fintech flows. GSMA PathFinder data provides a practical anchor for number and portability validation in international messaging and A2P charging, which supports more defensible origin-based rating and dispute reduction. Interconnect assurance also remains an active opportunity as operators automate reconciliation across switch records, mediation outputs, and GSMA-compliant TAP, RAP, and NRTRDE files to reduce settlement risk and shrink manual workload.
Regulatory and audit formalization is further increasing scope for standardized, repeatable controls that can be delivered as templates and managed services. TRAI released the Telecommunication (Broadcasting and Cable) Services Digital Addressable Systems Audit Manual, 2026 in March 2026, effective April 1, 2026, reinforcing the need for structured audit evidence and controls that can be operationalized through assurance tooling. At the same time, enterprises adopting usage-based and subscription models are pulling revenue assurance closer to finance systems for margin and cost leakage visibility, which favors platforms that integrate contract logic, entitlement validation, and real-time anomaly detection into a unified workflow rather than periodic, sample-based checks.
Recent Industry Developments in Revenue Assurance Market
- June 2026: Araxxe published results from its Worldwide Billing Errors Observatory, covering 14.8 million test events across 129 countries and flagging 3,088 significant billing errors. The dataset reinforces the persistence of rating and billing defects across international footprints, supporting demand for continuous testing and automated leakage detection in complex tariff and partner scenarios.
- May 2026: Amdocs reported its fiscal 2026 second-quarter results, reflecting continued revenue scale in communications software and services. The update signaled ongoing investment capacity in cloud-native BSS and analytics programs that often embed revenue assurance functions as part of convergent charging and digital monetization stacks.
- October 2024: Ericsson released Charging System 24.1, adding policy controls that adjust 5G slice pricing in real time according to congestion and quality targets. Real-time policy-driven charging increases the need for automated reconciliation and anomaly detection because pricing and entitlement decisions move from batch rules to dynamic, event-driven enforcement.
Revenue Assurance Market Report Scope and Research Methodology
Market Definition and Coverage
The revenue assurance market is defined as the spending on software and related services that help organizations find, prevent, and recover revenue leakage by checking transaction records, usage, billing, and collections for errors or missed charges.
Scope exclusions: This sizing excludes in-house teams effort that is not paid to an external vendor, and it also excludes general fraud platforms that are not positioned or used for revenue assurance work.
Segments Covered in This Report
- By Component
- Software
- Services
- By Deployment Mode
- Cloud
- On-premises
- By End-Use Industry
- Telecom
- Utilities
- BFSI
- Hospitality
- Government
- Healthcare
- Retail
- Other End-Users
- By Revenue Leakage Type
- Revenue Leakage
- Cost Leakage
- Margin Leakage
- By Organization Size
- Large Enterprises
- Small and Medium-sized Enterprises
- By Geography
- North America
- United States
- Canada
- Mexico
- South America
- Brazil
- Argentina
- Rest of South America
- Europe
- Germany
- United Kingdom
- France
- Italy
- Spain
- Rest of Europe
- Asia-Pacific
- China
- Japan
- India
- South Korea
- Australia
- Rest of Asia-Pacific
- Middle East and Africa
- Middle East
- Saudi Arabia
- United Arab Emirates
- Turkey
- Rest of Middle East
- Africa
- South Africa
- Nigeria
- Egypt
- Rest of Africa
- Middle East
- North America
Data Sources, Market Sizing, and Validation
Desk Research
Desk research was used to build the initial demand picture and to set realistic bounds for adoption, pricing, and regulatory constraints. We relied on public sources such as the International Telecommunication Union (ITU) indicators, OECD telecom statistics, World Bank macro series, national telecom regulator publications, and public procurement portals for government digital and audit related tenders.
To convert these signals into model inputs, we combined operator level references from annual reports, investor presentations, and audited financial statements, along with product documentation and reputable press coverage about assurance programs. Where coverage needed to be broadened across regions and smaller suppliers, a paid subscription for company financials and news, and another for patent databases, were used to map vendor activity and product direction. The desk sources listed here are illustrative and not exhaustive, and many additional public references were consulted for data collection, validation, and clarification.
Primary Interviews and Surveys
Primary work focused on validating what buyers actually include under revenue assurance, how budgets split between software and services, and what drives renewal and expansion in telecom and adjacent verticals. We spoke with a mix of solution providers, system integrators, and end users across APAC, EMEA, and the Americas, and then used follow-up questions to close gaps around pricing, deployment choice, and typical project timelines.
Distribution of primary research fieldwork respondents
| Company type | Respondent position | Region |
|---|---|---|
| Top tier: 33% | CXOs: 12% | APAC: 41% |
| Mid tier: 47% | Functional/Unit leaders: 30% | EMEA: 33% |
| Smaller Players: 20% | Managers: 58% | Americas: 26% |
Market-Sizing & Forecasting
Market sizing starts with a top-down build where telecom and enterprise digital operations spend is reconstructed by region, and then filtered using revenue leakage exposure, assurance adoption rates, and typical budget share allocated to assurance tools and services. Once the addressable pool is formed, pricing and deployment mix are applied so the output remains tied to how revenue assurance is purchased in practice.
To keep the totals realistic, the model is corroborated with selective bottom-up approximations such as sampled vendor revenue disclosures, channel checks with integrators, and an ASP times volume cross-check based on typical license or subscription ranges and the number of active operator and enterprise accounts. The key inputs used include telecom subscriber base trends, growth in digital payments and online channels, cloud versus on-premises preference shifts, regulatory focus on billing transparency and auditability, and the observed split between implementation services and recurring software spend.
For forecasting, scenario analysis is used so base, conservative, and faster adoption paths can be tested against the same drivers. The final forecast path is aligned to primary feedback on expected automation uptake, renewal cycles, and the pace at which assurance functions expand from telecom into utilities, BFSI, and government.
Data Validation & Update Cycle
Validation is done by checking the model against independent signals like telecom capex and opex trends, operator margin pressure, and disclosed spending on assurance and audit programs where it is visible. When a region or segment shows an unusual jump, assumptions are rechecked, and follow-up outreach is triggered to confirm whether a one-time program, regulation change, or pricing shift is driving the variance.
Before sign-off, the numbers are reviewed in multiple steps across analysts so inputs, conversions, and growth logic are consistent. Reports are refreshed annually, and interim updates are made when major events materially change demand, such as policy changes, large scale cloud migrations, or notable buyer budgeting shifts. Right before delivery, we run a final pass to ensure the latest public data and interview feedback are reflected.
Mordor Intelligence's Revenue Assurance Market Size Compared Against Other Published Estimates
Published market sizes for revenue assurance can differ widely, even when the topic name looks the same, because the counted scope and the revenue recognition rules are often not aligned. Differences also show up when one publisher anchors the model on telecom only, while another extends the same label to broader billing, fraud, and audit tool spending.
The biggest gap drivers in this market are what gets counted as revenue assurance (pure leakage detection and correction versus wider fraud management), whether services like consulting and managed operations are included, and how cloud subscription revenue is annualized. Currency timing and refresh cadence matter too, since multi-year contracts and regional pricing can move the totals when exchange rates and renewal assumptions are updated.
Benchmark comparison
| Source | Market Size | Gaps in Research Methodology |
|---|---|---|
| Mordor Intelligence | USD 2.25 B (2026) | |
| Industry Publisher A | USD 5.45 B (2025) | Uses a broader definition that bundles adjacent billing and fraud related software and a wide set of services, and it also reports vendor revenues booked in-year, which can inflate totals versus a narrower assurance-only spend view. |
| Industry Publisher B | USD 5.59 B (2024) | Anchors on earlier base-year values and includes consulting as a distinct solution type with wide end-user coverage, which can lift the total when revenue assurance is treated as a broad governance and audit spend item. |
The spread in the table is mainly explained by how tightly the category is drawn around leakage focused assurance work and how services and subscriptions are annualized, and these choices keep the estimate traceable to buyer budgets and leakage indicators in the approach used by Mordor Intelligence.
Key Questions Answered in the Report
How large is the revenue assurance market in 2026?
The revenue assurance market size is USD 2.25 billion in 2026 and is forecast to reach USD 3.48 billion by 2031.
Which segment grows fastest within revenue assurance solutions?
Services expand the quickest, advancing at an 10.62% CAGR as firms outsource integration and analytics workloads.
Why are utilities adopting revenue assurance tools?
Smart-meter rollouts generate high-frequency readings that overwhelm manual billing checks, driving utilities to automate reconciliation.
What role does AI play in modern assurance deployments?
AI models detect anomalies in real time, lowering fraud detection latency from days to seconds and reducing leakage mid-transaction.
Which region offers the highest growth opportunity?
Asia Pacific leads with a 11.98% CAGR, fueled by 5G standalone rollouts and complex network-slice billing requirements.