Retinoblastoma Treatment Market Size and Share
Market Overview
| Study Period | 2019 - 2030 |
|---|---|
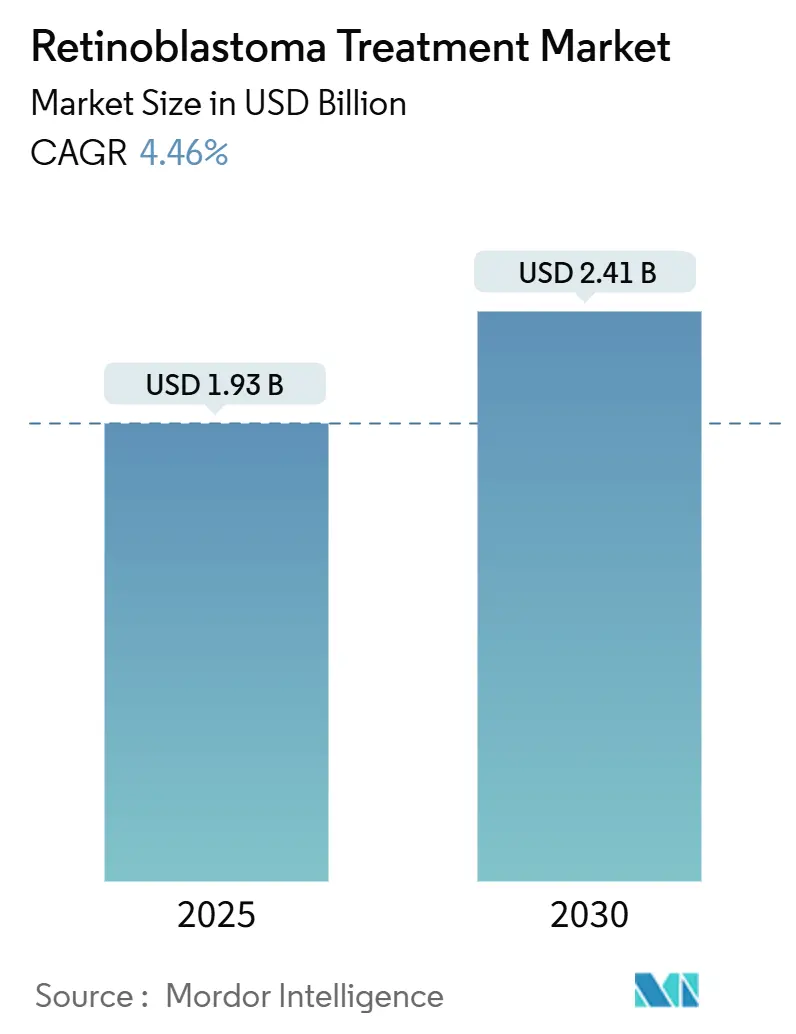
| Market Size (2025) | USD 1.93 Billion |
| Market Size (2030) | USD 2.41 Billion |
| Growth Rate (2025 - 2030) | 4.46% CAGR |
| Fastest Growing Market | Asia-Pacific |
| Largest Market | North America |
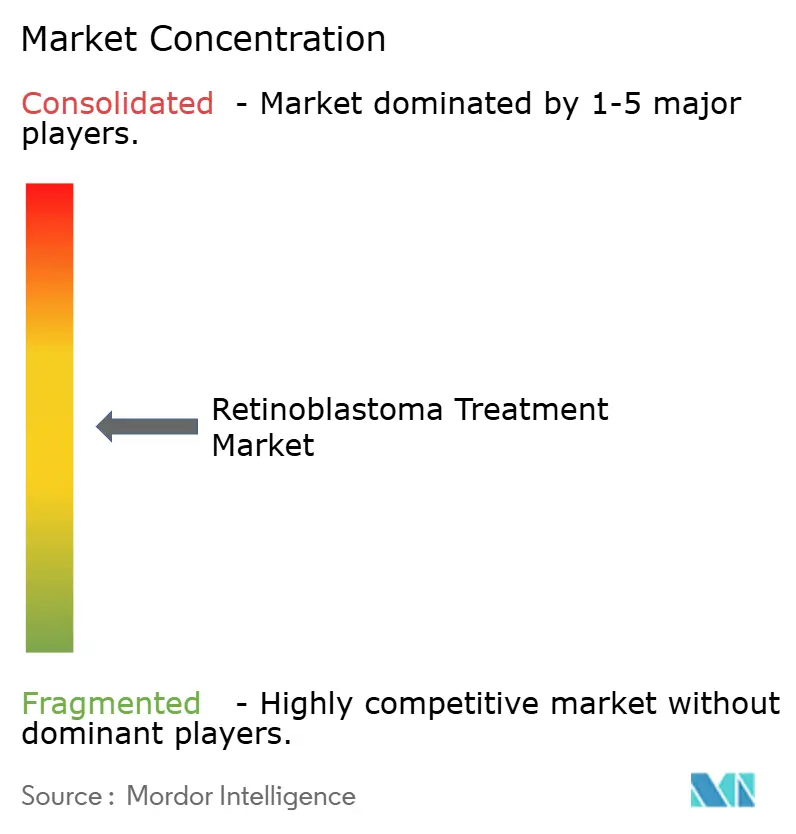
| Market Concentration | Medium |
Major Players*Disclaimer: Major Players sorted in no particular order Image © Mordor Intelligence. Reuse requires attribution under CC BY 4.0. |
|
Retinoblastoma Treatment Market Analysis by Mordor Intelligence
The Retinoblastoma Treatment Market size is estimated at USD 1.93 billion in 2025, and is expected to reach USD 2.41 billion by 2030, at a CAGR of 4.46% during the forecast period (2025-2030).
Shifts toward precision chemotherapeutic delivery, newborn RB1 screening, and streamlined orphan-drug reimbursement sustain momentum even as wide survival gaps persist between high- and low-income regions. Intra-arterial chemotherapy now rivals systemic regimens after achieving 97% technical success, prompting device makers to scale temperature-stable formulations for export to emerging economies. Earlier genetic testing lifts hereditary case detection and feeds long-term surveillance demand, while policy clarity in the United States and Europe stabilizes pricing. Asia-Pacific posts the strongest growth as China and India expand pediatric oncology capacity and awareness campaigns trigger faster referrals.
Key Report Takeaways
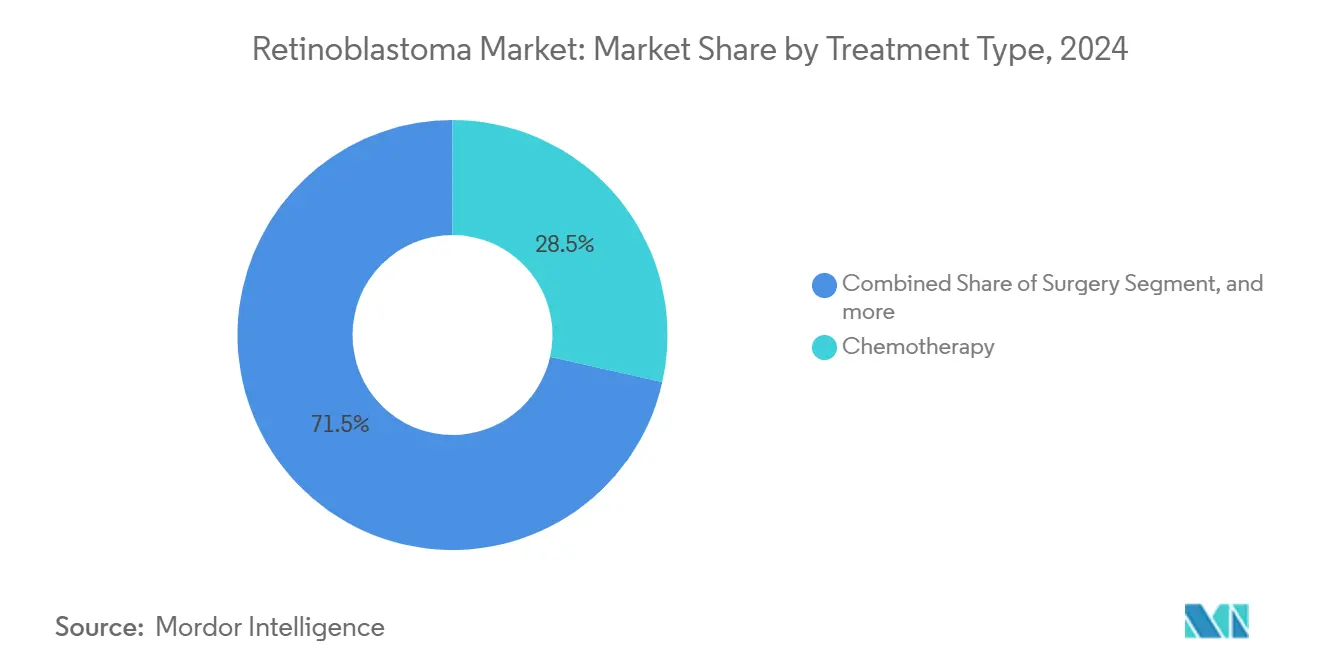
- By treatment type, chemotherapy led with 28.46% of retinoblastoma market share in 2024; targeted and gene-based therapies are forecast to grow at an 8.33% CAGR to 2030.
- By type of retinoblastoma, non-hereditary disease held 59.82% share of the retinoblastoma market size in 2024; hereditary cases record the fastest 6.97% CAGR through 2030.
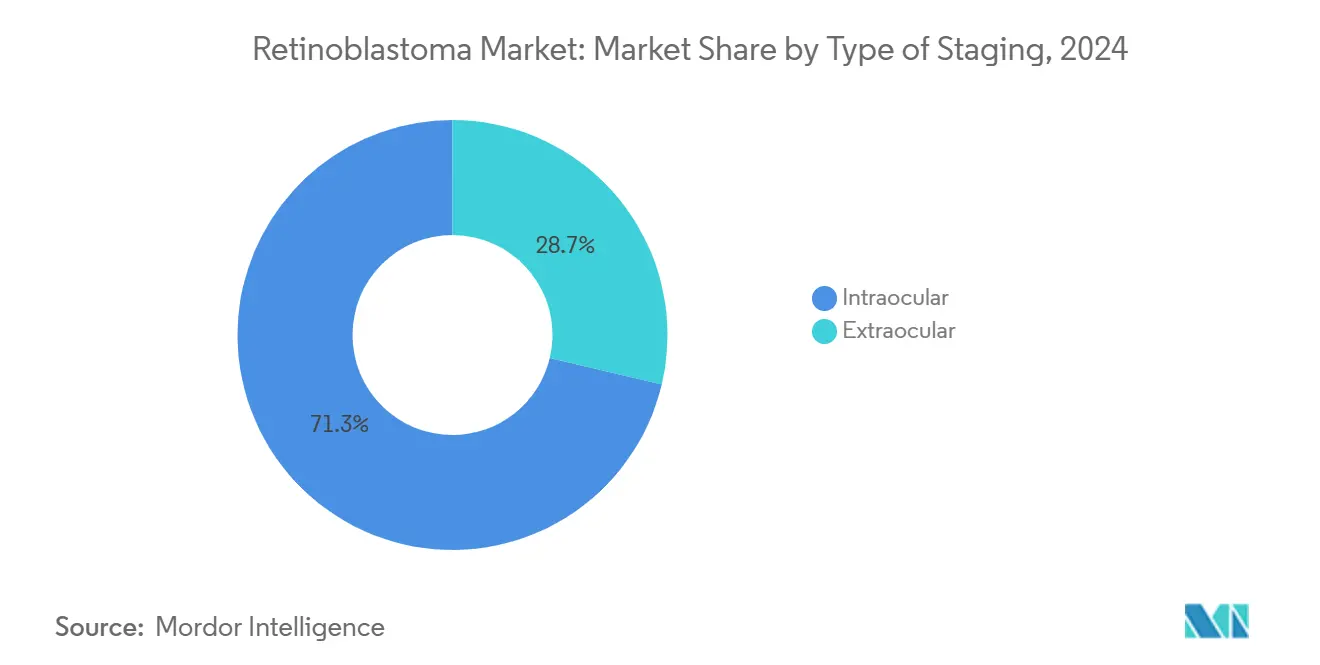
- By type of staging, intraocular disease accounted for 71.27% share of the retinoblastoma market size in 2024 and is advancing at a 7.82% CAGR through 2030.
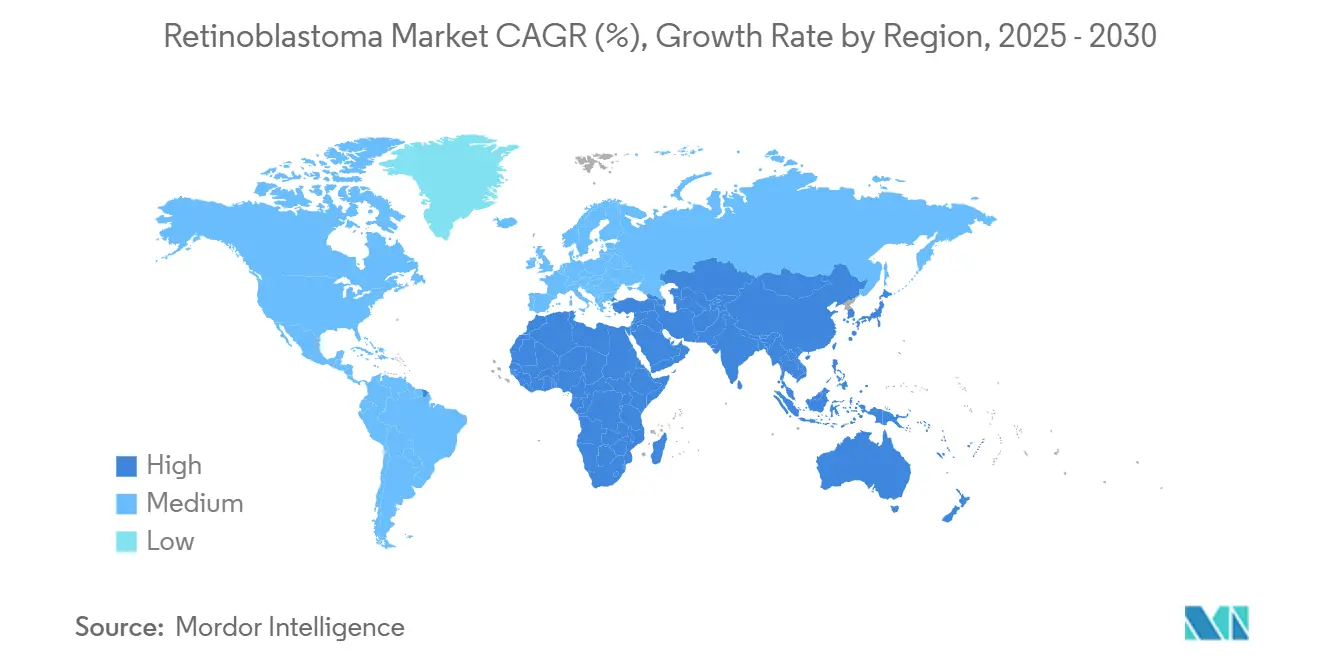
- By geography, North America commanded 37.48% of retinoblastoma market share in 2024, while Asia-Pacific is set to expand at the highest 9.23% CAGR to 2030.
Global Retinoblastoma Treatment Market Trends and Insights
Drivers Impact Analysis
| Driver | (~) % Impact on CAGR Forecast | Geographic Relevance | Impact Timeline |
|---|---|---|---|
| Rising incidence & earlier genetic diagnosis | +1.2% | Global; greatest in Asia-Pacific & MEA | Medium term (2-4 years) |
| Increasing success of ophthalmic artery chemosurgery | +0.8% | North America & EU; moving into Asia-Pacific | Short term (≤ 2 years) |
| Growing public–private awareness campaigns | +0.6% | Asia-Pacific core; spill-over to MEA | Long term (≥ 4 years) |
| Rare-disease reimbursement & orphan-drug incentives | +0.9% | North America & EU | Medium term (2-4 years) |
| AI-enabled smartphone fundus screening in LMICs | +0.4% | Asia-Pacific, MEA, South America | Long term (≥ 4 years) |
| Global philanthropic cross-subsidy drug programs | +0.3% | MEA & South America | Medium term (2-4 years) |
| Source: Mordor Intelligence | |||
Rising Incidence & Earlier Genetic Diagnosis
Enhanced genetic screening protocols drive market expansion as healthcare systems identify retinoblastoma cases earlier in disease progression. Newborn RB1 screening shortened median diagnosis age from 30.5 months to under 12 months in developed systems, lifting eye-preservation above 80% and enlarging the hereditary patient pool.[1]Dimaras, “Genetic Testing Reduces Age at Diagnosis,” BMC Pediatrics, bmcpediatrics.biomedcentral.com Bilateral presentations now comprise 46.7% of referrals at specialty centers, expanding the retinoblastoma market for long-term imaging and counseling services. This diagnostic acceleration translates directly into improved treatment outcomes, with eye preservation rates exceeding 80% when intervention occurs before extraocular spread.
Increasing Success of Ophthalmic Artery Chemosurgery
Across 658 procedures, intra-arterial chemotherapy achieved 97% catheter success and 78.6% eye salvage with complications below 1.1%.[2]Gobin, “Ophthalmic Artery Chemosurgery Outcomes,” Retinal Cases and Brief Reports, journals.lww.com Alternative carotid routes widen eligibility when ophthalmic access is difficult, and global training programs accelerate adoption, adding depth to the retinoblastoma market for catheter systems. Alternative delivery routes through external carotid arteries provide equivalent efficacy when primary ophthalmic artery access proves challenging, ensuring treatment accessibility across diverse anatomical presentations. The technique's success has catalyzed specialized training programs globally, with catheterization success rates improving from 80% to 89.2% over recent years.
Growing Public–Private Awareness Campaigns
Twenty-three Asia-Pacific and Middle-East nations now run community screening networks that cut diagnostic delay and funnel more intraocular cases into treatment. Yet only 39% of Afghan children referred to Pakistan reached care, underscoring logistical barriers despite rising program scale. Educational initiatives targeting parents and pediatricians have improved early symptom recognition, though cultural barriers and healthcare system capacity constraints continue to limit program effectiveness in certain regions.
Rare-Disease Reimbursement & Orphan-Drug Incentives
Since 2013, regulators granted 569 rare pediatric disease designations, 18% oncologic, stimulating pipelines via priority-review vouchers.[3]de Vrueh, “Rare-Disease Designations Trend,” Orphanet Journal of Rare Diseases, ojrd.biomedcentral.com Aurion’s CED cell therapy secured breakthrough and RMAT status in 2024, exemplifying shorter FDA paths. Europe’s slower price negotiations encourage outcome-based contracts as firms seek steady retinoblastoma market access.
Restraints Impact Analysis
| Restraint | (~) % Impact on CAGR Forecast | Geographic Relevance | Impact Timeline |
|---|---|---|---|
| High cost of multimodal therapy | -1.1% | Global; most acute in LMICs | Medium term (2-4 years) |
| Post-treatment vision-loss risk deterring caregivers | -0.7% | Worldwide; culturally variable | Long term (≥ 4 years) |
| Shortage of pediatric ocular-oncology specialists | -0.9% | Global; rural & developing gaps | Long term (≥ 4 years) |
| Cold-chain gaps for intra-arterial chemo devices | -0.5% | Asia-Pacific, MEA, South America | Short term (≤ 2 years) |
| Source: Mordor Intelligence | |||
High Cost of Multimodal Therapy
Combined protocol costs exceed USD 100,000 per patient and sit outside public coverage in many LMICs. Indonesia still lacks national reimbursement for intra-arterial therapy despite strong clinical data.Gene therapy financing presents additional complexity, with high upfront costs necessitating innovative payment models including risk-sharing arrangements and outcome-based contracts to ensure patient access while maintaining healthcare system sustainability. The economic burden extends beyond direct treatment costs to include specialized facility requirements, trained personnel, and long-term follow-up care, particularly challenging for healthcare systems with limited pediatric oncology infrastructure.
Post-Treatment Vision-Loss Risk Deterring Caregivers
Carboplatin monitoring shows 49% of cycles need dose-adjustment to stay within exposure targets, highlighting toxicity concerns that influence parental decisions. Cultural factors influence treatment acceptance, particularly in regions where visual impairment carries significant social stigma or economic implications for family units. The development of neuroprotective therapies and enhanced surgical techniques aims to address these concerns, though long-term visual outcomes remain variable and difficult to predict at treatment initiation.
Segment Analysis
By Treatment Type: Targeted Therapies Drive Innovation
Chemotherapy retains primacy, holding 28.46% of total spending in the retinoblastoma market in 2024, thanks to entrenched protocols and insurer familiarity. Targeted and gene-based options grow at 8.33% CAGR, fueled by p53-MDMX and HDAC inhibitors that deliver higher intraocular concentrations when given subconjunctivally. The retinoblastoma market size for targeted modalities is projected to rise steadily as safety profiles improve, allowing therapy in infants. Radiation segments contract as secondary-malignancy risk deters use, especially for hereditary patients.
Intra-arterial chemotherapy dominates innovation narratives. Eye salvage reaches 78.6% in complex eyes, and overall survival remains 100% in specialized centers, cementing its role as a frontline option. Demand for micro-catheters and chilled melphalan injectables enlarges the global retinoblastoma market footprint despite persistent cold-chain gaps in emerging countries.
Note: Segment shares of all individual segments available upon report purchase
By Type of Retinoblastoma: Hereditary Cases Gain Momentum
Non-hereditary disease retained the largest slice at 59.82% of overall spending in 2024, usually presenting as unilateral tumors with lower long-term surveillance needs. Hereditary cases, however, grow at 6.97% CAGR as universal RB1 testing identifies presymptomatic infants, expanding markets for MRI follow-up and genetic counseling. Bilateral tumors emerge in nearly 90% of hereditary patients, necessitating complex multimodal plans and lifetime monitoring for pinealoblastoma.
Genetic education programs improve family planning and drive uptake of early-intervention protocols, anchoring the hereditary segment as a dynamic contributor to overall retinoblastoma market expansion through 2030.
By Type of Staging: Intraocular Dominance Reflects Early Detection
Intraocular cases control 71.27% of diagnosed volume and grow at 7.82% CAGR as AI-assisted fundus screening and primary-care education shorten referral paths. Eye salvage in Group C and D tumors tops 80% when intra-arterial therapy starts early, cutting enucleation rates and reinforcing conservative treatment demand.
Extraocular disease still represents a cost-heavy minority that requires high-dose chemotherapy, radiation, and occasionally exenteration, placing financial strain on health budgets. Ongoing awareness campaigns aim to shift the stage mix further toward intraocular disease, a change that enlarges the future retinoblastoma market for focal and catheter-based modalities.
Note: Segment shares of all individual segments available upon report purchase
Geography Analysis
North America held 37.48% of the retinoblastoma market in 2024, supported by broad insurance coverage for orphan drugs and specialized ocular-oncology units. Eye-preservation exceeds 85%, yet only 1,646 pediatric eye specialists cover a population of 76 million children, leaving rural gaps that tele-oncology projects attempt to bridge.
Europe mirrors survival outcomes, but reimbursement reviews often span four years, slowing the diffusion of targeted agents. Asia-Pacific is the fastest-growing region at 9.23% CAGR; China and India now host more than 50 dedicated centers combined, though catheter labs and cold-chain infrastructure lag outside tier-one cities. India’s roughly 1,500 new cases yearly highlight volume opportunity, but survival ranges from 75.7% to 92% depending on socioeconomic status. Government grants subsidize AI-based screening pilots designed to cut median diagnosis delay from 7.4 months to under 4 months by 2030.
The Middle East, Africa, and Latin America progress steadily yet still record higher extraocular incidence. Philanthropic referrals to regional hubs in Jordan, Pakistan, and South Africa treat several hundred children annually, but visa and cost barriers curb the scale. Portable angiography units and outcome-linked drug-donation schemes are gaining traction as companies seek to widen the retinoblastoma market footprint in underserved territories.
Competitive Landscape
The retinoblastoma treatment market is moderately competitive in nature due to the presence of companies operating globally as well as regionally. The retinoblastoma market exhibits moderate concentration: global pharmaceutical leaders distribute systemic chemotherapies while niche biotechs pursue gene therapies, precision inhibitors, and drug-device combinations. Three notable competitive themes stand out.
First, device-drug integration is decisive. Companies supplying micro-catheters, temperature-controlled infusion pumps, and chilled melphalan maintain bargaining power because centers often bundle equipment procurement with drug purchasing. These suppliers expand service contracts that include onsite training, boosting client retention in the retinoblastoma market.
Second, data analytics differentiates entrants. AI-powered diagnostic platforms now partner with hospitals to triage fundus images from primary-care settings, generating referral leads that feed treatment centers. Firms providing such platforms secure longitudinal datasets valuable for real-world evidence submissions, enhancing reimbursement arguments.
Third, consolidation remains active. Cencora paid USD 4.6 billion for Retina Consultants of America in November 2024, adding nearly 300 retinal specialists across 23 states and strengthening integrated care capabilities. Merck followed by acquiring EyeBio for up to USD 3 billion, spotlighting the strategic importance of retinal pipelines. These moves intensify competition for specialist talent and clinical-trial sites, shaping future retinoblastoma market entry barriers.
Retinoblastoma Treatment Industry Leaders
-
Baxter International, Inc.
-
Pfizer, Inc.
-
Johnson & Johnson
-
Novartis AG
-
GlaxoSmithKline plc
- *Disclaimer: Major Players sorted in no particular order
Recent Industry Developments
- November 2024: Cencora announced acquisition of Retina Consultants of America for USD 4.6 billion, expanding its specialty services network to include nearly 300 retina specialists across 23 states. The transaction strengthens Cencora's position in retinal care delivery and enhances its clinical research capabilities with 40 trial sites and 400 research employees.
- July 2024: European Commission approved Roche's Vabysmo (faricimab) for treating visual impairment due to retinal vein occlusion, marking the first bispecific antibody approval for eye conditions in Europe. The approval expands treatment options for retinal diseases and demonstrates extended dosing interval capabilities.
- June 2024: FDA granted Breakthrough Therapy Designation and RMAT status to Aurion's CED cell therapy for retinoblastoma treatment, expediting development and review processes for this regenerative medicine approach. The designation recognizes significant unmet medical need and therapeutic potential.
- May 2024: Merck completed acquisition of EyeBio for up to USD 3 billion, gaining access to Restoret drug candidate for retinal diseases including diabetic macular edema. The deal includes USD 1.3 billion upfront payment and USD 1.7 billion in milestone payments.
Research Methodology Framework and Report Scope
Market Definitions and Key Coverage
Our study defines the retinoblastoma treatment market as the yearly value of drugs, single-use consumables, and hospital or outpatient charges tied to first-line and salvage care, systemic, intra-arterial, or intravitreal chemotherapy, external-beam or plaque brachy-radiation, laser photocoagulation, cryotherapy, enucleation, and approved gene or stem-cell options administered to children (≤5 years) with confirmed intra- or extra-ocular retinoblastoma.
Scope Exclusion: revenues from routine ocular imaging and long-term genetic counseling follow-ups are omitted.
Segmentation Overview
- By Treatment Type
- Surgery
- Radiation Therapy
- External Beam
- Brachytherapy
- Laser Therapy
- Cryotherapy
- Chemotherapy
- Systemic IV
- Intra-arterial
- Targeted & Gene-based Therapy
- Bone-Marrow/Stem-Cell Transplant
- By Type of Retinoblastoma
- Non Hereditary Retinoblastoma
- Hereditary Retinoblastoma
- By Type of Staging
- Intraocular
- Extraocular
- By Geography
- North America
- United States
- Canada
- Mexico
- Europe
- Germany
- United Kingdom
- France
- Italy
- Spain
- Rest of Europe
- Asia-Pacific
- China
- Japan
- India
- Australia
- South Korea
- Rest of Asia-Pacific
- Middle East & Africa
- GCC
- South Africa
- Rest of Middle East & Africa
- South America
- Brazil
- Argentina
- Rest of South America
- North America
Detailed Research Methodology and Data Validation
Desk Research
We first mapped the patient universe through tier-1 public sources such as the World Health Organization rare-cancer registry, the U.S. SEER database, Eurocare survival studies, and Orphanet incidence sheets, which reveal birth-cohort prevalence gradients. Cost inputs were benchmarked using open hospital tariff lists, academic papers in Ophthalmology and Pediatric Blood & Cancer, and statutory reimbursement schedules published by CMS and Germany's G-DRG. Company financial snapshots from D&B Hoovers and news scans on Dow Jones Factiva helped spot pipeline launches and price resets. Additional context came from global customs codes for carboplatin and topotecan shipments and from pediatric oncology association white papers. This list is illustrative, not exhaustive; many other public records informed data collection and cross-checks.
Primary Research
Mordor analysts interviewed pediatric ocular oncologists, hospital pharmacists, and reimbursement managers across North America, Europe, India, and Brazil to validate treatment mix shifts, typical drug episode costs, and uptake of ophthalmic artery chemosurgery. Surveys with rare-disease advocacy groups provided insight into screening outreach and unmet need pockets, filling gaps left by secondary data.
Market-Sizing & Forecasting
A prevalence-to-treated-cohort top-down model converts live-birth numbers into candidate pools using region-specific incidence (≈1:17,000 births) and diagnosis rates, which are then adjusted for mortality and treatment eligibility filters. Results are corroborated with selective bottom-up roll-ups of sampled drug ASP × course volumes and facility tariffs to fine-tune totals. Key variables include neonatal screening coverage, average cycles per patient, share of ocular artery infusion, currency shifts, and orphan drug reimbursement ceilings. Forecasts rely on multivariate regression that links spend to birth trends, macro GDP per capita, and expected approval timelines for targeted or gene therapies as confirmed in expert calls. Data gaps in emerging countries are bridged using proxy ratios from demographically comparable neighbors before sensitivity tests.
Data Validation & Update Cycle
Outputs pass variance screens against historical SEER survival gains, drug shipment tonnage, and published orphan drug sales. Senior analysts review anomalies and re-contact sources when deviations exceed preset bands. Reports refresh yearly, with interim updates triggered by major approvals or safety withdrawals; a final content sweep occurs just before client delivery.
Why Mordor's Retinoblastoma Treatment Baseline Commands Clinician Confidence
Published estimates often diverge because firms choose different revenue buckets, patient age limits, and refresh cadences.
Key gap drivers include: some studies bundle lifelong imaging or broader ocular cancers, others use conservative ASP progressions, and a few apply blanket pediatric oncology growth rates without retinoblastoma specific incidence checks. Mordor fixes scope firmly on active treatment spend, applies real-world tariff data, and updates every 12 months, thereby giving decision makers a stable yet current anchor.
Benchmark comparison
| Market Size | Anonymized source | Primary gap driver |
|---|---|---|
| USD 1.93 B (2025) | Mordor Intelligence | - |
| USD 1.60 B (2024) | Global Consultancy A | Counts hospital procedure fees only; excludes emerging gene therapies |
| USD 2.95 B (2024) | Industry Journal B | Bundles follow-up imaging and other ocular cancers, inflating base |
| USD 2.42 B (2022) | Research House C | Uses older cost curves and no currency normalization |
In sum, while other publishers offer useful viewpoints, Mordor's disciplined scope selection, variable tracking, and annual refresh provide a transparent, reproducible baseline that regulators, clinicians, and investors can trust.
Key Questions Answered in the Report
What is the current size of the retinoblastoma market?
The retinoblastoma market is valued at USD 1.93 billion in 2025 and is forecast to reach USD 2.41 billion by 2030.
Which treatment segment is growing the fastest?
Targeted and gene-based therapies are expanding at an 8.33% CAGR to 2030 as precision inhibitors and gene therapies move into clinical practice.
Why is Asia-Pacific the fastest-growing region?
Asia-Pacific posts a 9.23% CAGR due to expanding pediatric oncology capacity, government-funded awareness drives, and wider adoption of intra-arterial chemotherapy.
How successful is intra-arterial chemotherapy?
Across 658 documented procedures, intra-arterial therapy achieved 97% catheter success and salvaged 78.6% of eyes previously slated for removal, with complications below 1.1%.
What are the main barriers to treatment in low-income countries?
High multimodal therapy costs, shortages of pediatric ocular-oncology specialists, and cold-chain gaps for chemotherapy devices limit access.
How do orphan-drug incentives influence the market?
Priority-review vouchers and rare-disease designations accelerate development timelines and encourage investment, enlarging the pipeline of precision retinoblastoma treatments.
Page last updated on:


