
Respiratory Protection Equipment Market Size and Share
Market Overview
| Study Period | 2020 - 2031 |
|---|---|
| Market Size (2026) | USD 13.10 Billion |
| Market Size (2031) | USD 18.10 Billion |
| Growth Rate (2026 - 2031) | 6.67 % |
| Fastest Growing Market | Asia Pacific |
| Largest Market | North America |
| Market Concentration | Medium |
Major Players *Disclaimer: Major Players sorted in no particular order Image © Mordor Intelligence. Reuse requires attribution under CC BY 4.0. | |

Respiratory Protection Equipment Market Analysis by Mordor Intelligence
The Respiratory Protection Equipment Market size was valued at USD 12.42 billion in 2025 and is estimated to grow from USD 13.10 billion in 2026 to reach USD 18.10 billion by 2031, at a CAGR of 6.67% during the forecast period (2026-2031).
Tightening occupational exposure limits across construction, mining, and healthcare continue to shift spending from one-off pandemic spikes toward programmatic procurement. U.S. regulatory streamlining that removes pre-use medical evaluations for common filtering facepiece and loose-fitting powered air-purifying models lowers compliance friction for small employers and sustains baseline volume.[1] Federal surge-capacity programs have locked in recurring orders, with the Strategic National Stockpile holding more than 350 million N95 units by late 2024.[2] Parallel stockpiles in Canada and Australia reinforce this trend and anchor predictable replenishment cycles. At the same time, upstream oil-and-gas projects in sour-gas fields, wildfire smoke emergencies, and large Asian infrastructure builds provide fresh demand channels that keep factory utilization high even as COVID-19 fades.
Key Report Takeaways
- Disposable respirators led with 34.58% revenue in 2025, while powered air-purifying respirators are forecast to expand at a 9.44% CAGR to 2031.
- Particulate-only devices captured 44.63% share of the respiratory protection equipment market size in 2025, yet biological respirators lead growth with an 8.94% CAGR through 2031.
- N-series products dominated 59.72% of 2025 volume, whereas FFP3 units are advancing at a 9.35% CAGR on the back of new European nano-particle rules.
- Fabric disposables held 64.37% of 2025 revenue, yet silicone facepieces will post the fastest 8.24% CAGR as hospitals and semiconductor fabs favor reusable platforms.
- Healthcare and pharmaceuticals commanded 29.68% of 2025 sales, while firefighting and emergency response is forecast to rise at a 9.73% CAGR to 2031.
- Distributors and wholesalers controlled 51.33% of 2025 revenue; online retail shows the quickest 10.88% CAGR as subscription filter programs reach small worksites.
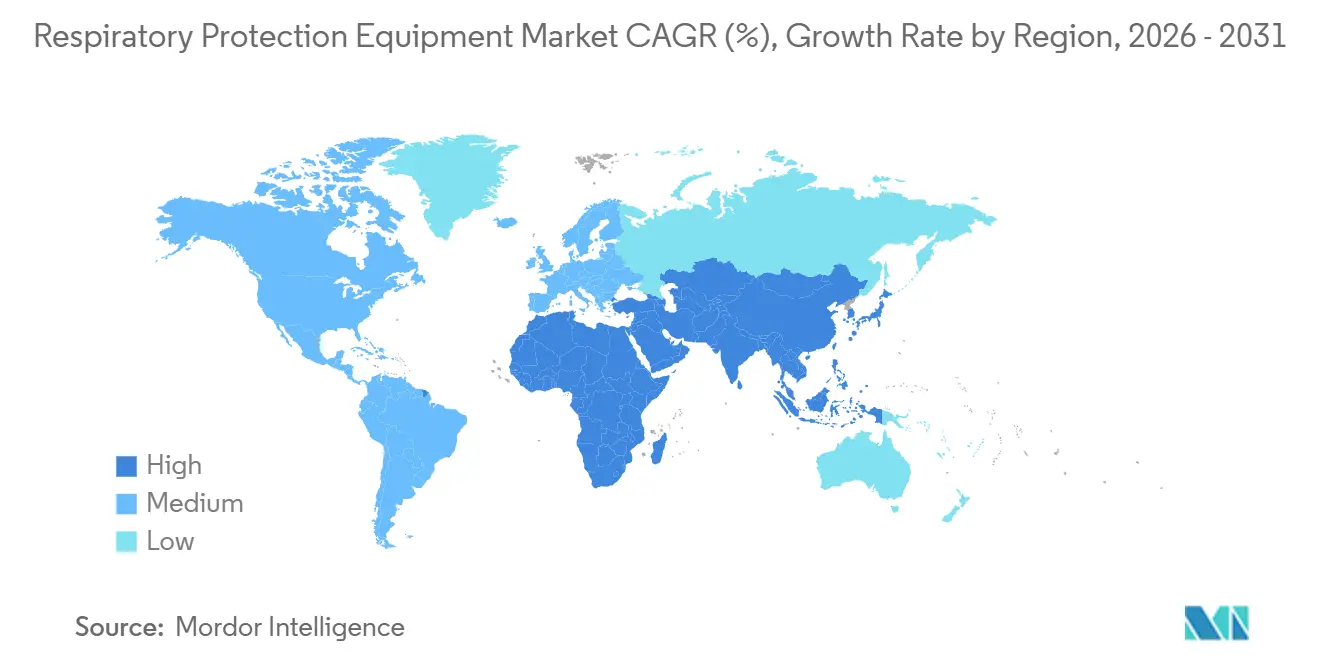
- North America generated 37.52% of 2025 revenue, but the Asia-Pacific region is on track for the highest 8.32% CAGR thanks to new Indian, Chinese, and Japanese safety mandates.
Note: Market size and forecast figures in this report are generated using Mordor Intelligence’s proprietary estimation framework, updated with the latest available data and insights as of 2026.
Market Trends and Insights
Drivers Impact Analysis of Respiratory Protection Equipment Market*
| Driver | (~) % Impact on CAGR Forecast | Geographic Relevance | Impact Timeline |
|---|---|---|---|
| Stringent Workplace Safety Regulations | 1.2% | Global, with North America & EU leading enforcement | Medium term (2-4 years) |
| Rising Incidence of Occupational & Infectious Respiratory Diseases | 1.0% | Global, pronounced in APAC manufacturing hubs and healthcare sectors | Long term (≥ 4 years) |
| Industrial Expansion in High-Particulate Sectors (Construction, Mining) | 1.3% | APAC core (China, India), spill-over to MEA and South America | Medium term (2-4 years) |
| Upstream Oil & Gas Resurgence in Toxic-Gas Fields | 0.8% | North America (Permian, Bakken), Middle East, West Africa | Short term (≤ 2 years) |
| Smart, Sensor-Embedded Respirators Enable Predictive Maintenance | 0.9% | North America & EU early adopters, APAC followers | Long term (≥ 4 years) |
| Government Stockpiling Amid Record Wildfire Smoke Seasons | 0.6% | North America (U.S., Canada), Australia | Short term (≤ 2 years) |
| Source: Mordor Intelligence | |||
Stringent Workplace Safety Regulations
Global regulators have tightened exposure rules, forcing employers to move from voluntary programs to mandatory fit testing and record keeping. The U.S. proposal in July 2025 that drops medical clearance for common masks immediately removes paperwork costs for thousands of contractors. OSHA’s silica rule, in full enforcement since 2024, caps worker exposure at 50 µg/m³ and drives orders for P100 filters in stone cutting and sandblasting. Europe’s EN 149 update added nano-particle efficiency tests in 2024, lifting the technical bar for FFP3 approvals and prompting international brands to redesign portfolios.[3] New ISO standards for self-contained breathing apparatus strengthen thermal and communication benchmarks, which accelerates municipal fleet upgrades. Combined, these moves inject a steady floor of compulsory demand into the respiratory protection equipment market.
Rising Incidence of Occupational and Infectious Respiratory Diseases
Silicosis, COPD, and asthma continue to rank among the top work-related illnesses, while healthcare systems prepare for avian influenza spillovers and mpox clusters. NIOSH now advises hospitals to keep a 90-day cache of reusable elastomeric masks, pushing durable-mask orders beyond crisis periods. A 2024 clinical study covering 12-hour nursing shifts reported that 82% of participants favored elastomerics for multi-day use because of lower total cost despite higher breathing effort. Asia’s construction boom aggravates silica Exposure, and state registries in India and China show rising disease incidence, leading to new mandatory respirator rules. WHO’s 2024 preparedness guidance names respiratory protection a Tier 1 countermeasure, prompting stockpiles equal to 10% of each member state’s health-care workforce. These factors compound to keep the respiratory protection equipment market on a solid upward trajectory.
Industrial Expansion in High-Particulate Sectors (Construction, Mining)
Megaprojects across India’s National Infrastructure Pipeline, Indonesia’s new capital, and China’s Belt and Road add millions of worker-years in dusty environments. India now obliges sites exceeding 10,000 m² to supply certified respirators, converting earlier voluntary habits into enforceable rules. China’s push to 90% automated coal mines paradoxically adds near-term mask demand because retrofit crews face diesel particulate and blast dust. Australia’s lithium boom in underground hard rock raises PAPR penetration where heat stress makes half-masks impractical. South Africa reports an 18% drop in silicosis claims after stricter enforcement and real-time dust monitors. Brazil’s fast-growing agribusiness needs pesticide and biomass protection, yet lacks dense distributor networks, which opens room for online platforms. Together, these project pipelines expand the respiratory protection equipment market well beyond healthcare.
Upstream Oil & Gas Resurgence in Toxic-Gas Fields
Hydrogen-sulfide concentrations in U.S. shale plays often exceed OSHA’s 10 ppm limit during flowback, mandating supplied-air or SCBA solutions. Operators deploy trailer-mounted systems that cover multiple workers without cylinder weight. Saudi Arabia’s Jafurah gas project requires every field worker to carry escape respirators plus monitors, creating bulk orders backed by government budgets. West Africa’s deep-water projects add offshore demand for 15-minute escape units, while North American carbon-capture pilots write new rules for supercritical CO₂ plumes. All of these activities inject specialty-grade volume into the respiratory protection equipment market.
Restraints Impact Analysis of Respiratory Protection Equipment Market*
| Restraint | (~) % Impact on CAGR Forecast | Geographic Relevance | Impact Timeline |
|---|---|---|---|
| High Acquisition & Maintenance Cost of Advanced RPE | -0.7% | Global, acute in price-sensitive APAC and South America markets | Medium term (2-4 years) |
| Low Wearer-Comfort & Compliance Rates | -0.5% | Global, pronounced in high-heat/humidity environments (MEA, South Asia) | Long term (≥ 4 years) |
| Critical Filter-Media Supply Chain Constraints | -0.4% | Global, with bottlenecks in meltblown polymer sourcing | Short term (≤ 2 years) |
| Unclear Nano-Particle Exposure Regulations Delaying Approvals | -0.3% | North America & EU regulatory jurisdictions | Medium term (2-4 years) |
| Source: Mordor Intelligence | |||
High Acquisition and Maintenance Cost of Advanced RPE
Powered air-purifying and supplied-air systems cost USD 800–3,000 per unit plus 20% annual upkeep, which pushes smaller firms toward cheaper disposables. Ansell’s USD 80 million Indian factory will cut elastomeric landed cost by 15%, yet disposable N95s at USD 1–3 each still win on cash outlay. Hospitals face parallel economics: rural facilities avoid elastomerics because they lack centralized decontamination. Fire departments budgeting USD 5,000–8,000 per SCBA struggle to fund annual flow testing and cylinder recertification. Capital intensity therefore caps adoption rates in the respiratory protection equipment market.
Low Wearer Comfort and Compliance Rates
Respirators increase breathing effort, trap heat, and hamper speech. A 2024 study showed 68% of healthcare staff find elastomerics harder to breathe through, and 74% reported more heat discomfort across 12-hour shifts. High humidity in the Middle East and South Asia makes full-shift compliance even harder, triggering mask-hanging behavior that defeats protection. Silicone facepieces cut dermatitis risk but still fog eyewear in 8–12% of users. Until materials like viscoelastic foam seals reach mass market, comfort will restrain the respiratory protection equipment market’s full potential.
*Our forecasts treat driver/restraint impacts as directional, not additive. The impact forecasts reflect baseline growth, mix effects, and variable interactions.
Respiratory Protection Equipment Market Segment Analysis
By Product Type:
PAPR Growth Outpaces Disposable DominanceDisposable masks and particulate respirators still dominate on price and convenience, accounting for 34.58% of 2025 revenue in the respiratory protection equipment market. Powered air-purifying respirators, however, are projected to record the highest 9.44% CAGR as clean-room operators and welders embrace lighter blowers and integrated sensors. Half-mask elastomerics remain the standard for oil-and-gas crews because a USD 40 facepiece plus USD 15 cartridges delivers season-long value. Full-face models capture pesticide and confined-space tasks by adding eye protection. Supplied-air and SCBA solutions hold niche but high-value pockets in paint booths and firefighting.
MSA’s 2024 partnership with optrel blended breath-following blowers into welding helmets, cutting user fatigue by 18%. This integration shows how upstream technology raises compliance and ASPs. Disposable demand, by contrast, stays highly price elastic; a 10% price hike can reduce unit volume by 6–8%. Such sensitivity underscores why premium devices will capture growth even as low-cost disposables hold volume leadership in the respiratory protection equipment market.


By Protection Type:
Biological Respirators Surge on PreparednessParticulate-only gear delivered 44.63% of 2025 worldwide sales, yet biological and infectious-agent models will expand at an 8.94% CAGR to 2031. Hospitals now formalize 90-day caches of elastomeric or P100 cartridges after WHO placed respiratory protection in its top countermeasure tier. Gas-and-vapor cartridges support chemical and wastewater sites but require frequent replacement. Combination filters handle spray-painting and pesticide mixing where simultaneous hazards exist.
A clinical comparison in 2024 showed 82% of healthcare workers preferred elastomerics for multi-day use because of lower total cost over disposable N95s. Certifications remain complex since NIOSH evaluates particulate and gas claims separately, which stretches development timelines. Even so, added biological regulations position high-filtration devices to capture greater respiratory protection equipment market share as preparedness spending stabilizes.
By Mask Rating:
FFP3 Gains as Nano-Particle Concerns MountN-series respirators held 59.72% of global volume in 2025, reflecting NIOSH’s dominance and construction familiarity. FFP3 units are forecast to grow at 9.35% CAGR as Europe enforces tougher nano-particle tests under the updated EN 149. R- and P-series filters serve oily environments, and P100 grades carry 20–30% price premiums yet last longer. FFP1 sits at the low end with only 80% efficiency and is shifting to non-regulated niches.
Pharmaceutical expansions in Ireland and Switzerland now mandate FFP3 or higher, pushing demand. ASTM’s WK73468 standard demands P100-level filtration for first responders, nudging procurement away from legacy mid-tier masks. As nano-particle scrutiny rises, FFP3 penetration will continue to lift the respiratory protection equipment market size for premium grades.

By Facepiece Material:
Silicone Comfort Drives Reusable AdoptionFabric and polypropylene disposables generated 64.37% of 2025 revenue. Silicone facepieces are on pace for an 8.24% CAGR owing to hypoallergenic properties and better seal retention during long shifts. Thermoplastic elastomer provides a middle ground for cost-sensitive buyers who still want comfort. Neoprene lingers in older inventories but suffers ozone and oil degradation.
California’s 2024 law that extends producer responsibility for single-use plastics adds USD 0.10–0.15 per disposable unit. This eco-cost tilts budgets toward reusable silicone platforms, especially in landfill-constrained regions. While certification costs slow material substitution, ongoing R&D into lighter polyurethane foam seals promises to widen the addressable base inside the respiratory protection equipment market.
By End-User Industry:
Firefighting Segment Accelerates on Fleet RenewalsHealthcare accounted for 29.68% of 2025 revenue, anchored by infection control. Firefighting and emergency response is projected to log the fastest 9.73% CAGR through fleet renewal programs backed by federal grants. Oil-and-gas sites remain heavy users of supplied-air gear because hydrogen-sulfide routinely exceeds OSHA limits. Construction demand aligns with silica compliance, while mining upgrades to P100 or PAPR solutions as automation retrofits raise short-term dust exposure.
Manufacturing applications vary by task, from organic vapors in paint shops to welding fumes in metal fabrication. Chemicals and wastewater treatment need chemisorbent cartridges for ammonia or chlorine. Wildfire smoke events add public-distribution channels outside traditional industrial markets, further expanding the respiratory protection equipment market.

By Distribution Channel:
Online Retail Disrupts Traditional WholesalersDistributors and wholesalers still hold 51.33% of 2025 sales, but online retail enjoys a 10.88% CAGR by unbundling price and offering subscription filter deliveries. Amazon Business and Grainger’s portal help small worksites bypass minimum order sizes. Direct sales stay important for large refineries and hospitals that need bespoke configurations and on-site service contracts.
PIP’s acquisition of Honeywell’s PPE brands tightens vertical integration and captures margin across both manufacturing and distribution tiers. Subscription models particularly resonate in pharmaceutical and semiconductor fabs, where automated replenishment averts costly downtime. The shift online therefore adds new buyer segments and raises overall velocity in the respiratory protection equipment market.
Geography Analysis
North America Respiratory Protection Equipment Market
North America generated 37.52% of 2025 revenue as OSHA enforcement of the crystalline-silica rule combined with oil-field activity to drive steady orders. Federal wildfire-smoke stockpiles add a public health layer of demand, while carbon-capture pilots create new toxic-gas scenarios that need specialized gear. Canada’s government investment in community N95 distribution underpins rural uptake, and Mexico’s maquiladora belt sustains disposable volumes despite uneven enforcement.
APAC Respiratory Protection Equipment Market
The Asia-Pacific respiratory protection equipment market outpaces all regions with an 8.32% CAGR to 2031. India now enforces respirator provision on large sites, China’s mine mechanization temporarily raises dust exposure for retrofit workers, and Japan’s aging labor force values lighter ergonomic designs. Australia doubles lithium output between 2020 and 2025, which favors PAPRs in deep, hot mines. South Korea’s semiconductor and biopharma investments prefer FFP3 or P100 filtration to protect clean-room yields.
EMEA and South America Respiratory Protection Equipment Market
Europe maintains mid-single-digit expansion as EN 149 nano-particle updates lift procurement grades and the chemical sector renews full-face inventories. Germany’s chemical giants keep stringent chlor-alkali protection standards. France’s nuclear-maintenance schedules call for supplied-air systems, while the UK’s HSE update in 2024 tightens fit-test record keeping. The Middle East builds demand through gas megaprojects like Jafurah, and South Africa’s mining upgrades sustain orders for high-filtration gear. South American pockets such as Brazilian agribusiness and Argentine lithium see healthy volumes but face distribution bottlenecks that online channels aim to solve.
Regulatory Landscape
Regulation spans occupational safety, product certification, and (in healthcare use cases) medical device compliance. In the United States, OSHA continues to govern employer respiratory protection programs under 29 CFR 1910.134, while NIOSH approval remains the technical gateway for many industrial and healthcare respirators. OSHA proposed amendments in July 2025 that remove the initial medical evaluation requirement for employees using filtering facepiece respirators and loose-fitting PAPRs, while retaining fit testing and training obligations. Separately, the FDA published a compliance policy in the Federal Register in April 2026 regarding certain NIOSH-approved air-purifying respirators used in healthcare settings, using enforcement discretion to reduce redundant premarket burdens while maintaining core quality and recordkeeping expectations.
In Europe, manufacturers navigate EN performance standards alongside the phased implementation of the Medical Device Regulation (MDR 2017/745), with EUDAMED-linked transparency and traceability requirements tightening as the MDR ecosystem matures. The European Commission issued Implementing Decision (EU) 2026/1279 in June 2026, updating harmonized standards and reinforcing the need for continuous standards surveillance for CE-marked protective devices. Across both regions, the practical compliance bar is rising through tighter technical benchmarks, including nanoparticle-related test updates cited in EN 149 revisions, and growing emphasis on traceability and post-market controls.
Value Chain Analysis
The value chain starts with specialty inputs such as meltblown filter media, electrostatic filtration layers, elastomers or silicone for facepieces and seals, valves, and (for PAPRs and supplied-air systems) blowers, batteries, hoses, and electronic components. Component availability and qualification, particularly for filtration media and critical PAPR subassemblies, influence lead times and pricing, pushing several brands toward dual-sourcing and regionalized supply. Product design and certification testing, including NIOSH approvals and (in some applications) FDA-related requirements, sits between component sourcing and scaled manufacturing. This creates a compliance-linked gating step that can constrain new SKU introductions.
Downstream, sales flow through large distributors and wholesalers and direct contracts for industrial sites, fire services, and hospital systems, with online procurement increasingly used by small worksites and supported by subscription replenishment programs for filters and cartridges. Fit testing, training, maintenance, and periodic cartridge replacement drive recurring aftermarket demand that is increasingly bundled into service contracts for PAPRs and SCBA fleets. OSHA's July 2025 proposed change to medical evaluation requirements for filtering facepiece respirators and loose-fitting PAPRs reduces administrative friction at the employer level, reinforcing a procurement shift toward standardized program purchases rather than ad hoc buying.
Competitive Landscape
The key suppliers includes MSA Safety, 3M’s Solventum spin-off, Drägerwerk, and Avon Protection collectively hold share of global revenue. That leaves room for regional champions like Shigematsu in Japan and Sundström in Scandinavia that win with fast domestic certification and close distributor ties. Technology integration marks the new competitive frontier: MSA’s FireGrid-enabled SCBA streams data for predictive maintenance and earned a USD 33 million U.S. Coast Guard contract. Drägerwerk and Sundström embed RFID tags for automated filter tracking, aligning with chemical-plant safety software.
Vertical integration also rises. Ansell’s Indian plant cuts silicone facepiece costs and shields against tariff shifts. Horizontal M&A gains pace as PIP folds Honeywell’s North, Miller, and Morning Pride brands into its network, broadening channel reach. Online newcomers promote subscription cartridges that lower reorder friction, while fit-test-as-a-service startups use smartphone scanning to boost compliance.
As smart sensors become table stakes, laggards that lack connectivity struggle to clear updated ASTM and ISO benchmarks. Fit diversity is another differentiator: Moldex and JSP each offer up to 10 face sizes versus the common three, reducing fit-test failures and winning contracts in markets with rigid enforcement. Moderate concentration and active innovation keep pricing competitive but sustain ample room for specialized differentiation within the respiratory protection equipment market.
Respiratory Protection Equipment Industry Leaders
-
Honeywell International Inc.
-
MSA Safety Incorporated
-
Drägerwerk AG & Co. KGaA
-
Kimberly-Clark Corporation
-
Solventum
- *Disclaimer: Major Players sorted in no particular order

Respiratory Protection Equipment Market Companies Covered in this Report
- Alpha Pro Tech Ltd.
- Avon Protection plc
- Bullard
- Delta Plus Group
- Dragerwerk
- Gentex Corporation
- GVS Group
- Honeywell International
- Intersurgical Ltd.
- JSP Ltd.
- Kimberly-Clark Worldwide
- Lakeland Industries Inc.
- Medline Industries
- Moldex-Metric
- MSA Safety Incorporated
- Optrel AG
- RPB Safety LLC
- Shigematsu Works Co. Ltd.
- Solventum
- Sundström Safety AB
Market Opportunities and Future Outlook
Healthcare and public-sector preparedness continue to create whitespace for reusable and higher-filtration platforms that reduce dependence on disposable surge procurement. A concrete anchor is the Strategic National Stockpile holding more than 350 million N95 units by late 2024, which supports structured replenishment cycles and vendor opportunities around rotation, warehousing, and SKU standardization. In parallel, NIOSH’s Healthcare Personal Protective Technology (PPT) agenda, including work to update PAPR-related test methods and reference ASTM F3407 test methods, provides a clearer pathway for healthcare-specific performance differentiation. The emphasis is most visible in PAPRs and reusable respirators that align with hospital infection-control workflows.
Regulatory streamlining also opens near-term opportunity in compliance services and faster product refresh cycles. NIOSH reported reduced respirator approval processing time from 100 days in 2024 to 65 days by mid-2025, improving time-to-market for updated designs and incremental platform variants. In the United States, the FDA’s April 2026 draft compliance policy for certain NIOSH-approved air-purifying respirators used in medical settings reduces redundant premarket burdens, while OSHA’s ongoing amendment activity around 29 CFR 1910.134 keeps employer programs centered on fit testing and training. These shifts support offerings that bundle fit-test workflows, digital recordkeeping, and connected SCBA or PAPR fleet management, with traction reinforced by adoption of data-enabled firefighter systems and large public-safety contracts highlighted by major suppliers.
Recent Industry Developments in Respiratory Protection Equipment Market
- April 2026: MSA Safety debuted its G1 XR Edition self-contained breathing apparatus (SCBA) at FDIC International, positioned to meet the 2025 edition of the NFPA 1970 standard. The launch strengthens replacement-cycle demand tied to updated firefighter standards and pushes competing SCBA platforms to keep pace on compliance, modularity, and connected features.
- May 2025: Honeywell completed the sale of its Personal Protective Equipment business, including respiratory protection products, to Protective Industrial Products (PIP) for USD 1.325 billion. The divestiture reshaped brand ownership and channel control in respiratory PPE, giving PIP a broader portfolio to cross-sell through its distribution network.
- August 2024: MSA Safety and optrel announced a partnership and introduced new powered air-purifying respirator (PAPR) technology in North America. The move accelerated integration of respiratory protection into welding headgear and workflows, supporting higher adoption in industrial applications where comfort and productivity improvements drive switching from basic disposables.
Respiratory Protection Equipment Market Report Scope and Research Methodology
Market Definition and Coverage
We define the respiratory protection equipment market as the value of products that protect the wearer from inhaling harmful particles, gases, vapors, and biological hazards. In-scope sales are tracked across industrial workplaces, healthcare, and public safety settings.
Scope exclusions: We exclude general infection-control accessories and non-respiratory PPE that do not provide breathing protection as the primary function.
Segments Covered in This Report
- By Product Type
- Disposable Respirators
- Half-Mask Reusable Respirators
- Full-Face Reusable Respirators
- Powered Air-Purifying Respirators (PAPR)
- Supplied-Air Respirators (SAR)
- Self-Contained Breathing Apparatus (SCBA)
- Escape Respirators
- By Protection Type
- Particulate-Only Respirators
- Gas & Vapor Respirators
- Combination (Particulate + Gas/Vapor)
- Biological/Infectious-Agent Respirators
- By Mask Rating
- N-Series (N95, N99, N100)
- R-Series (R95, R99, R100)
- P-Series (P95, P99, P100)
- FFP1
- FFP2
- FFP3
- By Facepiece Material
- Silicone
- Thermoplastic Elastomer (TPE)
- Neoprene / Rubber
- Fabric / Polypropylene (Disposable)
- By End-user Industry
- Oil & Gas
- Healthcare & Pharmaceuticals
- Construction
- Mining
- Firefighting & Emergency Responders
- Manufacturing
- Chemicals
- Others
- By Distribution Channel
- Direct Sales
- Distributors / Wholesalers
- Online Retail
- By Geography
- North America
- United States
- Canada
- Mexico
- Europe
- Germany
- France
- United Kingdom
- Italy
- Spain
- Rest of Europe
- Asia-Pacific
- China
- Japan
- India
- South Korea
- Australia
- Rest of Asia-Pacific
- Middle East & Africa
- GCC
- South Africa
- Rest of Middle East & Africa
- South America
- Brazil
- Argentina
- Rest of South America
- North America
Data Sources, Market Sizing, and Validation
Desk Research
Desk research starts with building the market boundary and demand map using public standards, safety guidance, and trade data that describe where respiratory protection is required and how it is specified. We refer to sources such as OSHA respiratory protection guidance, NIOSH certification lists and testing notes, CDC infection-prevention resources, and EN and ISO standard summaries, which help keep product categories and ratings consistent.
We then layer in supporting signals from sources such as UN Comtrade trade flows for relevant mask and filter categories, government procurement disclosures where available, and company filings and investor presentations to understand end-market exposure and pricing direction. A paid subscription for company financials and news is used mainly to cross-check revenue splits, capacity expansions, and product mix shifts, while keeping the market model anchored to repeatable public indicators. The sources listed above are illustrative, and we also reviewed many other public documents for data collection, validation, and clarification.
Primary Interviews and Surveys
Primary work is used to confirm what is actually shipping and being used, since compliance needs and buying patterns can shift quickly across industries. We speak with manufacturers, distributors, safety managers, procurement teams, and technical specialists who understand certification, replacement cycles, and how pricing differs by rating, facepiece type, and channel across APAC, EMEA, and the Americas.
Distribution of primary research fieldwork respondents
| Company type | Respondent position | Region |
|---|---|---|
| Top tier: 26% | CXOs: 13% | APAC: 44% |
| Mid tier: 60% | Functional/Unit leaders: 35% | EMEA: 30% |
| Smaller Players: 14% | Managers: 52% | Americas: 26% |
Market-Sizing & Forecasting
Sizing is built using a top-down and bottom-up approach, where workplace exposure and compliance-led demand pools are reconstructed first, and then checked using selective supply-side roll ups. In practice, we start from end-use activity indicators that explain respirator consumption, and then convert them into annual unit needs and value using rating-specific adoption and replacement assumptions.
Key inputs used in the model include industrial employment in higher-risk occupations, construction and manufacturing output direction, healthcare usage intensity (as a demand stabilizer), certification mix by mask rating (such as N, R, P series and FFP classes), and channel mix between direct sales, distributors, and online retail. Average selling prices are treated carefully by separating premium supplied-air systems and powered air-purifying units from disposable and reusable facepieces, and then adjusting ASPs for mix shifts rather than applying one flat inflation factor.
For forecasting, scenario analysis is used so demand can be flexed based on enforcement strength, stockpiling behavior, and the pace of industrial activity, and then the final path is aligned with what interviewees see for budgets, lead times, and product substitutions. Where bottom-up visibility is weaker in fragmented channels, gaps are handled by using representative ASP x volume checks and then scaling with independent end-market indicators.
Data Validation & Update Cycle
Outputs are validated by comparing modeled value trends with independent signals such as certification activity, trade direction for relevant product groups, and reported category commentary in public filings. When an outlier appears, assumptions on mix, replacement frequency, or channel margins are revisited, followed by a second pass review before sign-off.
The report is refreshed annually, and interim updates are triggered when material events occur, such as sudden regulatory actions, supply disruptions, or unusual pricing swings. Before delivery, we run a final update pass so the dataset, currency conversions, and recent market moves are reflected consistently in the latest view.
Mordor Intelligence's Respiratory Protection Equipment Market Estimate Compared With Other Published Estimates
Published market numbers for respiratory protection equipment often do not line up, even when the topic label looks the same at first glance. The differences usually come from what product families are counted, how pricing is averaged, and whether the figures are kept current as channel mix and replacement cycles normalize.
A common gap driver is the timing of currency conversion and price refresh, since respirators and filters can swing in price by rating and by channel, which can move the total value even when units are steady. By re-checking ASP bands and product mix during scheduled updates, and then validating against certification and trade signals, the 2025 view from Mordor Intelligence avoids overstating value using older price points that no longer represent current buying patterns.
Benchmark comparison
| Source | Market Size | Gaps in Research Methodology |
|---|---|---|
| Mordor Intelligence | USD 12.42 B (2025) | |
| Industry Research Publisher A | USD 10.50 B (2025) | Uses a 2019 base framework with a 2020-2025 forecast window, and its price averaging can understate premium reusable and supplied-air systems when mix shifts toward higher-spec equipment. |
| Industry Research Publisher B | USD 10.00 B (2020) | Reports an earlier-year value during a different demand regime, and the time mismatch plus currency and pricing timing makes it hard to compare directly to a current-year market view. |
The spread across the values is largely explained by timing and how pricing and product mix are treated, rather than by one single demand assumption. When scope stays focused on respiratory protection equipment and ASP logic is refreshed by system type and rating, the resulting total is easier to trace back to repeatable inputs that can be checked year to year.
Key Questions Answered in the Report
What is the projected value of the respiratory protection equipment market in 2031?
It is forecast to reach USD 18.10 billion by 2031, supported by a 6.67% CAGR from 2026.
Which product type is growing fastest to 2031?
Powered air-purifying respirators lead with a 9.44% CAGR as comfort and sensor features improve.
Which region shows the highest forecast growth?
Asia-Pacific is set to expand at an 8.32% CAGR thanks to new safety mandates and industrial projects.
Why are FFP3 masks gaining share in Europe?
Updated EN 149 nano-particle tests push buyers toward FFP3 filtration for pharmaceutical and clean-room use.
How is online retail changing procurement patterns?
E-commerce and subscription filter programs grow at 10.88% CAGR, offering lower pricing and automated replenishment.