
Resins In Paints And Coatings Market Size and Share
Market Overview
| Study Period | 2021 - 2031 |
|---|---|
| Market Size (2026) | USD 40.76 Billion |
| Market Size (2031) | USD 51.65 Billion |
| Growth Rate (2026 - 2031) | 4.85 % |
| Fastest Growing Market | Asia Pacific |
| Largest Market | Asia Pacific |
| Market Concentration | Medium |
Major Players *Disclaimer: Major Players sorted in no particular order Image © Mordor Intelligence. Reuse requires attribution under CC BY 4.0. | |
Resins In Paints And Coatings Market Analysis by Mordor Intelligence
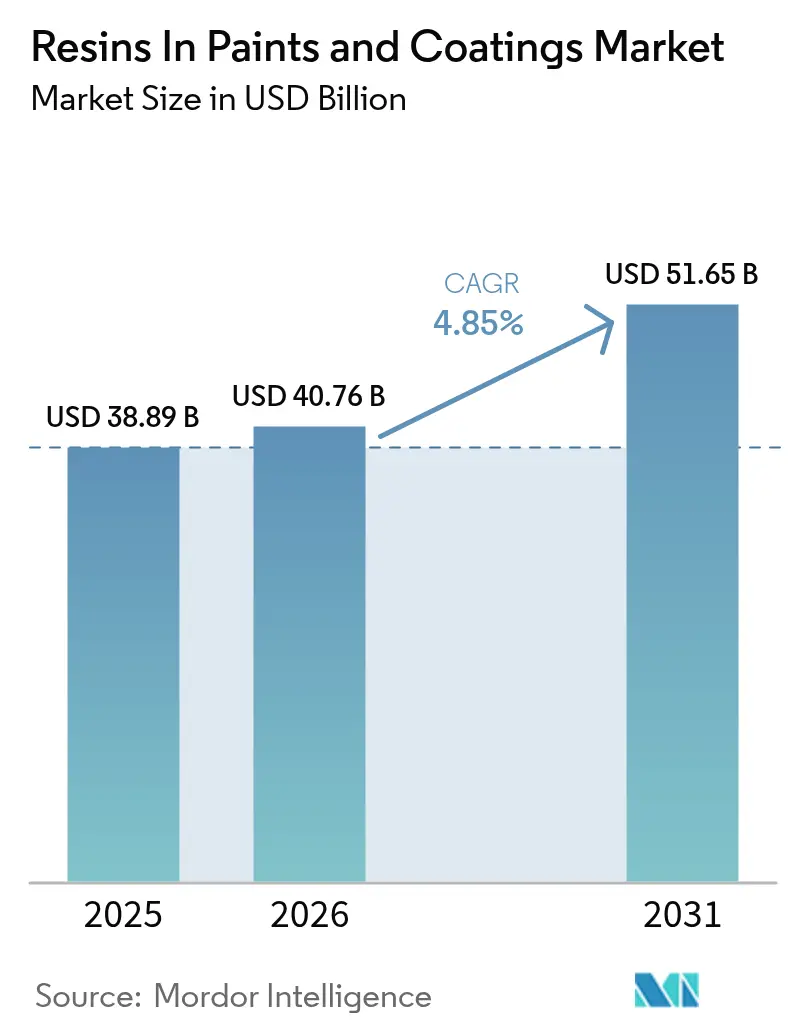
The Resins In Paints And Coatings Market size is expected to grow from USD 38.89 billion in 2025 to USD 40.76 billion in 2026 and is forecast to reach USD 51.65 billion by 2031 at 4.85% CAGR over 2026-2031. Demand pivots toward water-based acrylic and low-bake polyurethane chemistries as regulators tighten VOC ceilings across 40 national jurisdictions, while infrastructure programs in Asia-Pacific, the Middle-East, and North America channel stimulus dollars into corrosion-control and refurbishment coatings. Automotive OEM electrification reinforces the shift, because battery packs restrict oven temperatures and force clearcoat innovations that lower energy consumption and cycle times. Resin producers respond by scaling emulsion polymerization and bio-based epoxy capacity, although petrochemical feedstock volatility and the migration to powder-only finishing lines compress margins and challenge legacy alkyd assets. Patent activity around lignin-derived epoxies and cardanol-based polyols underscores a strategic realignment toward renewable feedstocks that satisfy emerging carbon-disclosure mandates.
Key Report Takeaways
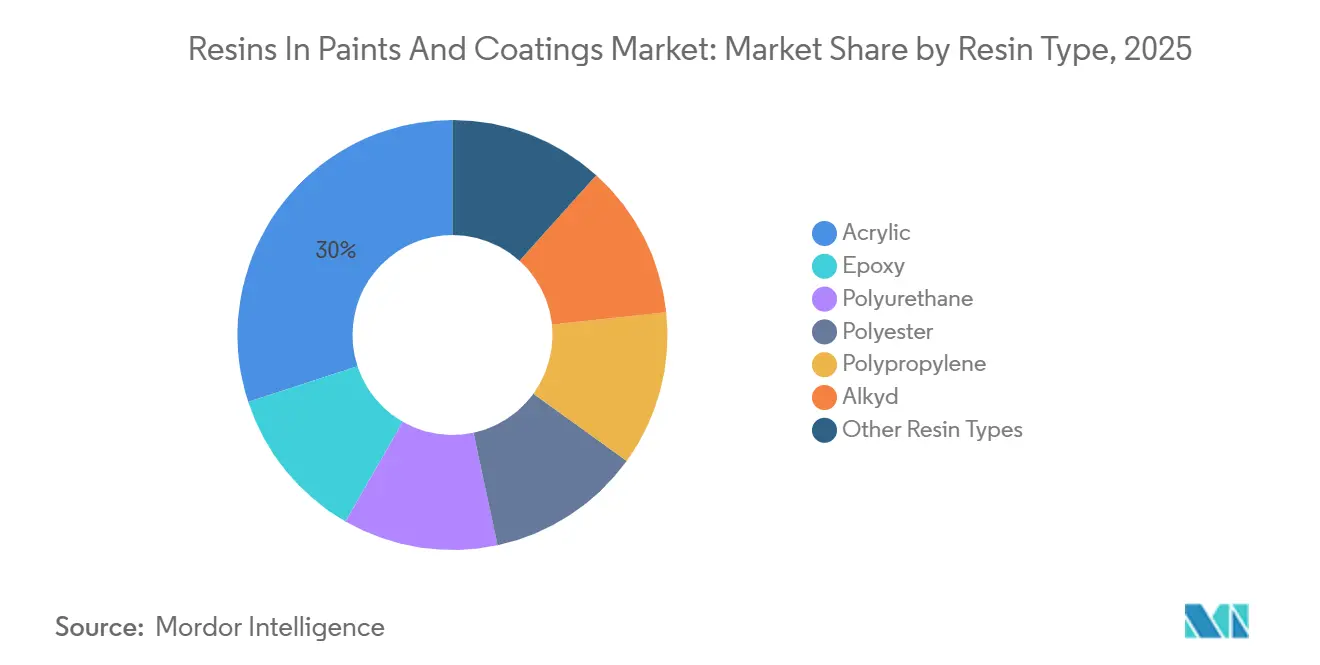
- By resin type, acrylic captured 30.05% of resins in paints and coatings market share in 2025, and this segment is forecast to post a 5.30% CAGR through 2031.
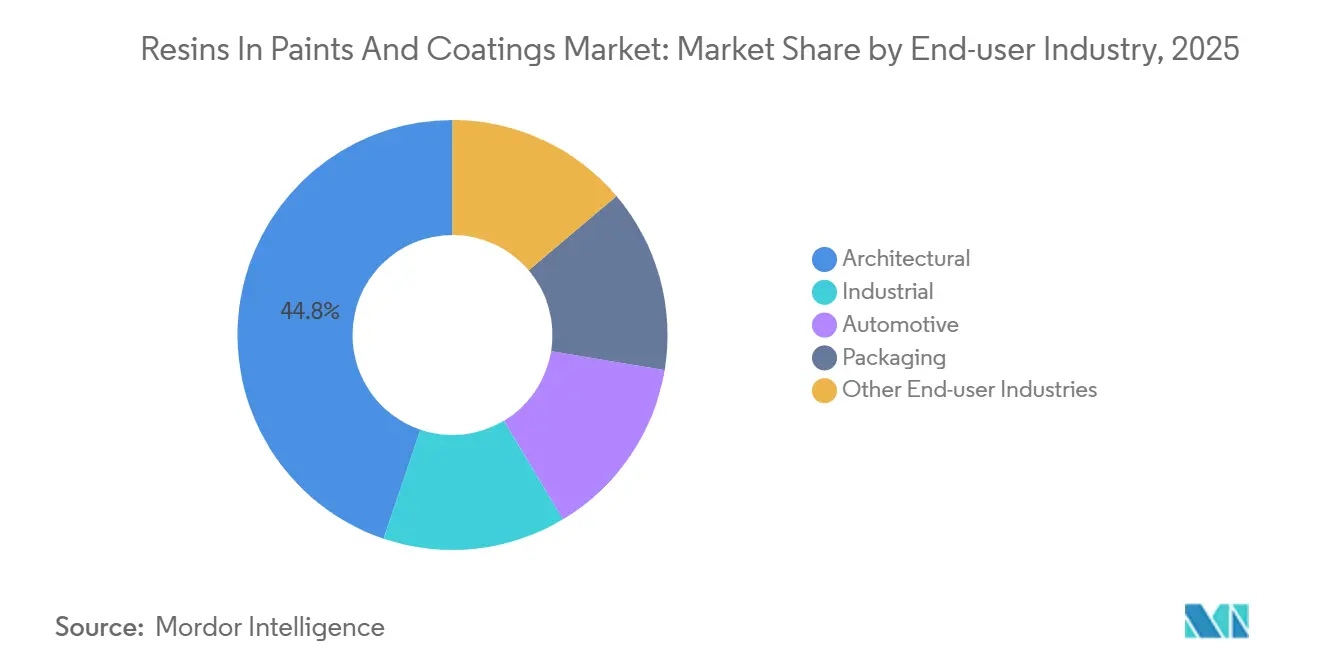
- By end-user industry, architectural accounted for 44.80% of the resins in paints and coatings market share in 2025 and is projected to expand at a 5.05% CAGR through 2031.
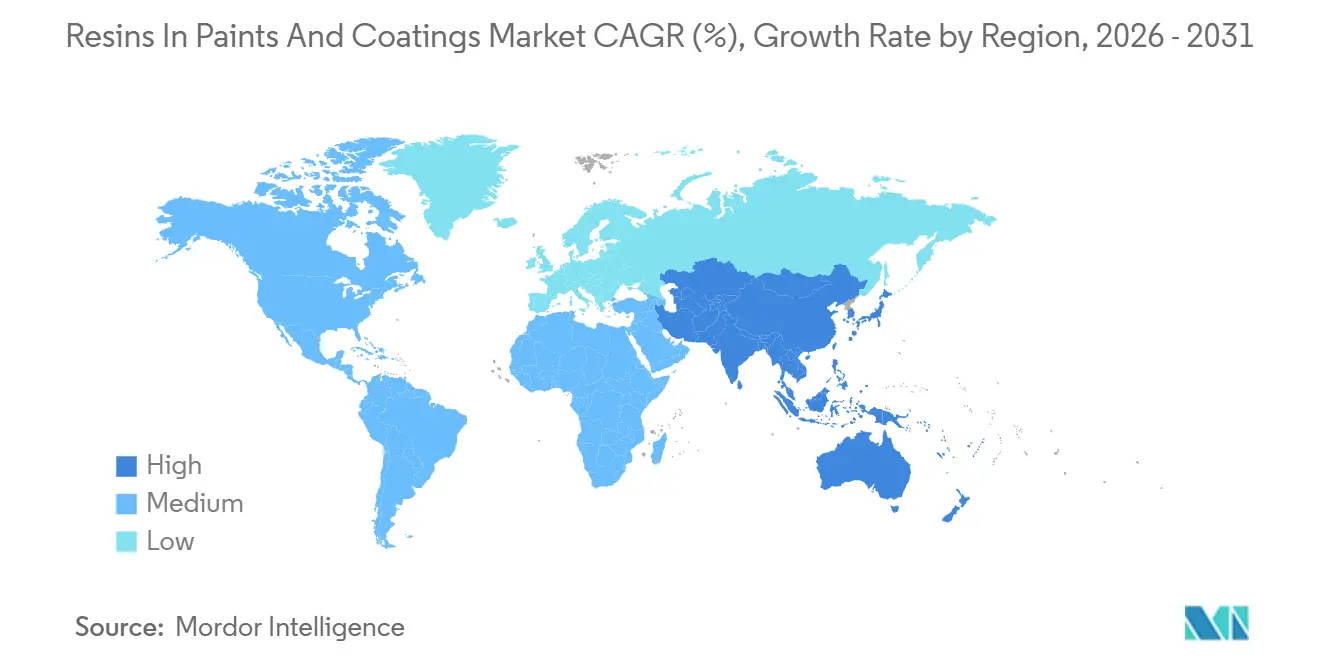
- By geography, the Asia-Pacific region captured 44.15% of the resins in paints and coatings market share in 2025 and is projected to expand at a 5.36% CAGR through 2031.
Note: Market size and forecast figures in this report are generated using Mordor Intelligence’s proprietary estimation framework, updated with the latest available data and insights as of 2026.
Market Trends and Insights
Drivers Impact Analysis of Resins In Paints And Coatings Market*
| Driver | (~) % Impact on CAGR Forecast | Geographic Relevance | Impact Timeline |
|---|---|---|---|
| Construction boom across Asia-Pacific | +1.2% | APAC core, spillover to Middle-East | Medium term (2-4 years) |
| Growing demand from automotive industry | +0.9% | Global, concentrated in East Asia and North America | Short term (≤ 2 years) |
| Refurbishment wave in Middle-East and Africa housing | +0.6% | Middle-East and Africa, secondary impact in South Asia | Medium term (2-4 years) |
| Growing demand for on-site 3D printing repair resins | +0.4% | North America and EU industrial clusters | Long term (≥ 4 years) |
| Increasing bio-based epoxy scale-up incentives | +0.7% | EU core, expanding to North America | Long term (≥ 4 years) |
| Source: Mordor Intelligence | |||
Construction Boom Across Asia-Pacific
Infrastructure programs in China, India, and ASEAN nations convert raw resin demand into multi-year contracts for waterborne acrylic and hybrid polyurethane systems. China’s 2025 mandate requiring low-VOC interior coatings in public buildings above 10,000 m² eliminated solvent-based alkyd primers from the commercial segment[1]. India’s plan to build 1,000 km of new metro track by 2027 specifies high-solids epoxy linings that resist monsoon moisture. Logistics-warehouse construction tied to e-commerce fulfillment in Vietnam and Indonesia embeds acrylic or methyl methacrylate polymers in polymer-concrete flooring, compressing cure times and downtime. Demand volatility remains high; a 10% dip in Chinese residential starts could strip roughly 150,000 t of annual acrylic volume, reinforcing the need for agile emulsion capacity.
Growing Demand from Automotive Industry
Battery-electric vehicle lines cap oven bake temperatures at 120 °C, replacing traditional 140-160 °C alkyd systems with 2-component polyurethane or acrylic-melamine clearcoats that rely on new catalyst packages. Hyundai’s USD 45 million e-coat upgrade in Ulsan finished in late 2025, adopting low-cure cathodic epoxies that perform at 110 °C. UV-curable acrylic resins increasingly coat plastic exterior parts, removing oven energy entirely. Dual-track demand forces suppliers to maintain alkyd assets for internal-combustion platforms while investing in acrylic and polyurethane emulsions for EVs, complicating capital allocation.
Refurbishment Wave in Middle-East and Africa Housing
Saudi Arabia’s Vision 2030 housing program earmarked SAR 12 billion (USD 3.2 billion) in 2025 for repainting projects that stipulate low-VOC acrylic emulsions. Dubai Municipality insists on chloride-resistant acrylic or silicone-modified resins for coastal zones. Egypt’s Cairo and Alexandria upgrades prioritize styrene-acrylic exterior masonry coatings. These projects demand rapid-drying, low-odor formulations packaged in smaller pails, spurring regional resin toll-blending. Temperature swings from 45 °C midday highs to 15 °C nights favor acrylic films with minimal stress cracking.
Growing Demand for On-Site 3D Printing Repair Resins
Portable 3D printers extrude UV-curable epoxies and acrylics that bond to pipelines and offshore structures in minutes, bypassing spray-application logistics. Dow’s 2025 patent (US 11,234,567) details a thixotropic epoxy enabling vertical surface printing. Offshore wind projects value these repairs because helicopter visits cost USD 10,000 each. While annual resin volume may remain below 5,000 t by 2031, the model signals a decentralized supply chain with on-demand resin synthesis. Certification hurdles by the American Petroleum Institute temper near-term uptake.
Restraints Impact Analysis of Resins In Paints And Coatings Market*
| Restraint | (~) % Impact on CAGR Forecast | Geographic Relevance | Impact Timeline |
|---|---|---|---|
| Feedstock price volatility | -0.8% | Global, acute in Asia-Pacific and Europe | Short term (≤ 2 years) |
| Shift toward powder-only systems | -0.5% | North America and EU industrial segments | Medium term (2-4 years) |
| Free monomer exposure limits tightening | -0.6% | North America and EU, expanding to APAC | Medium term (2-4 years) |
| Source: Mordor Intelligence | |||
Feedstock Price Volatility
Benzene averaged USD 820 t⁻¹ in Q1 2025, spiked 25% after cracker outages, and fell back to USD 840 t⁻¹ by Q4, eroding margins for styrene-acrylic and unsaturated polyester producers. Propylene’s decoupling from crude oil following new PDH units adds forecasting uncertainty. Resin makers without naphtha hedges delay expansions when price-band risk exceeds 15%, tightening supply and amplifying cyclical swings. Bio-feedstocks provide partial insulation but remain volume-constrained.
Free Monomer Exposure Limits Tightening
The U.S. EPA’s proposed 50 ppm residual styrene cap for interior paints forces vacuum-steam stripping that adds USD 80-120 t⁻¹ to styrene-acrylic costs[2]. ECHA’s January 2026 restriction on methyl methacrylate below 100 ppm compels longer polymerization runs in EU acrylic plants. Small formulators unable to retrofit distillation equipment may exit architectural markets, shifting demand toward waterborne polyurethane dispersions that contain no vinyl monomer.
*Our forecasts treat driver/restraint impacts as directional, not additive. The impact forecasts reflect baseline growth, mix effects, and variable interactions.
Resins In Paints And Coatings Market Segment Analysis
By Resin Type:
Acrylic Resins Capture Architectural and Automotive ShareAcrylic resins held 30.05% of resins in paints and coatings market share in 2025 and are projected to advance at a 5.30% CAGR through 2031, outperforming epoxy and polyurethane segments. Demand originates from interior wall paints that now dominate residential repaint cycles and from EV basecoats requiring low-bake performance. Epoxy maintains a premium niche in chemical-resistant marine applications, yet powder-coating substitution trims its liquid volume. Polyurethane bifurcates into 2-component systems for aerospace composites and single-component waterborne dispersions for cabinetry, preserving price premiums.
Polyester’s role in powder lines secures metal-finishing growth, while alkyd demand retrenches in high-VOC markets. Specialty silicone-modified acrylics and fluoropolymers command margins that attract R&D funding. Continuous emulsion polymerization coupled with machine-learning process control underscores why acrylic R&D filings at the 2025 European Coatings Show outnumbered rival chemistries four-to-one.

By End-user Industry:
Architectural Lead, Industrial Segment FragmentsArchitectural consumed 44.80% of resins in paints and coatings market share in 2025 and will grow at a 5.05% CAGR to 2031, anchored in Asia-Pacific housing and Middle-East refurbishment grants. Industrial fragment under bespoke substrate requirements, limiting plant utilization and inflating batch-changeover costs.
Automotive OEMs purchase high-value resins—polyurethane clearcoats and acrylic-melamine basecoats—with an average resin intensity 40% above other segments, yet global vehicle output plateau tempers volumetric growth. Packaging coatings rely on polypropylene-based or BPA-free epoxy alternatives to satisfy FDA and EU migration ceilings, providing a regulatory moat. Wood coatings and coil-coatings constitute a resilient sub-segment as renovation booms and appliance output rise, albeit at lower scale.
Geography Analysis
APAC Resins in Paints and Coatings Market
Asia-Pacific generated 44.15% of 2025 revenue and is projected to post the fastest 5.36% CAGR through 2031. China’s urban-migration target of 70% by 2030 sustains interior repaint cycles, while India’s highway and metro projects elevate epoxy and polyurethane demand for steel and concrete protection. Japanese and South Korean OEMs realign to EV coating requirements, sourcing low-bake resins that cut electricity use 20%. ASEAN’s electronics expansion necessitates durable coatings for device enclosures, drawing imports of acrylic and polyester intermediates. Currency swings and import reliance for benzene challenge profitability across the region.
North America Resins in Paints and Coatings Market
North America is buoyed by the U.S. Infrastructure Investment and Jobs Act, which funds USD 110 billion of road and bridge work through 2026. Traffic-marking and bridge-deck overlays lean on fast-cure acrylic and epoxy chemistries. Canada tightens building codes to enforce low-VOC interiors, further shifting away from solvent alkyds. Mexican automotive clusters apply high-solids polyurethanes but trim paint usage per vehicle as manufacturers adopt thinner coat architectures.
EMEA and South America Resins in Paints and Coatings Market
Europe is shaped by renovation grants and stringent chemical policy. Germany’s EUR 5 billion retrofit fund in 2025 underwrote facade coatings with silicone-modified acrylics that limit algae growth. France and Italy stipulate renewable-content thresholds, accelerating lignin-based epoxy trials in public projects. The European Chemicals Agency’s 2027 microplastics ban will necessitate reformulation of certain acrylic copolymers, signaling capex needs. South America and Middle-East and Africa demand is also accelerating because Brazil, Saudi Arabia, and Egypt bankroll housing upgrades emphasizing durable, low-cost emulsions.
Value Chain Analysis
The value chain begins with petrochemical and renewable feedstocks, which are converted into monomers and intermediates (for example acrylates, epoxies, and isocyanates) and then polymerized into base resins (acrylic, epoxy, polyurethane, polyester, alkyd) by integrated chemical producers and specialty resin makers. Upstream volatility in aromatics and olefins flows through to resin pricing and availability, while compliance requirements (including REACH-aligned controls and residual monomer limits referenced elsewhere in the report) add processing steps such as stripping and longer polymerization cycles. These changes raise conversion costs.
Midstream participants include resin manufacturers, toll and regional blenders, and distributors that supply coatings formulators and paint producers. For architectural and infrastructure coatings, logistics and lead-time performance increasingly act as differentiators. Capacity moves in Asia underscore the value of local integration and debottlenecking: Covestro completed a debottlenecking project at its Shanghai site in January 2026, lifting TDI capacity from 310,000 to 370,000 metric tons, and BASF inaugurated its Zhanjiang Verbund site in March 2026, bringing multiple plants and production lines online to shorten regional supply chains. Downstream, coatings formulators and OEM applicators (construction and infrastructure, automotive, packaging, marine, and industrial maintenance) increasingly ask for low-VOC and low-bake solutions, pushing resin suppliers toward waterborne dispersions, high-solids systems, and renewable-content inputs to support customer qualification and disclosure requirements.
Competitive Landscape
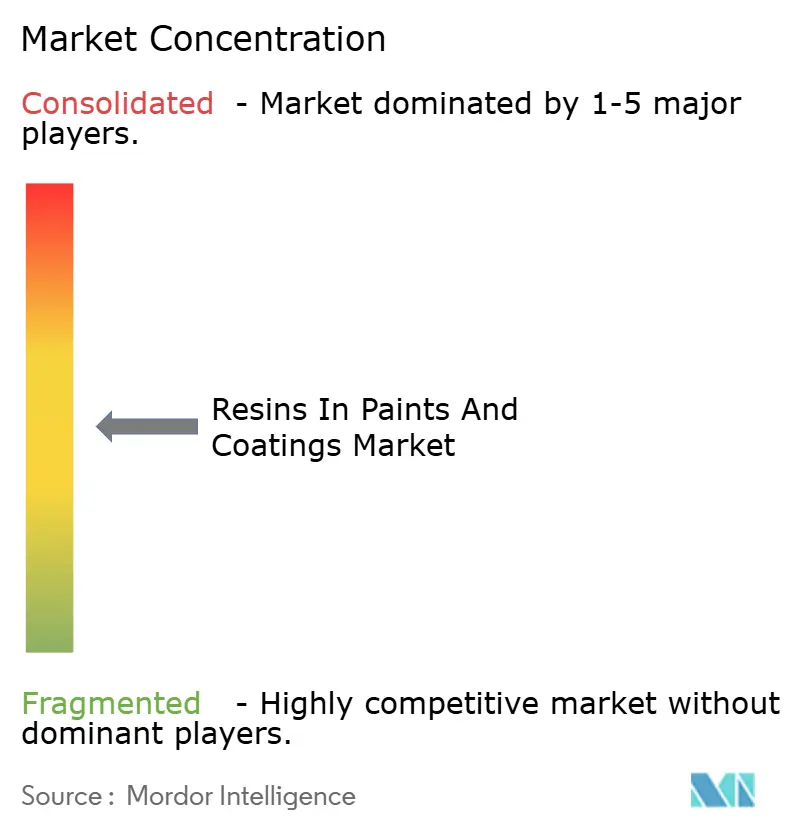
The resins in paints and coatings market exhibits moderate concentration: BASF, Dow, Sherwin-Williams, Arkema, and Allnex jointly hold about 45% of global capacity, yet regional formulators in ASEAN and the Gulf retain local architectural share via agile color-matching and short lead times. BASF’s 2025 annual report cites a 12% sales increase in acrylic emulsions driven by Indian and Southeast Asian housing. Dow’s 47 active patents for low-temperature-cure polyurethane dispersions indicate strategic focus on EV lines.
Machine-learning optimization of emulsion polymerization, carbon-footprint disclosure, and supply-chain traceability differentiate multinationals, while smaller players compete by co-locating blending assets adjacent to paint plants. Specialty entrants exploit white spaces—bio-based hardeners, algae-derived acrylic monomers, on-site 3D-printing resins—leveraging public sustainability mandates. ISO 9001 remains baseline, but customers increasingly award contracts based on audited Scope 3 emissions, pressuring laggards.
Service bundling intensifies: suppliers offer formulation co-development, inventory management, and digital color libraries that reduce mismatch scrap by 30%. Powder-coating resin demand concentrates around BASF, Axalta, and AkzoNobel, shrinking liquidity for independent liquid-resin producers. Yet architectural volume encourages toll-blending partnerships in markets where import duties inflate landed costs.
Resins In Paints And Coatings Industry Leaders
-
Dow
-
Arkema
-
BASF
-
The Sherwin-Williams Company
-
Allnex GMBH
- *Disclaimer: Major Players sorted in no particular order
Resins In Paints And Coatings Market Companies Covered in this Report
- Allnex GMBH
- Arkema
- BASF
- Covestro AG
- Dow
- Evonik Industries AG
- Hexion
- Huntsman International LLC
- Kangnam Chemical
- KANSAI HELIOS
- Mitsubishi Shoji Chemical Corporation
- Mitsui Chemicals, Inc.
- Olin Corporation
- Reichhold LLC 2
- Solvay
- Synthomer plc
- The Sherwin-Williams Company
- Uniform Synthetics
- Vil Resins
- Wanhua
- Westlake Epoxy
Market Opportunities and Future Outlook
The key opportunity sits at the intersection of VOC-driven reformulation and regional capacity localization, particularly in Asia where architectural volume and EV coating requirements are reshaping procurement. Regulatory and program anchors are already pushing this shift: the European Commission updated EU Ecolabel criteria for decorative paints, varnishes, and performance coatings via Commission Decision 2025/2607 (effective through 31 December 2032), and New Jersey implemented amended VOC content requirements for specified paint and wood floor coating categories with an effective date in August 2026. These measures reward resin platforms that reduce volatile content and residual monomers, widening the addressable pool for waterborne acrylics, polyurethane dispersions, and bio-based epoxy pathways referenced in the report context.
Investment patterns also provide clear signals on where suppliers and paint makers are building capability. BASF expanded polyester and polyurethane resin capacity at Caojing, Shanghai in March 2025 (from 8,000 to 18,800 metric tons per year) and added a new dispersions line in Mangalore, India in February 2026, aligning with the report theme of scaling emulsion and dispersion technologies for architectural and industrial customers. At the same time, paint manufacturers are moving upstream to stabilize quality and availability, illustrated by Grasim Industries starting commercial production of a resin manufacturing block at its Birla Opus Paints plant in Mahad, India (22 million litres per annum, June 2025). Together, these actions point to opportunities in local supply assurance, faster qualification cycles for low-VOC systems, particularly when public building and infrastructure specifications are involved, and differentiated resin offerings tied to traceable renewable electricity or biomass-balanced inputs for customers that audit Scope 3 emissions.
Recent Industry Developments in Resins In Paints And Coatings Market
- July 2026: BASF expanded its certified biomass-balanced additives portfolio for architectural coatings by introducing Dispex AA 4145 MB, Rheovis PU 1333 MB, and Rheovis HS 1169 MB. The launch strengthens the toolbox for low-VOC, sustainability-labeled formulations while giving paint makers additional options to document renewable feedstock allocation in procurement and specification work.
- March 2026: BASF launched butyl acrylate RE and 2-ethylhexyl acrylate RE at its Freeport, Texas site using attributed renewable electricity. This adds a lower-carbon route for key acrylic building blocks, supporting resin and coatings producers that are reformulating around carbon disclosure and renewable-content requirements without changing core performance targets.
- October 2025: The Sherwin-Williams Company completed its acquisition of BASF's Brazilian architectural paints business (Suvinil). The deal reshapes regional competitive dynamics in architectural coatings, and it can influence resin sourcing strategies as the combined footprint rationalizes formulations, supplier panels, and manufacturing networks in Latin America.
Resins In Paints And Coatings Market Report Scope and Research Methodology
Market Definition and Coverage
This market covers the value of resins used as binders in paints and coatings, where the resin forms the film and helps hold pigments together while delivering key performance properties.
Scope exclusions: The sizing excludes pigments, additives, solvents, and application services, and it also excludes finished paint and coating sales where the resin component cannot be separated in value terms.
Segments Covered in This Report
- By Resin Type
- Acrylic
- Epoxy
- Polyurethane
- Polyester
- Polypropylene
- Alkyd
- Other Resin Types
- By End-user Industry
- Architectural
- Industrial
- Automotive
- Packaging
- Other End-user Industries
- By Geography
- Asia-Pacific
- China
- India
- Japan
- South Korea
- ASEAN Countries
- Rest of Asia-Pacific
- North America
- United States
- Canada
- Mexico
- Europe
- Germany
- United Kingdom
- France
- Italy
- Spain
- Russia
- Rest of Europe
- South America
- Brazil
- Argentina
- Rest of South America
- Middle-East and Africa
- Saudi Arabia
- United Arab Emirates
- South Africa
- Egypt
- Rest of Middle-East and Africa
- Asia-Pacific
Data Sources, Market Sizing, and Validation
Desk Research
Desk research starts by mapping where paint and coating demand originates and how resin consumption typically tracks it. We review public datasets and technical references such as US Census construction and manufacturing releases, Eurostat industrial production series, UN Comtrade trade statistics, the USGS for upstream chemical and minerals context, and EPA materials and emissions guidance that influences coating formulation choices.
Next, the model is anchored using public company filings and investor presentations for demand cues, capacity additions, and pricing commentary, along with trade association and standards body publications that explain binder system use across applications. A paid subscription for company financials and intelligence is used selectively to map revenue exposure and to avoid double counting across integrated producers and downstream formulators, and patent databases help confirm where chemistry shifts are happening. These examples are not exhaustive, and many other public sources were also checked for data collection, validation, and clarification.
Primary Interviews and Surveys
Primary work focuses on validating how resin demand is distributed across major coating uses and how pricing and mix shifts are being applied in real contracts. We speak with stakeholders across resin producers, paint and coating formulators, distributors, and large end users, and we keep APAC, EMEA, and the Americas in view so regional construction cycles and industrial output trends are not treated as one global average.
Distribution of primary research fieldwork respondents
| Company type | Respondent position | Region |
|---|---|---|
| Top tier: 39% | CXOs: 16% | APAC: 39% |
| Mid tier: 41% | Functional/Unit leaders: 37% | EMEA: 34% |
| Smaller Players: 20% | Managers: 47% | Americas: 27% |
Market-Sizing & Forecasting
Sizing is built using top-down and bottom-up logic, where paint and coating demand signals are reconstructed first and then translated into resin value using mix and pricing assumptions. The top-down path uses region-wise paint and coatings activity indicators, applies resin intensity and split assumptions by major end uses, and then converts to value using resin-type mix and average pricing bands.
To keep the model grounded, we also run selective bottom-up checks such as sampled producer and distributor revenue mapping, spot checks of resin consumption per coating type, and sanity checks using import and export flows for key resin families. Inputs that tend to matter most include building and infrastructure activity, industrial production levels, automotive output, packaging demand, and formulation shifts toward waterborne and higher solids systems that change resin mix and realized pricing.
Forecasts are developed using multivariate regression, where the forward view is tied to the expected path of construction, manufacturing output, and vehicle production, then adjusted for resin mix changes and price normalization discussed in primary interviews. Where bottom-up visibility is thin for smaller local suppliers, the gap is handled through regional shares and channel feedback before totals are finalized.
Data Validation & Update Cycle
Validation is handled through stepwise cross checks so the totals match how the industry behaves in practice. The model outputs are compared with independent signals such as coating production trends, trade movements for key resin groups, and public capacity announcements, and variances are reviewed and corrected when a driver does not explain the change.
Before sign off, the work is reviewed by another analyst, and any large swings trigger re-checks of assumptions and follow-up calls when needed. Reports are refreshed annually, and interim updates are made when material events occur, such as sharp feedstock price moves, major plant shutdowns, or regulatory changes that can shift resin mix. Right before delivery, a final freshness pass is completed so clients receive the latest updated view.
Mordor Intelligence's Paints and Coatings Resins Market Estimate Compared With Other Published Estimates
Published market sizes for resin binders in paints and coatings can look far apart because studies draw the boundary differently and then apply different pricing and mix assumptions. Differences also show up when one estimate focuses on coating resins as a narrower chemistry set, while another rolls in broader polymer categories or adjacent formulation components.
By tracking resin type mix by end use and refreshing currency and pricing timing assumptions, Mordor Intelligence keeps the estimate tied to resins used as binders in paints and coatings and avoids counting pigments, additives, or full finished paint value in the same number.
Benchmark comparison
| Source | Market Size | Gaps in Research Methodology |
|---|---|---|
| Mordor Intelligence | USD 40.76 B (2026) | |
| Industry Data Publisher A | USD 10.86 B (2025) | Often reflects a narrower product scope that can lean toward selected resin families or specialty grades, which reduces the addressable value compared with a full binder resin view across architectural and industrial coatings. |
| Market Portal B | USD 32.20 B (2025) | Uses a different base year and a longer horizon with broader formulation categories in some cuts, and the approach can blend resin value with formulation type assumptions that are not consistently reconciled back to coating activity indicators. |
The spread across sources mostly comes from what is counted as resin value, the year used for sizing, and how resin mix and price changes are carried forward. When the scope is kept to binder resins and the key demand indicators are checked region by region, the resulting total is easier to trace and repeat for planning decisions.
Key Questions Answered in the Report
What is the size of the resins in paints and coatings market?
The resins in paints and coatings market size stands at USD 40.76 billion in 2026 and is forecast to reach USD 51.65 billion by 2031, expanding at a 4.85% CAGR from 2026.
What geographic region contributes most to future volume growth?
Asia-Pacific represents 44.15% of 2025 revenue and is set to deliver the fastest 5.36% CAGR through 2031, driven by urbanization, infrastructure programs, and EV production.
How are feedstock price swings impacting resin producers?
Benzene, propylene, and ethylene price volatility of 20-25% in 2025 compressed margins for non-integrated producers and delayed expansion plans, trimming near-term supply growth.
Which regulatory trend could force major reformulation in liquid coatings?
Tighter residual monomer caps—50 ppm styrene in the U.S. and 100 ppm methyl methacrylate in the EU—require costly stripping investments or shifts to alternative chemistries such as waterborne polyurethanes.