
Egypt Residential Real Estate Market Analysis by Mordor Intelligence
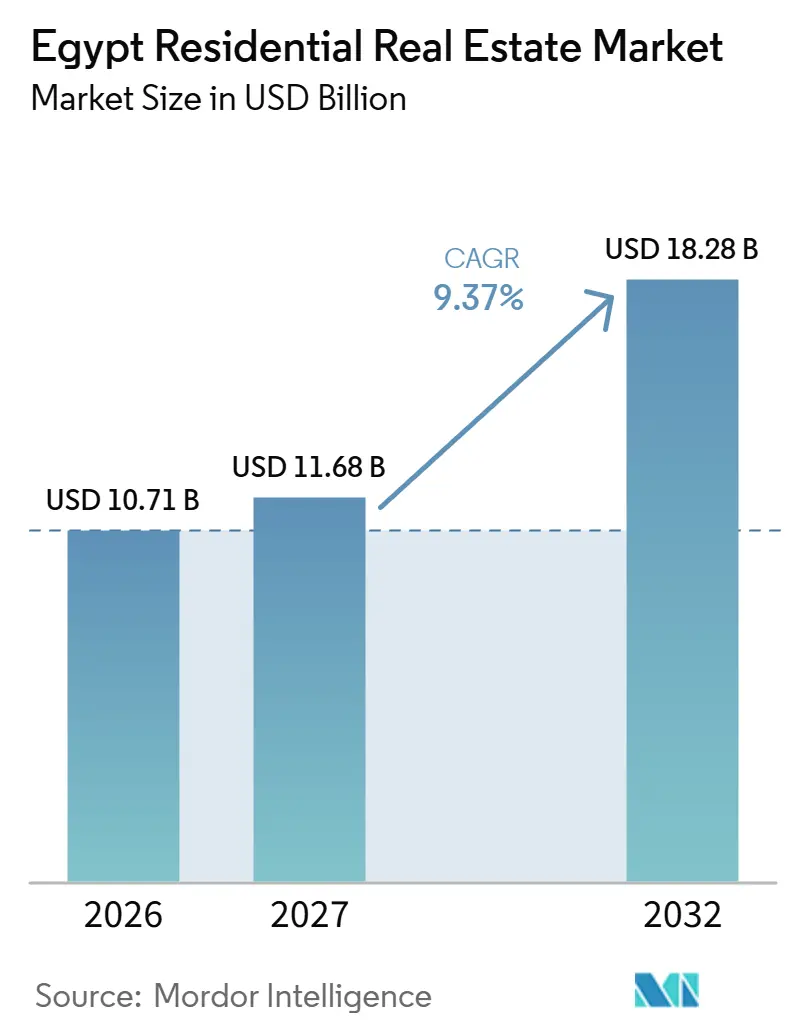
The Egypt residential real estate market size is estimated at USD 10.71 billion in 2026 and is projected to be USD 11.68 billion in 2027, reaching USD 18.28 billion by 2032, growing at a CAGR of 9.37% from 2027 to 2032.
Egypt's expanding urban population and oversubscribed housing programs provide demand support that outweighs construction-cost pressure and approval delays in the growth outlook. State-backed provision and mortgage finance broaden routes into housing, while income eligibility constrains access to subsidized homes. For Cairo apartment developers, that combination favors delivery commitments matched to construction funding rather than longer payment plans alone. The Social Housing and Mortgage Finance Fund's middle-income mortgage terms also leave qualifying buyers needing substantial savings upfront, limiting how far repayment extensions alone can widen access.
Key Report Takeaways
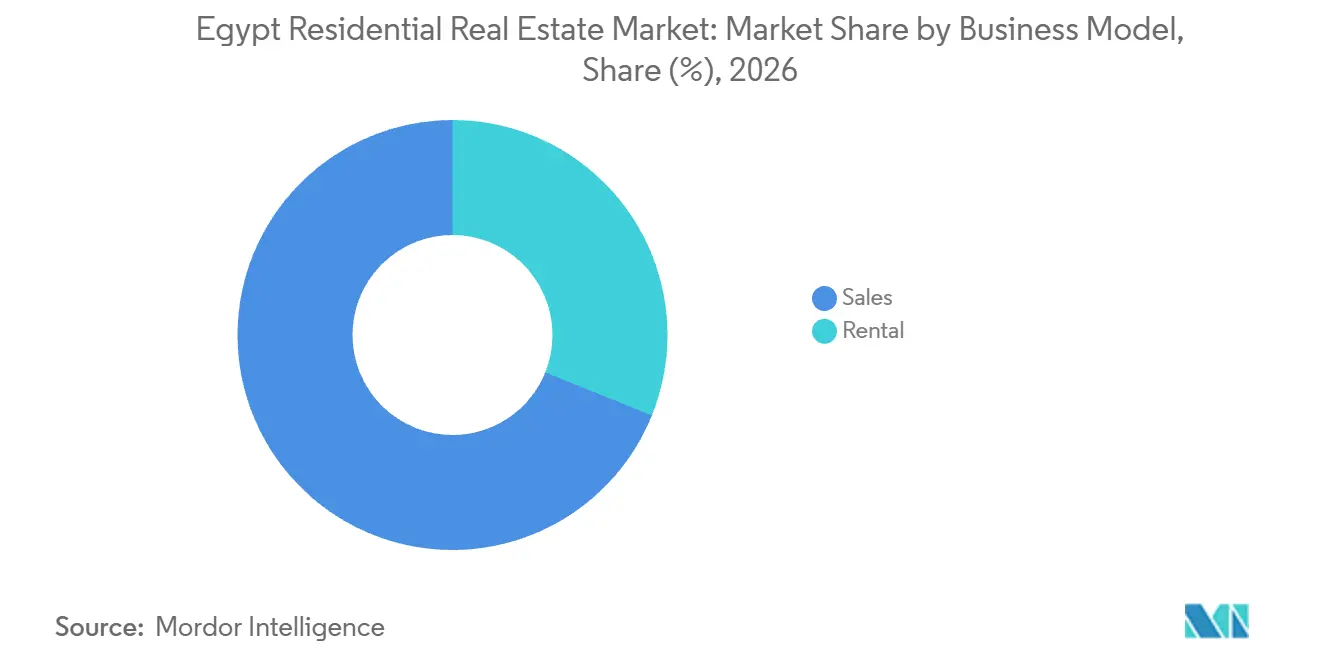
- By business model, sales held a 68.9% Egypt residential real estate market share in 2026, while rental is the fastest-growing segment with a projected CAGR of 10% from 2027 to 2032.
- Geographically, Cairo accounted for a 44.6% share of the Egypt residential real estate market size in 2026 and is also the fastest-growing geography, with a projected CAGR of 11.05% from 2027 to 2032.
Note: Market numbers in this report are based on Mordor Intelligence's proprietary estimation framework, which combines nine months of actuals with Q4 projections for base year 2026.
Market Trends and Insights
Drivers Impact Analysis of Egypt Residential Real Estate Market*
| Driver | (~) % Impact on CAGR Forecast | Geographic Relevance | Impact Timeline |
|---|---|---|---|
| Large housing deficit sustaining long-term demand for new projects | +4% | Badr, Capital Gardens, October Gardens, New October, 10th of Ramadan, New Obour | Long term (≥ 4 years) |
| Government-backed initiatives by the New Urban Communities Authority driving large-scale housing supply | +3.5% | Nationwide | Medium term (2-4 years) |
| Rapid population growth and urbanization fueling demand in Cairo and emerging cities | +3% | Nationwide | Long term (≥ 4 years) |
| Expansion of mortgage finance improving affordability for middle-income buyers | +2.2% | Nationwide | Medium term (2-4 years) |
| Rising demand for gated communities and modern apartments driven by safety and lifestyle preferences | +1.1% | Greater Cairo, Alexandria, Red Sea coastal areas | Medium term (2-4 years) |
| Source: Mordor Intelligence | |||
Large housing deficit sustaining long-term demand for new projects
In January 2026, the Social Housing and Mortgage Finance Fund preliminarily ranked 98,464 Housing for All Egyptians 5 applicants against 30,600 Housing for All Egyptians 7 units across 6 new cities. The cities were Badr, Capital Gardens, October Gardens, New October, 10th of Ramadan, and New Obour. Final eligibility depended on checks for prior housing benefits or homeownership, income limits, and compliance with application-booklet terms. For a residential developer, the relevant distinction is between interest in a specific program and households qualified to take up its homes. Additional phases addressing these cities can target the documented application pressure while aligning delivery commitments with the program's eligibility process.
Government-backed initiatives by the New Urban Communities Authority driving large-scale housing supply
Government housing programs can support residential activity at different points in the construction and occupancy cycle. In September 2026, the New Urban Communities Authority offered 10,000 rent-to-own homes across about 26 new cities in Egypt. About 5,000 were completed and ready for delivery, while another approximately 5,000 were scheduled for construction over 3 years. For contractors and housing operators, separating these tranches clarifies whether the commercial opening concerns building additional homes or bringing finished properties into use. Allocating ready stock can generate the program's near-term housing contribution while future construction commitments advance.
Rapid population growth and urbanization fueling demand in Cairo and emerging cities
Egypt's urban share changed little between 2000 and 2025, moving from 42.7% to 42.9%. Egypt's estimated urban population rose from 31.23 million in 2000 to 50.78 million in 2025.[2] That is an addition of about 19.55 million urban residents over 25 years. Developers can therefore size urban projects to that added headcount.
Expansion of mortgage finance improving affordability for middle-income buyers
Mortgage finance can broaden access to homeownership by spreading the capital required for a purchase across a repayment period. Egypt's Financial Regulatory Authority reported that financing value provided by mortgage-finance companies increased 67.5% from end-2024 to end-2025. Those companies had financed about 115,000 clients by end-2025. In May 2025, the Social Housing and Mortgage Finance Fund described the announced 15,000-unit Housing for All Egyptians 7 offer for middle-income citizens subject to monthly income ceilings. Its mortgage terms included 12% annual interest, a down payment starting at 25%, and repayment over up to 20 years. Those terms spread payments over up to 20 years, but the 25% minimum down payment means the Fund's middle-income offer reaches mainly households able to fund upfront equity.
Restraints Impact Analysis of Egypt Residential Real Estate Market*
| Restraint | (~) % Impact on CAGR Forecast | Geographic Relevance | Impact Timeline |
|---|---|---|---|
| High construction costs due to inflation and currency depreciation | -2.1% | Egyptian North Coast | Short term (≤ 2 years) |
| Bureaucratic hurdles and lengthy approval processes delaying project execution | -1.3% | Egyptian North Coast | Medium term (2-4 years) |
| Economic instability impacting affordability and investor confidence | -1% | Nationwide | Short term (≤ 2 years) |
| Source: Mordor Intelligence | |||
High construction costs due to inflation and currency depreciation
Rising construction bills create a funding problem before a developer receives the full price of a home. In August 2026, Al Ahly Sabbour chairman Ahmed Sabbour reported construction costs per square meter rising around 20% to 25% across its North Coast projects over the preceding 12 months.[1] The increase came amid higher material, contracting, energy, transportation, and supply-chain costs. When sales proceeds arrive over time, a larger construction bill increases the financing needed to fulfill the same residential commitment. Al Ahly Sabbour was diversifying its funding sources to avoid relying solely on sales proceeds while financing construction and collecting payments over time. That response changes how construction is financed, while the higher cost of delivering the homes leaves a larger cash requirement.
Bureaucratic hurdles and lengthy approval processes delaying project execution
Al Manassa reported in August 2025 that some North Coast companies had delayed construction because of sharp inflation and delayed building-permit approvals. Al Manassa also reported that the New Urban Communities Authority had threatened to revoke land from companies with incomplete development. A developer in that position faces an execution requirement partly dependent on an administrative process outside its construction operation. Faster building work cannot recover time while a necessary permit is outstanding, making approval sequencing material to site execution. In December 2025, the Administrative Capital for Urban Development announced completion of phase one of a digital licensing and approvals system for the New Administrative Capital. In cases involving threatened revocation, an unresolved approval interval can put the land position underpinning future residential sales at risk.
*Our forecasts treat driver/restraint impacts as directional, not additive. The impact forecasts reflect baseline growth, mix effects, and variable interactions.
Egypt Residential Real Estate Market Segment Analysis
By Business Model:
Ownership Commitments and Rental RepricingSales accounted for a 68.9% share of the Egypt residential real estate market size in 2026. Madinet Masr, whose portfolio includes residential and nonresidential offerings, reported 2,971 units sold in the first half of 2026, up 70.9% from the first half of 2025. It delivered 1,200 units across its developments in the first half of 2026, up 130.3% from 521 a year earlier. The largest segment connects purchase commitments with eventual possession, and Madinet Masr's handovers increased faster than its new unit sales. That stronger delivery increase gives ownership buyers execution evidence alongside rising commitments, although the 2 measures concern different transaction stages.
Rental is the fastest-growing segment, with a projected CAGR of 10% from 2027 to 2032. The Built Environment Observatory's Cairo-wide unfurnished apartment asking-rent index rose 15% year over year in the first 6 months of 2026, compared with 6% between 2024 and 2025. Its analysis used neighborhood medians from more than 18,000 online listings across 26 Cairo Governorate neighborhoods under New Rent, or market-rent, leases. Asking rents rose in 11 neighborhoods, remained stable in 7, and fell in 8. Landlords therefore need neighborhood-specific repricing, because a citywide increase does not support higher asking rents in every local letting market.

Geography Analysis
Cairo Residential Real Estate Market
Cairo, the largest and fastest-growing geography, represented a 44.6% Egypt residential real estate market share in 2026 and is projected to grow at a CAGR of 11.05% from 2027 to 2032. Cairo Governorate estimated its population at 10,478,084 in 2026. Emaar Misr reported that Phase II at Mivida Gardens in East Cairo sold out within 24 hours of reservations opening in January 2026. Within East Cairo, the phase's sellout shows how quickly demand at Mivida Gardens absorbed newly released supply.
Palm Hills New Cairo was among projects with a combined 1,200 contractual units ready for FY2026 handover in the developer's first-quarter 2026 results. The 6th of October City Development Authority scheduled handovers for 23 first-phase Housing for All Egyptians buildings in the Middle Industrial Separation Area from September 20 through October 21, 2026. West Cairo received 1,486 SODIC unit deliveries in 2025. During a May 2025 Giza Governorate visit, Egypt's prime minister inspected the Housing Ministry-developed Saba compound in 6th of October's northern expansion zone, comprising 85 buildings and 2,040 fully finished units. The public schedule defined a handover window for 23 buildings, while Palm Hills' Q1 report identified 1,200 private contractual units prepared for FY2026 handover.
In July 2025, Egypt's housing minister reviewed execution and infrastructure progress at Sawary in western Alexandria. Alexandria's Sawary scope at that review included 64 residential towers with 3,068 units, plus 310 villas. On the North Coast, IHG Hotels & Resorts and Mountain View for Development and Real Estate Investment signed an August 2026 agreement for 280 planned Hotel Indigo branded residences at Ras El Hekma. In FY2025, international sales accounted for approximately 39% of real-estate sales at El Gouna, Orascom Development's integrated town in the Red Sea Governorate. El Gouna's international exposure makes cross-border buyer access commercially relevant, whereas the Ras El Hekma agreement differentiates planned homes through a named hospitality brand.
Regulatory Framework and Outlook
The comparison examines selected jurisdictions through Egypt's national framework and Cairo's local administration, from the perspective of a compliant residential developer. The Ministry of Housing identifies Building Law 119/2008 and its executive regulations as the national building framework. Cairo Governorate offers applications for new-building permits and statements of planning status and building requirements. Residential electricity connections require approval from city neighborhoods or village councils, or from the competent city authority in New Urban Communities Authority cities.
Regulatory Table of Egypt Residential Real Estate Market
| Decision factor | Egypt | Cairo |
|---|---|---|
| Primary authority | Ministry of Housing, Utilities and Urban Communities | Cairo Governorate neighborhood administrations |
| Key instruments or direction | Building Law 119/2008 and executive regulations | National framework administered through local permit and planning services |
| Commercial effect | Building compliance and residential electricity-approval documentation | Local permit interface and neighborhood electricity approval |
| Current policy attractiveness | Medium | Medium |
| Future direction of policy attractiveness | Hardening | Hardening |
| Source: Mordor Intelligence | ||
The Medium ratings balance a defined national compliance framework and a documented Cairo service interface against the approval steps required for residential electricity connections. On October 12, 2026, Housing Minister Randa El-Menshawy said Egypt was finalizing a draft law that would require separate project or phase bank accounts for developer revenues and expenses.[3] The Hardening judgment follows the proposed financial segregation, which would tie developers' cash management to explicit project boundaries. Cairo's developers receive the same direction through exposure to the national proposal alongside local administration.
Value Chain Stages
The value chain compares residential development, construction execution, and buyer finance by the activity each participant performs. Madinet Masr develops large-scale communities in Egypt, placing the developer at the point where residential projects are assembled. In October 2025, IMAKN MISR awarded Innovo residential and infrastructure works at Alburouj, including 18 residential buildings. Combining buildings with supporting infrastructure in a construction package makes coordination between the developer and contractor central to converting a project into usable housing.
Value Chain Analysis Table of Egypt Residential Real Estate Market
| Primary activity | Key participants | Value capture | Bottleneck | Resilience response |
|---|---|---|---|---|
| Residential project development | Community developers such as Madinet Masr | Property sales | Matching project commitments to execution capacity | Phase commitments around deliverable construction packages |
| Building and infrastructure construction | Construction contractors such as Innovo | Contract payments for residential and infrastructure works | Dependencies between buildings and site infrastructure | Coordinate milestones across both work packages |
| Residential buyer finance | Mortgage-finance banks such as EBank | Financing interest | Matching borrower and property eligibility to the loan | Check both qualification requirements before committing financing |
| Source: Mordor Intelligence | ||||
EBank offers mortgage financing for residential units, including first and summer homes, across Greater Cairo and Egypt's governorates. That places a separate financial intermediary between a household's acquisition decision and the funding required to carry it out. Bundling residential buildings and infrastructure lets a contractor such as Innovo earn from both parts of the award, while EBank's interest opportunity depends on qualifying household loans.
Competitive Landscape
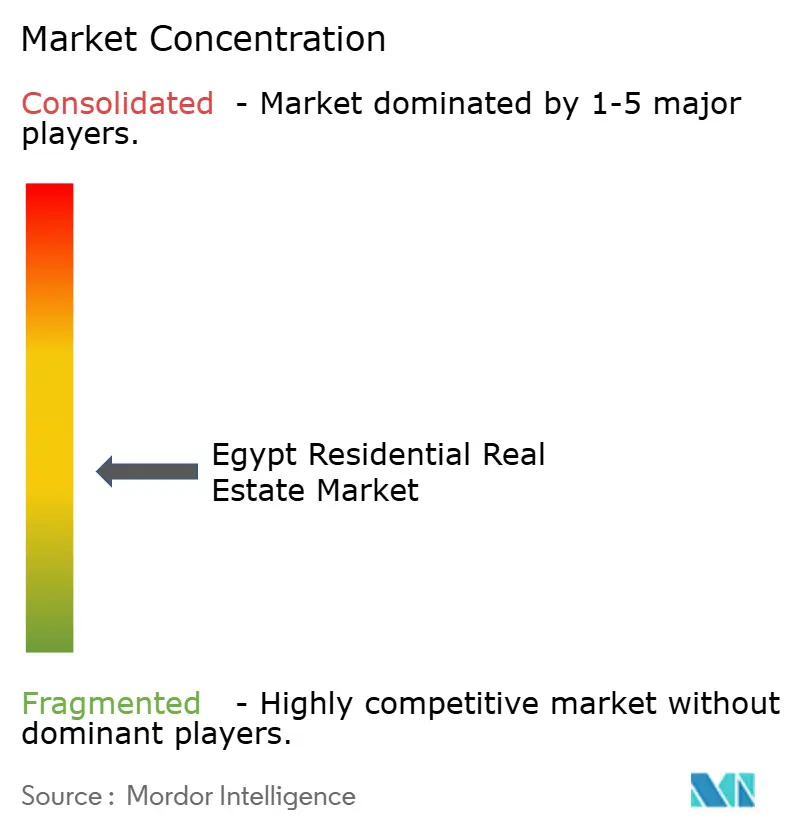
Competition is moderately fragmented, with integrated-destination developer Orascom Development alongside Palm Hills Developments, whose Egyptian portfolio includes residential, commercial, and resort projects. Emaar Misr contracted ACC Group for a residential package at Marassi Red Sea in September 2026, while Talaat Moustafa Group (TMG) develops integrated projects within a diversified business. SODIC operates as the Egyptian development business overseen by Aldar's International segment. Orascom's integrated destinations and Palm Hills' residential, commercial, and resort portfolios contrast with TMG's diversified business and SODIC's position within Aldar's International segment, giving buyers several development models.
SODIC launched EASTVALE at Mostakbal City in December 2025 and reported sales within one month of launch. Palm Hills Developments launched the residential project Village de La Capitale in the New Administrative Capital during Q1 2026. SODIC also delivered approximately 2,083 residential units across Egypt in 2025, compared with 1,045 in 2024. SODIC's nearly doubled annual handovers give buyers execution evidence alongside the new-city offerings launched by both developers.
Orascom Development Egypt, the group's Egyptian listed developer, reported that FY2025 net real-estate sales across El Gouna, O West, and Makadi Heights declined 30% year over year. SODIC reported 1,788 units sold across Egypt in 2025, compared with 1,270 in 2024. Eastvale accounted for approximately 44% of SODIC's contracted sales in 2025. That concentration makes the performance of a single project particularly important to SODIC's sales mix. The contrasting results on each developer's own measure favor a company-specific assessment of performance over a single claim of sector-wide momentum.
Egypt Residential Real Estate Industry Leaders
-
Orascom Development
-
Palm Hills Developments
-
Emaar Misr
-
Talaat Moustafa Group (TMG)
-
SODIC
- *Disclaimer: Major Players sorted in no particular order
Egypt Residential Real Estate Market Companies Covered in this Report
- Orascom Development
- Palm Hills Developments
- Emaar Misr
- Talaat Moustafa Group (TMG)
- SODIC
- Madinet Masr
- Mountain View
- Hyde Park Developments
- Tatweer Misr
- City Edge Developments
- Hassan Allam Properties
- La Vista Developments
- NEWGIZA
- Ora Developers
- Iwan Developments
- Wadi Degla Developments
- Cairo Festival City (Al-Futtaim)
- DMG Mountain View-iCity
- Sixth of October Development & Investment (SODIC)
- Ahmed Sami Developments
Key Opportunities for Market Participants
The comparison evaluates rental-housing opportunities for different eligible household needs within Egypt's public allocation channel. The Social Housing and Mortgage Finance Fund offered 15,000 rental homes for low-income citizens, with general applications open from September 28 through October 28, 2026. The offer includes persons with disabilities, while the broader rental-housing initiative aims to help young people obtain accommodation. Applicants may not apply simultaneously to the Fund's rental channel and the New Urban Communities Authority's rent-to-own offer.
Market Opportunities Table of Egypt Residential Real Estate Market
| Opportunity | Why now | Buyer / lead segment | Recommended play | Main barrier | Likely beneficiaries |
|---|---|---|---|---|---|
| Qualifying low-income rental occupancy | Expanded public rental offer | Eligible low-income households | Match applicants to homes under the rental program | Eligibility checks and available-unit matching | Qualifying renters and the Social Housing and Mortgage Finance Fund |
| Rental access for young households | Policy emphasis on young people's housing access | Qualifying low-income young households | Use rental tenure to establish accommodation without an immediate ownership commitment | Capacity to sustain rental payments | Qualifying young renters and the Social Housing and Mortgage Finance Fund |
| Housing allocation matched to disability-related needs | Applications include persons with disabilities | Qualifying low-income applicants with disabilities | Match available homes to individual accommodation needs | Physical suitability of the available unit for the household | Qualifying households with disabilities and the Social Housing and Mortgage Finance Fund |
| Source: Mordor Intelligence | |||||
The Fund announced 3-year rental terms for the offer, whose general application window closes on October 28, 2026, before the forecast period begins. Tenants could apply to purchase subject to rent payments, a down payment, an application, and mortgage-finance procedures. Monthly rental subsidies were also announced for the lease period, varying with beneficiary income and unit size. The central opening is Fund-administered, subsidized rental tenancy for eligible low-income households, with a conditional route to ownership.
Recent Industry Developments in Egypt Residential Real Estate Market
- Oct 2026: Egypt's housing minister said Egypt was finalizing a draft law that would require developers to open separate bank accounts for each project or phase to hold revenues and manage expenses.
- Sep 2026: The New Urban Communities Authority offered 10,000 rent-to-own homes across about 26 new cities, including approximately 5,000 completed units ready for delivery and another approximately 5,000 scheduled for construction over 3 years.
- Aug 2026: IHG Hotels & Resorts and Mountain View for Development and Real Estate Investment signed an agreement for 280 planned Hotel Indigo branded residences at Ras El Hekma on Egypt's North Coast.
Egypt Residential Real Estate Market Report Scope and Research Methodology
Market Definition and Coverage
Egypt residential real estate market measures the annual value of residential property sales and rental spending in Egypt. It covers homes sold or rented for residential use, including new-build purchases and existing-home resales, with sales valued at transaction prices and rentals at rent paid during the year.
Scope exclusions: Pure commercial real estate, non-residential construction activity, land-only transactions, residential construction contracts and material sales, and residential property transactions outside Egypt are excluded.
Segments Covered in This Report
- By Business Model
- Sales
- Rental
Data Sources, Market Sizing, and Validation
Desk Research
The study uses sources such as the World Bank's Egypt urban-population series for demand context, the Financial Regulatory Authority's mortgage-finance statistics for buyer financing conditions, the Ministry of International Cooperation's housing-plan targets to assess public supply, and the Official Egyptian Real Estate Platform's market reporting for developer sales, unit prices and rental yields. Each indicator is applied only to the activity it measures.
Company filings, investor presentations and reputable Egyptian business press can supplement project delivery, sales, pricing and rental evidence, while developer disclosures and public housing plans help cross-check geography and housing type. These sources are illustrative rather than exhaustive, and further sources inform collection, validation and clarification.
Primary Interviews and Surveys
Primary research uses structured interviews and surveys with Egyptian residential developers, brokers, property managers, mortgage-finance providers and housing-policy specialists, including executives and functional leads responsible for sales, leasing, research and project delivery. Questions test secondary findings on transaction and rental activity, pricing, payment plans, occupancy, geography and housing type, and ask respondents to distinguish observed conditions from expectations. Where sources disagree or leave gaps, the analyst records the difference, seeks clarification from relevant Egyptian respondents and triangulates the point against independent public indicators before using it in the estimate.
Distribution of primary research fieldwork respondents
| Company type | Respondent position | Region |
|---|---|---|
| Top tier: 35% | CXOs: 20% | |
| Mid tier: 40% | Functional/Unit leaders: 35% | |
| Smaller Players: 25% | Managers: 45% |
Market-Sizing & Forecasting
The model starts with a top-down estimate of annual residential sales and rent spending across Egypt, then checks selected totals against public housing completions, observed developer sales and sampled transaction prices paired with units sold. Population growth and urban population inform the addressable household base, while new residential completions and public housing targets indicate additions to supply. Developer sales and home-price indicators help track primary and resale transaction value. Mortgage-finance activity and developer payment terms inform purchase affordability, while rental yields and asking-rent evidence help assess rental spending. The analyst uses historical indicators to estimate their relationship with sales and rent activity and applies multivariate regression where a consistent series is available, with scenario analysis for policy, financing or price conditions that may change materially.
Segment shares are built from evidence on property type, price band, primary versus resale sales, business model and governorate, with totals checked against the market estimate. Sales value and rental spending are projected separately so transaction-price changes and rent changes affect the appropriate series. Selective bottom-up checks compare sampled unit counts and prices or observed rents with the top-down result. Where local counts, prices or rental evidence are missing, the analyst uses adjacent public indicators and clearly comparable areas, tests the resulting range, and records the remaining gap for review. Egyptian sector experts can challenge the variable assumptions, local timing and forecast direction, after which the analyst reconciles differences against the source evidence.
Data Validation & Update Cycle
Analysts triangulate official housing and demographic series with developer disclosures, property-market indicators and financing data, then check the sales and rental estimates against independent supply, price and rent signals. They flag unexpected changes, reconcile unit, currency, period and coverage differences, document the explanation and review material variances through successive analyst checks before sign-off. A material unexplained movement or conflicting source triggers follow-up with the source or a relevant Egyptian respondent. The model is refreshed annually, reassessed between cycles when material policy, currency, financing or supply events occur, and given a fresh pre-delivery review.
Mordor Intelligence's Egypt Residential Real Estate Market Size Compared With Other Published Estimates
Published estimates can differ in the transactions and products they count and the inputs used to model demand. Egypt residential real estate market measures the annual value of residential property sales and rental spending in Egypt.
Key Gap Drivers include the study's defined coverage and market-specific modeling choices. The analyst uses historical indicators to estimate their relationship with sales and rent activity and applies multivariate regression where a consistent series is available, with scenario analysis for policy, financing or price conditions that may change materially.
Benchmark comparison
| Source | Market Size | Gaps in Research Methodology |
|---|---|---|
| Mordor Intelligence | USD 11.68 B (2027) | |
| Regional Consultancy A | USD 19.02 B (2024) | At its 2024 base, this estimate is 62.8% above this report's 2027 value of USD 11.68 B, 3 years later. The estimate includes residential development and management activity and vacation homes, broader activity coverage that can raise its reported total. |
| Global Market Data Publisher B | USD 1.19 T (2026) | At its 2026 base, this estimate is 10088.4% above this report's 2027 value of USD 11.68 B, 1 year later. Its residential market-volume measure extends beyond annual sale-price and rent-paid flows to property market value. |
Mordor Intelligence's analysts triangulate official housing and demographic series with developer disclosures, property-market indicators and financing data, then check the sales and rental estimates against independent supply, price and rent signals.
Key Questions Answered in the Report
What is the Egypt residential real estate market size and growth outlook?
The market is projected at USD 11.68 billion in 2027 and USD 18.28 billion in 2032, with a CAGR of 9.37% from 2027 to 2032.
What supports demand for residential housing in Egypt?
Urban population growth, housing programs, and mortgage finance support demand. Mortgage-finance companies had financed about 115,000 clients by end-2025.
Which business model leads residential real estate in Egypt?
Sales held 68.9% of the sector's value in 2026, while rental is projected to grow at a CAGR of 10% from 2027 to 2032.
Which companies compete in Egyptian residential development?
Orascom Development, Palm Hills Developments, Emaar Misr, Talaat Moustafa Group (TMG), and SODIC are major participants.
What is a major challenge for Egyptian housing developers?
Al Ahly Sabbour chairman Ahmed Sabbour reported construction costs per square meter at its North Coast projects rising around 20% to 25% in the 12 months to August 2026.
Which location leads Egypt's residential property sector?
Cairo held 44.6% of the sector's value in 2026 and is projected to grow at a CAGR of 11.05% from 2027 to 2032, the fastest geography.