Market Overview
| Study Period | 2020 - 2031 |
|---|---|
| Base Year For Estimation | 2025 |
| Forecast Data Period | 2026 - 2031 |
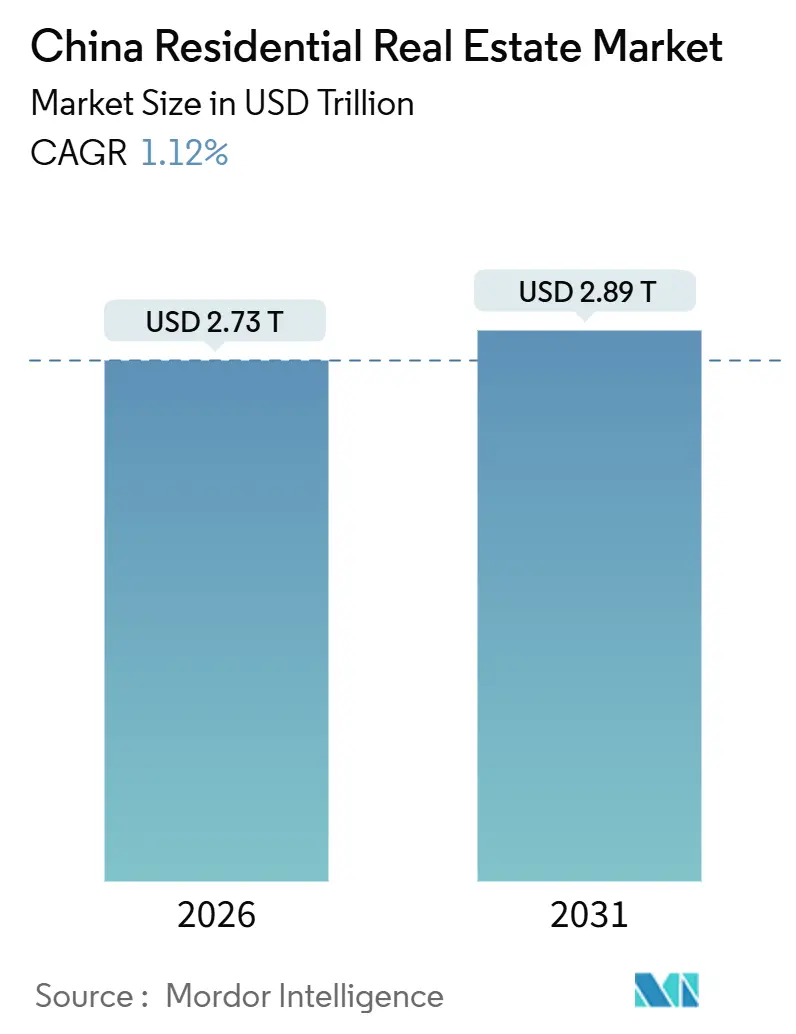
| Market Size (2026) | USD 2.73 Trillion |
| Market Size (2031) | USD 2.89 Trillion |
| Growth Rate (2026 - 2031) | 1.12% CAGR |
| Market Concentration | Medium |
Major Players *Disclaimer: Major Players sorted in no particular order Image © Mordor Intelligence. Reuse requires attribution under CC BY 4.0. | |
China Residential Real Estate Market Analysis by Mordor Intelligence
The China Residential Real Estate Market size is estimated at USD 2.73 trillion in 2026, and is expected to reach USD 2.89 trillion by 2031, at a CAGR of 1.12% during the forecast period (2026-2031). Subdued momentum stems from demographic headwinds, persistent developer distress, and a deliberate shift in policy from supply-side bailouts to household support. Yet the Chinese residential real estate market continues to draw selective demand in tier-one cities where limited land and deep labor pools harden price floors. Monetary easing, including the October 2024 cut that lowered the five-year Loan Prime Rate to 3.6%, has trimmed borrowing costs, but buyer confidence recovers only where project delivery risk is low[1]National Bureau of Statistics, “Statistical Communiqué on National Economic and Social Development,” stats.gov.cn . Institutional landlords add fresh liquidity by acquiring distressed stock for conversion to rentals, and green-certified projects now earn carbon-credit revenue that cushions margin compression.
Key Report Takeaways
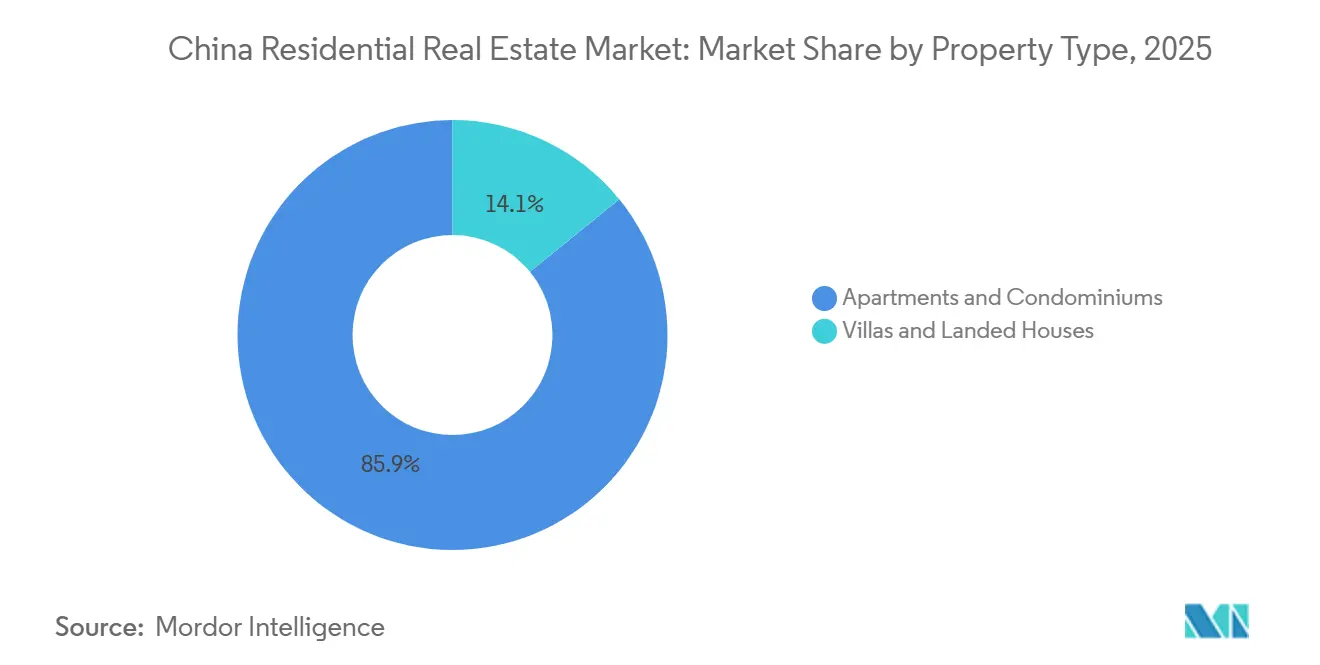
- By property type, apartments and condominiums held 85.88% of the China residential real estate market share in 2025.
- By price band, luxury homes are projected to expand at a 1.37% CAGR through 2031.
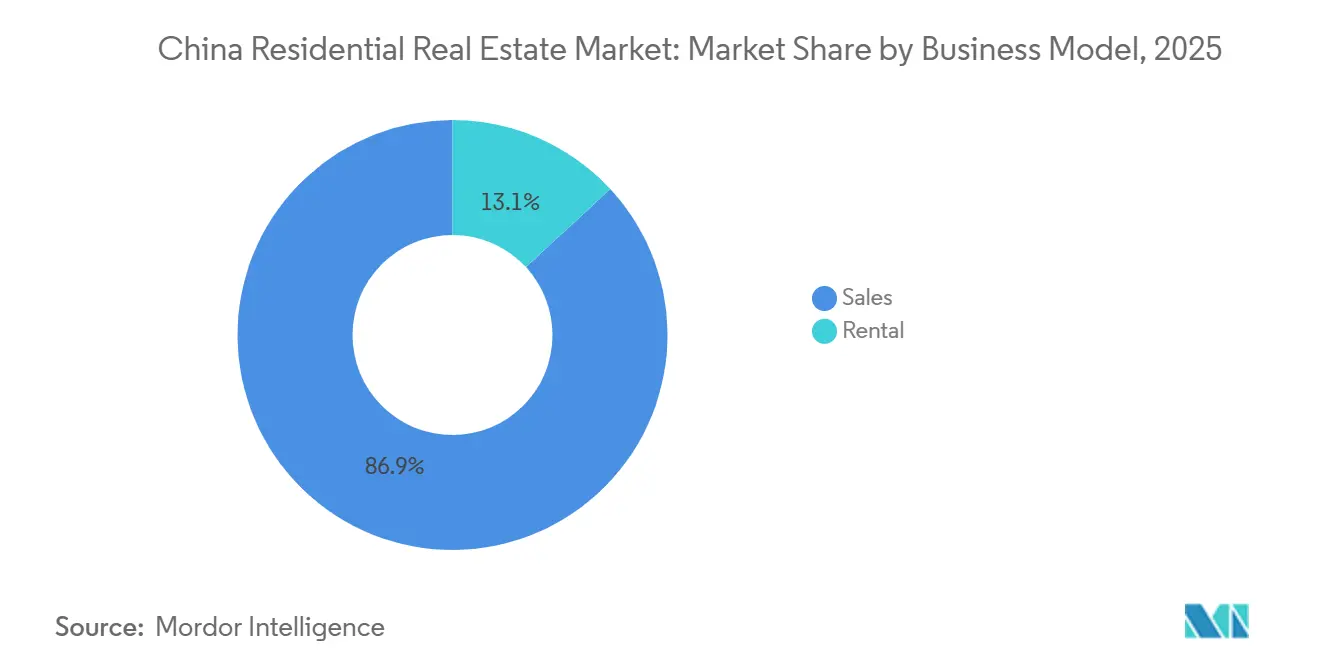
- By business model, sales transactions commanded 86.88% share of the China residential real estate market size in 2025.
- By mode of sale, secondary transactions will grow at a 1.43% CAGR between 2026 and 2031.
- By geography, Guangzhou is expected to post the fastest 1.44% CAGR through 2031.
Note: Market size and forecast figures in this report are generated using Mordor Intelligence’s proprietary estimation framework, updated with the latest available data and insights as of January 2026.
China Residential Real Estate Market Trends and Insights
Drivers Impact Analysis
| Driver | ( ~ ) % Impact on CAGR Forecast | Geographic Relevance | Impact Timeline |
|---|---|---|---|
| PBOC mortgage-rate floor easing | +0.3% | Beijing, Shanghai, Shenzhen, Guangzhou | Short term (≤ 2 years) |
| Housing Provident Fund expansion to gig-economy workers | +0.2% | National, early gains in Shenzhen, Hangzhou, Shanghai | Medium term (2-4 years) |
| Retirement-community projects with healthcare services | +0.1% | Shanghai, Beijing, Chengdu, Hangzhou | Long term (≥ 4 years) |
| AI-powered property-valuation platforms | +0.1% | Tier-one and tier-two cities | Medium term (2-4 years) |
| Cross-border e-CNY mortgage products | +0.1% | Greater Bay Area | Medium term (2-4 years) |
| Carbon-credit incentives for green-certified projects | +0.1% | Shanghai, Beijing, Shenzhen | Long term (≥ 4 years) |
| Source: Mordor Intelligence | |||
Understand The Key Trends Shaping This Market
Download PDF
PBOC Mortgage-Rate Floor Easing Stimulates Tier-One Demand
Lower mortgage-rate floors in Beijing, Shanghai, Shenzhen, and Guangzhou reduce monthly repayments, freeing disposable income for down payments. The October 2024 60-basis-point cut alone saved about USD 21.1 billion a year for 50 million households, yet many buyers still hesitate until delivery certainty improves[2]Reuters Staff, “China Cuts Key Policy Rate by Record Margin,” reuters.com. City officials also trimmed first-home down-payment ratios to 20%, targeting young professionals. The measure steadies, rather than revives, sales volumes. Developers with on-time completion records benefit most, while weaker peers see limited relief. Overall, the initiative shores up the China residential real estate market without reigniting speculative frenzies.
Housing Provident Fund Expansion Broadens Buyer Base
Pilot programs in Shenzhen, Hangzhou, and Shanghai now let gig-economy workers access subsidized loans at rates near 2.85%. China’s gig cohort tops 200 million, so even a 10% uptake could add 20 million future buyers. Early data show a 15% rise in new accounts in Shenzhen during Q1 2025, though many wait to convert savings into purchases. Lenders must adapt credit models to variable incomes, and developers may introduce phased payment plans. The reform enlarges the pipeline of first-time buyers, supporting the long-run depth of the Chinese residential real estate market.
Retirement-Community Projects Drive Senior-Living Pre-Sales
State Council guidelines released in 2024 promote age-friendly compounds with on-site clinics and smart health devices. Developers such as Vanke and Longfor now pre-sell units bundled with priority medical access. China’s 65+ population will exceed 300 million by 2030, and retirees with savings appreciate predictable services. Pre-sales in Shanghai’s first 10 smart elderly-care projects reached 80% of launch inventory within six months. The model delivers steadier cash flows and differentiates supply, reinforcing demand pockets in the Chinese residential real estate market.
AI-Powered Valuation Platforms Shorten Listing-to-Sale Cycles
Machine-learning engines digest transaction histories and neighborhood data to set dynamic prices, cutting listing periods in tier-two cities from nine to five months. An IMF study showed these models improved price-forecast accuracy by 12%. Computer-vision inspections further speed mortgage approvals by limiting manual appraisals. Faster turnover aids distressed developers liquidating stock, while buyers gain confidence from transparent pricing. PropTech adoption, therefore, adds incremental liquidity to the Chinese residential real estate market.
Restraints Impact Analysis
| Restraint | ( ~ ) % Impact on CAGR Forecast | Geographic Relevance | Impact Timeline |
|---|---|---|---|
| Developer default risks | -0.4% | National, acute in tier-three and tier-four cities | Short term (≤ 2 years) |
| Real-estate-tax pilots | -0.2% | Shanghai, Chongqing, possible expansion to Beijing, Shenzhen | Medium term (2-4 years) |
| 3D-printed modular housing price pressure | -0.1% | Guangdong, Jiangsu, Zhejiang | Long term (≥ 4 years) |
| Energy-efficiency retrofit costs | -0.1% | Beijing, Shanghai, Tianjin | Medium term (2-4 years) |
| Source: Mordor Intelligence | |||
Developer Default Risks Prolong Buyer-Confidence Slump
High-profile collapses Evergrande’s liquidation and Country Garden’s restructuring have shaken faith in pre-sales. Even with escrow safeguards, buyers in smaller cities face handover delays of up to 18 months. Pre-sales supply 70% of developer cash flow, so dwindling deposits starve land acquisition budgets. State-owned giants with investment-grade ratings still raise funds, accelerating consolidation. Until delivery track records improve, this drag will cap near-term growth in the Chinese residential real estate market.
Real-Estate-Tax Pilots Dampen Speculative Demand
Shanghai’s annual levy of 0.4%-0.6% on multiple-unit holdings trims rental yields and nudges investors to sell. Beijing eyes similar rules as land-sale revenue falters. Speculators, who own as much as 30% of stock in tier-one cities, may liquidate, lifting supply in secondary markets. Prices of luxury resales already eased 5% in Shanghai during H1 2025. Broader rollout would temper upside in the China residential real estate market while supporting long-run affordability.
Segment Analysis
By Property Type: Apartments Retain Dominance as Villas Gain Niche Traction
Apartments and condominiums accounted for 85.88% of transaction value in 2025, underscoring the high-density template that Chinese planning authorities favor for land-scarce cores. Demand clusters near subway nodes, business parks, and school districts, sustaining thin vacancy even amid wider softness. Shanghai’s strict land-auction quotas kept new apartment launches below 50 plots in 2024, preserving structural tightness. The villa and landed-house niche, though only 14.12% in 2025, will grow at a 1.36% CAGR to 2031, outperforming overall China residential real estate market expansion as affluent buyers seek space and privacy. Prefabricated construction slashes on-site labor by 25%, enabling quicker villa delivery[3]MDPI Editors, “Modular Design and Prefabricated Construction in Residential Buildings,” mdpi.com.
Despite elevated ticket sizes, villas align with wealthy households relocating to suburban enclaves linked by high-speed rail. Beijing approved just 12 villa projects in 2024, forcing buyers to bid aggressively for the limited supply. Energy-code upgrades push retrofit costs higher for detached homes, yet owners accept premiums for standalone PV systems and smart ventilation. Apartment developers counter by offering rooftop gardens and shared gyms to retain urban buyers. Overall, high-rise stock stays central to the China residential real estate market, while villa launches remain a profitable, capacity-constrained sub-story.
Note: Segment shares of all individual segments available upon report purchase
Get Detailed Market Forecasts at the Most Granular Levels
Download PDF
By Price Band: Mid-Market Resilience Anchors Volume, Luxury Lifts Margins
Mid-market units held 49.88% of total value in 2025, supported by first-time buyers using Housing Provident Fund loans with down payments as low as 20%. Projects near public schools and hospitals sell briskly even during downturns. Developers compete on efficient floor plans and bundled furniture packages rather than opulence, ensuring fast absorption. Luxury homes, just 12% of sales in 2025, will clock a 1.37% CAGR through 2031, ahead of the headline China residential real estate market. Cross-border e-CNY mortgages let Hong Kong residents acquire prime Shenzhen condominiums, while mainland millionaires consolidate wealth in trophy assets.
Longfor earned an AA ESG rating in 2025 and leverages that badge to price luxury units at 15% premiums. The affordable-housing slice remains a policy mandate with capped pricing; units enter lotteries within days of release but deliver thin profit margins, prompting developers to treat them as land-bank obligations. The divergence means companies often fund affordable sites with income from high-end towers. Pricing polarity will deepen as tax pilots curb speculation, shaping a barbell profile within the China residential real estate market.
By Business Model: Sales Prevail, Yet Institutional Rentals Accelerate
Sales transactions held an 86.88% share in 2025, mirroring cultural bias toward ownership and developer reliance on pre-sales for funding. Still, rentals will log a 1.42% CAGR to 2031, doubling the overall China residential real estate market pace as city governments grant tax holidays to institutional landlords. China Merchants Shekou’s K11 ECOAST in Shenzhen set aside 30% of its 228,500 square meters for long leases, signaling a pivot to recurring cash flows.
Rental yields in Shanghai averaged 2.5% in 2025, below mortgage rates, deterring mom-and-pop landlords but suiting insurance funds that prize stable coupons. Younger workers in the platform economy value mobility over equity accumulation, boosting demand for branded co-living blocks with communal kitchens. Developers still favor sales in smaller cities where credit tapers ease and buyer sentiment rebounds first. Going forward, a hybrid revenue mix will underpin resilience across the China residential real estate market.
Note: Segment shares of all individual segments available upon report purchase
Get Detailed Market Forecasts at the Most Granular Levels
Download PDF
By Mode of Sale: Secondary Market Rises on Delivery Certainty
Primary sales supplied 67.88% of volume in 2025, yet fear of incomplete handovers nudges households toward finished units. Secondary deals are projected to advance at 1.43% CAGR to 2031, above the headline China residential real estate market, as buyers accept older layouts in exchange for immediate move-in. In first-tier cities, resale prices fell less than new-build values during H1 2025, highlighting trust premiums.
Developers experiment with “build-to-finish” pipelines, offering completed stock before collecting final payments, exemplified by China Overseas Land & Investment’s East Jianguo Road project that generated USD 5.45 billion equivalent in 2024. While this model attracts cautious buyers, it stretches balance sheets, reinforcing consolidation towards well-capitalized firms. In lower-tier cities, abundant vacant land keeps pre-sale culture alive, but secondary momentum suggests gradual diversification across the Chinese residential real estate market.
Geography Analysis
Shanghai exemplifies scarcity-driven resilience. The city issued fewer than 50 residential land parcels in 2024, down 29% year-on-year, keeping new supply tight. Its Green Building mandate forces all upcoming projects to meet two-star energy standards, raising construction costs but also enhancing resale appeal. Average household earnings that often exceed USD 30,000 place many families within mortgage qualification despite higher down-payment thresholds. Consequently, Shanghai underpins floor pricing across the China residential real estate market.
Guangzhou gains from manufacturing expansion in new-energy vehicles and consumer electronics, creating steady employment that converts into housing demand. Down-payment ratios remain 5-10 percentage points lower than those in Beijing and Shanghai, broadening access for young workers. Rail upgrades linking Guangzhou with Shenzhen trim commute times, encouraging cross-city living arrangements. This infrastructure tailwind supports the fastest city-level growth rate recorded in the China residential real estate market forecast.
Conversely, Beijing tightened second-home leverage to 50% LTV during 2025, curbing speculative layering. Hangzhou, Chengdu, and Wuhan grapple with oversized 2016-2020 land banks that now take two years to absorb at current sales tempo. Local governments run targeted voucher schemes to shrink backlog, yet developers often delay bidding at auctions until price floors stabilize. These regional contrasts confirm that recovery in the China residential real estate market will hinge on localized policy and industry capacity to match supply with realistic end-user budgets.
Competitive Landscape
Consolidation advanced as the top 10 developers captured close to 40% of contracted sales in 2025. State-owned leaders, China Overseas Land & Investment, Poly Developments, and China State Construction Engineering, enjoy quasigovernmental credit lines that keep borrowing costs under 4%. China Overseas Land & Investment notched USD 43.8 billion in 2024 sales and earned an S&P upgrade to A-/Stable, evidencing balance-sheet credibility. Private peers such as Longfor and Seazen focus on turnover speed and ESG ratings to differentiate.
Strategically, SOEs absorb distressed land in tier-one markets despite slim margins, aiming to fulfill policy mandates and preserve urban influence. Private survivors retreat to tier-two cities where entry bids are lower and regulatory glare softer. Rental portfolios aimed at gig workers emerge as a shared opportunity, with Vanke pledging 50,000 long-term rental units by 2027. Senior-living projects embedded with clinics add another profit pool, particularly for developers partnering with healthcare operators. These adjacencies broaden revenue mixes across the Chinese residential real estate market.
Technology uptake separates leaders from laggards. AI valuation and prefabricated modules shave months off cycles for firms that own in-house factories, documented by a Tsinghua University yearbook that shows 30% time savings. Capital-light competitors lacking such infrastructure must outsource, eroding margin. As financing windows stay narrow, only firms with scale or niche specialization will thrive, pointing to further shake-outs in the China residential real estate market.
China Residential Real Estate Industry Leaders
China Vanke Co., Ltd.
Sunac China Holdings Limited
Country Garden Holdings Co., Ltd
China State Construction Engineering Corp. Ltd
China Overseas Land & Investment Ltd
- *Disclaimer: Major Players sorted in no particular order
Need More Details on Market Players and Competitors?
Download PDF
Recent Industry Developments
- January 2025: Country Garden proposed a USD 1.55 billion offshore restructuring deal to address USD 11 billion in obligations, marking a lifeline for China’s second-largest private developer.
- March 2025: China Overseas Land & Investment posted USD 26.1 billion revenue and secured an S&P upgrade, signaling creditor confidence even as the broader China residential real estate market slowed.
- November 2025: China Vanke pledged its 57.16% Onewo stake to Shenzhen Metro, unlocking USD 4.2 billion liquidity equivalent to meet near-term maturities.
- December 2024: China Merchants Shekou opened the K11 ECOAST district in Shenzhen, dedicating 30% of residences to rentals as part of an asset-light pivot.
Research Methodology Framework and Report Scope
Market Definitions and Key Coverage
Mordor Intelligence defines China's residential real estate market as the cumulative monetary value of all privately owned housing units, new builds and existing homes, traded or held for living purposes across mainland China. The study counts primary transactions, secondary resales, and the standing rental stock, valuing each through observed transaction prices or modeled fair market estimates in constant 2024 dollars.
Scope Exclusion: commercial mixed-use floors that generate more than half their income from non-residential tenants are left out.
Segmentation Overview
- By Property Type
- Apartments & Condominiums
- Villas & Landed Houses
- By Price Band
- Affordable
- Mid-Market
- Luxury
- By Business Model
- Sales
- Rental
- By Mode of Sale
- Primary (New-Build)
- Secondary (Existing Home Resale)
- By Geography
- Shenzhen
- Beijing
- Shanghai
- Hangzhou
- Guangzhou
- Other Key Cities
Detailed Research Methodology and Data Validation
Primary Research
We interviewed developers, broker chains, bank credit officers, and municipal planners in various provincial capitals plus Hong Kong. Conversations clarified discounting trends, cash-flow assumptions, and inventory disposition plans, letting us adjust initial desk estimates and validate sentiment shifts that raw statistics lag.
Desk Research
Our analysts scraped multi-year series from tier-one sources such as the National Bureau of Statistics, People's Bank mortgage rate releases, Ministry of Housing and Urban-Rural Development land transfer bulletins, and China Index Academy city-level price monitors. Supplemental insight was drawn from company filings, provincial housing provident fund reports, and news flows retrieved through Dow Jones Factiva and D&B Hoovers. These secondary inputs built the historical backbone; many additional public and subscription sources were consulted beyond the illustrative list above.
Market-Sizing and Forecasting
A top-down build pulls national floor space sold, average selling price, and rental stock value to reconstruct 2024 spend, which is then benchmarked with selective bottom-up checks, sampled developer revenue roll-ups and city agent channel checks. Key variables include mortgage rate spreads, urbanization ratio, household formation, cash-to-GDP share, and Tier-1 secondary turnover, all forecast through multivariate regression with scenario overlays when policy shocks emerge. Gaps where bottom-up evidence is thin are bridged using weighted city proxies and prudently capped price assumptions.
Data Validation and Update Cycle
Outputs run through variance screens against independent indicators, loan balances, land premium trends, and housing provident fund withdrawals, before a senior analyst review. The model refreshes every twelve months, with interim updates triggered by rate resets, large rescue packages, or unanticipated regulatory shifts.
Why Our China Residential Real Estate Baseline Commands Reliability
Published estimates often diverge because firms mix transaction value with asset stock, track different city tiers, or freeze exchange rates at outdated parities.
Key gap drivers include narrower geographic scopes, omission of rental assets, heavy reliance on unvetted developer guidance, and infrequent refresh cadences that miss policy pivots and the recent surge in secondary sales within Guangzhou and Shenzhen.
Benchmark comparison
| Market Size | Anonymized source | Primary gap driver |
|---|---|---|
| USD 2.76 trillion (2025) | Mordor Intelligence | - |
| USD 1.10 trillion (2024) | Regional Consultancy A | Focuses on primary sales only; excludes rental stock and lower-tier cities |
| USD 649.22 billion (2024) | Industry Journal B | Captures developer cash receipts; omits household resales and inventory valuation |
| USD 682.5 billion (2024) | Global Consultancy C | Derives residential slice from broader real estate dataset and double counts mixed-use projects while ignoring vacant units |
Taken together, the comparison shows that Mordor's disciplined scope selection, blended top-down plus bottom-up validation, and annual refresh cycle provide decision makers with a balanced, transparent baseline they can trace back to clear variables and repeat on their own.
Need A Different Region or Segment?
Customize Now
Key Questions Answered in the Report
How big is the China residential real estate market in 2026?
The China residential real estate market size reached USD 2,732.68 billion in 2026, with a projected value of USD 2,889.18 billion by 2031.
Which city is expected to grow fastest through 2031?
Guangzhou is forecast to lead with a 1.44% CAGR, driven by manufacturing job creation and relatively relaxed purchase restrictions.
Why do buyers favor secondary homes now?
Completed properties eliminate delivery risk, and secondary prices fell less than new-build values in 2025, giving buyers immediate occupancy and better price stability.
What drives growth in luxury housing?
Wealth concentration and new cross-border digital-yuan mortgages for Hong Kong residents lift demand for high-end units, supporting a 1.37% CAGR through 2031.
How are developers adapting to lower sales volumes?
Firms with strong balance sheets pivot to rental housing, senior-living projects, and carbon-credit-eligible green buildings to diversify income.


