Market Overview
| Study Period | 2020 - 2031 |
|---|---|
| Forecast Data Period | 2026 - 2031 |
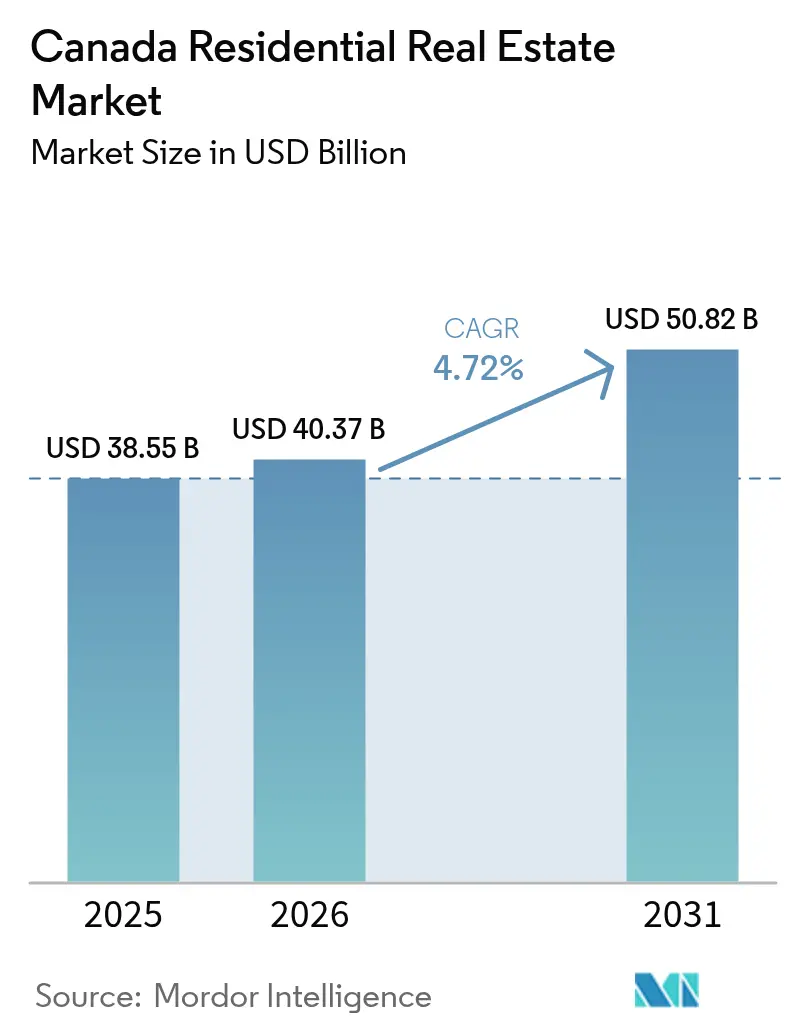
| Base Year Market Size (2025) | USD 38.55 Billion |
| Market Size (2026) | USD 40.37 Billion |
| Market Size (2031) | USD 50.82 Billion |
| Growth Rate (2026 - 2031) | 4.72% CAGR |
| Market Concentration | Medium |
Major Players *Disclaimer: Major Players sorted in no particular order Image © Mordor Intelligence. Reuse requires attribution under CC BY 4.0. | |
Canada Residential Real Estate Market Analysis by Mordor Intelligence
Canada residential real estate market size in 2026 is estimated at USD 40.37 billion, growing from 2025 value of USD 38.55 billion with 2031 projections showing USD 50.82 billion, growing at 4.72% CAGR over 2026-2031. A surge in immigration, combined with funding that favors purpose-built rental developments, is lifting demand faster than new supply in several provinces. Technology-led construction methods such as modular and mass-timber mid-rises are shortening build times, while institutional investors channel more capital into rental formats to secure steady cash flows. Alberta is capturing migrants priced out of Ontario and British Columbia, and regulatory changes—chiefly possible adjustments to the mortgage stress test—could widen mortgage access and revive purchase activity. Ongoing cost inflation in materials, labor, and insurance tempers near-term profits, yet large players are countering through scale efficiencies and digital property-management tools.
Key Report Takeaways
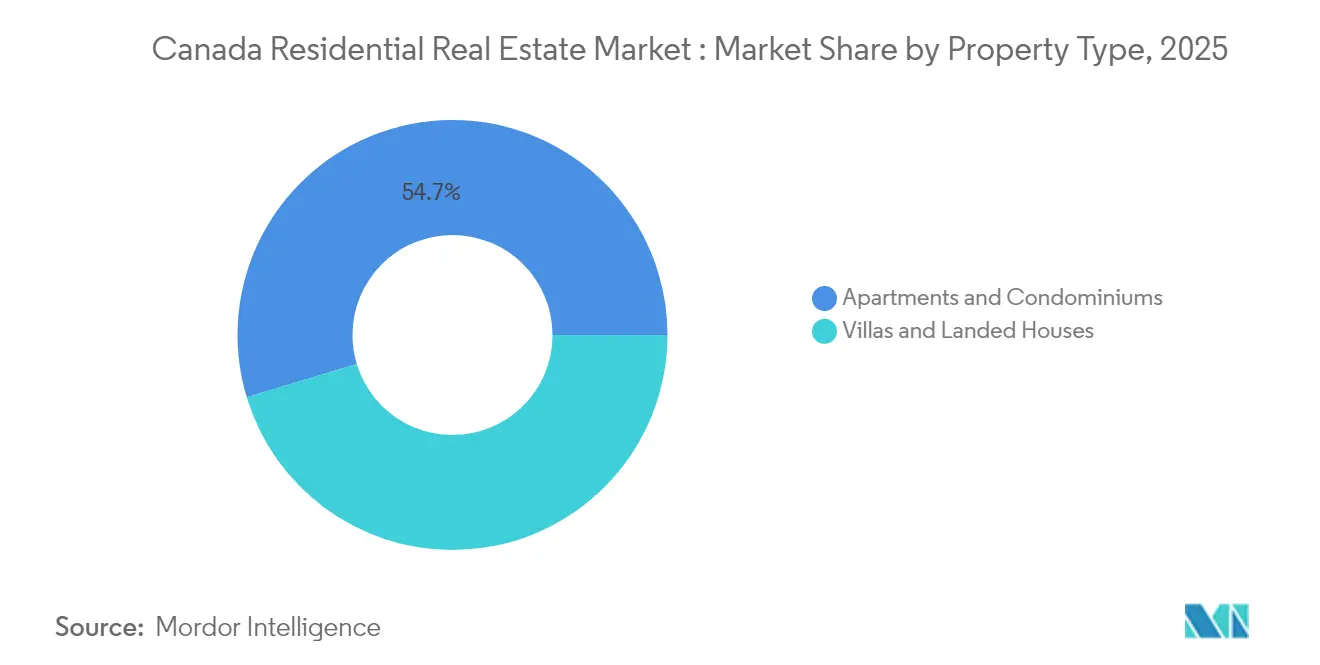
- By property type, apartments and condominiums led with a 54.68% revenue share of the Canada residential real estate market in 2025; apartments and condominiums recorded the fastest growth at a 4.93% CAGR through 2031.
- By price band, mid-market assets held 51.34% of the Canada residential real estate market share in 2025, while the affordable segment is projected to expand at 5.02% CAGR to 2031.
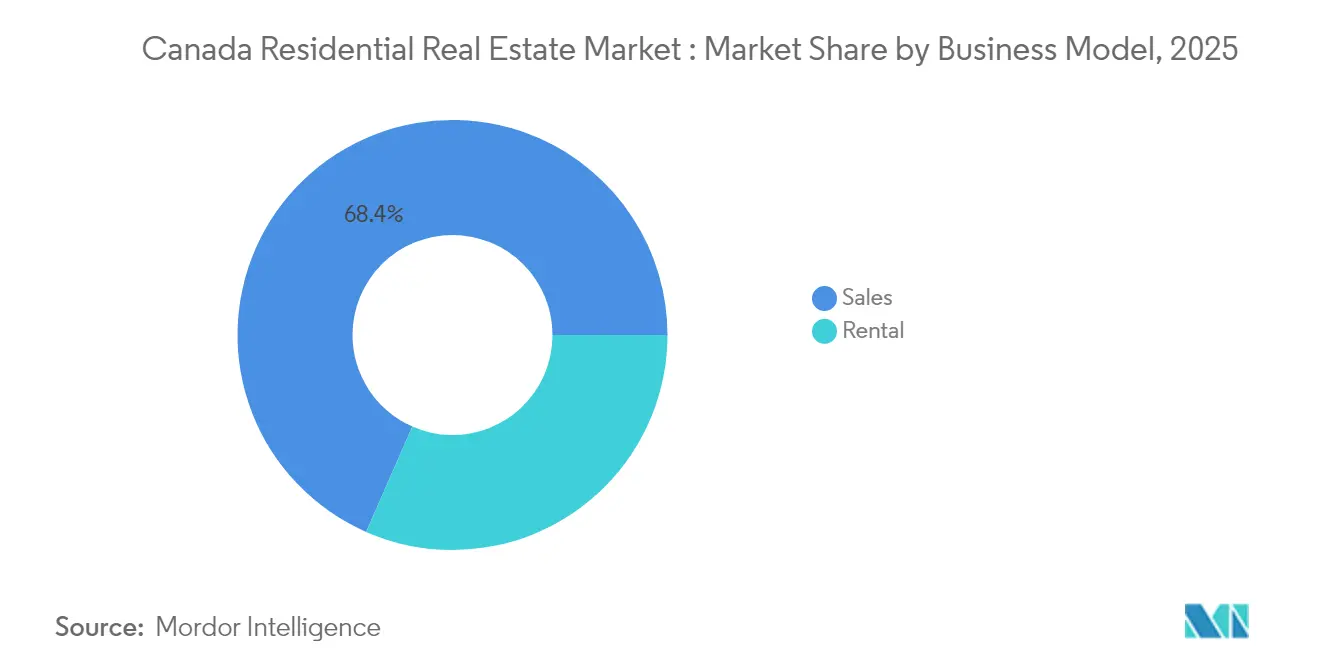
- By business model, sales transactions captured 68.42% of the Canada residential real estate market size in 2025; the rental model shows the highest momentum with a 5.08% CAGR forecast through 2031.
- By mode of sale, the secondary market accounted for 71.35% of the Canada residential real estate market in 2025, whereas primary new-build sales are set to climb at 4.95% CAGR.
- By province, Ontario commanded 35.58% of the Canada residential real estate market size in 2025; Alberta is the fastest-growing province at 5.08% CAGR through 2031.
Note: Market size and forecast figures in this report are generated using Mordor Intelligence’s proprietary estimation framework, updated with the latest available data and insights as of 2026.
Canada Residential Real Estate Market Trends and Insights
Drivers Impact Analysis*
| Driver | (~) % Impact on CAGR Forecast | Geographic Relevance | Impact Timeline |
|---|---|---|---|
| Immigration-fuelled household formation outpacing supply | +1.2% | Ontario & British Columbia; spillover to Alberta | Medium term (2-4 years) |
| Federal and provincial funding for purpose-built rentals | +0.8% | National; largest in major urban centers | Long term (≥4 years) |
| Transit-oriented rezoning unlocking urban landbanks | +0.7% | Ontario & British Columbia | Long term (≥4 years) |
| Modular & mass-timber mid-rises compressing build cycles | +0.6% | National; early uptake in Ontario & BC | Medium term (2-4 years) |
| Institutional shift to single-family rental portfolios | +0.5% | National; focus on growth markets | Long term (≥4 years) |
| CMHC green-financing incentives for net-zero multifamily | +0.4% | National; strongest in environmentally progressive provinces | Medium term (2-4 years) |
| Source: Mordor Intelligence | |||
Immigration-fuelled household formation outpacing supply
Canada’s population crossed 40 million in 2024, and newcomers continue to push annual household formation beyond the current construction pace, especially in Ontario and British Columbia. Intensifying demand spills into Alberta as 18,400 young workers relocated there in 2024, easing—but not eliminating—pressure on traditional gateways. Although recent caps on temporary residents modestly reduce inflows, the federal target of 485,000 permanent residents in 2025 underpins sustained demand. This demographic momentum is reinforcing price upside and attracting institutional equity seeking a hedge against inflation. At the same time, affordability gaps widen, prompting government subsidies aimed at first-time buyers.
Federal and provincial funding for purpose-built rentals
Ottawa’s USD 15 billion Apartment Construction Loan Program and the USD 4.4 billion Housing Accelerator Fund collectively increase capital access and accelerate municipal approvals[1]Canada Mortgage and Housing Corporation, “Housing Accelerator Fund: Program Details,” Canada Mortgage and Housing Corporation, cmhc-schl.gc.ca. Provincial action amplifies results: Quebec’s incentive package boosted rental housing starts 30% in 2024. These supply-side programs move beyond earlier demand-side subsidies, prompting developers to pivot toward long-term rental income over one-time sales. The structural shift is visible in 35% of completions now being purpose-built rentals, the highest ratio since 1992.
Modular & mass-timber mid-rises compressing build cycles
The Build Canada Homes program earmarks USD 25 billion to accelerate factory-built housing, aiming for 500,000 new homes a year. Updated building codes permit 18-storey mass-timber structures, and early adopters in Ontario and British Columbia report 50% faster build times and 20% cost savings relative to concrete alternatives. Beyond speed, prefabrication addresses labor constraints and lowers embodied carbon, positioning modular projects for preferential green-finance rates from CMHC.
Institutional shift to single-family rental portfolios
Blackstone Real Estate’s privatization of Tricon Residential underscores growing appetite for single-family rentals triconresidential.com. Purpose-built subdivisions designed for renting are scaling because they balance detached-home demand with unaffordable ownership costs. Pension funds and insurers favor the predictable cash flows and limited turnover risk associated with these assets, often combining them with professionalized management platforms for operational efficiencies.
Restraints Impact Analysis*
| Restraint | (~) % Impact on CAGR Forecast | Geographic Relevance | Impact Timeline |
|---|---|---|---|
| Build-cost inflation from skilled-labor shortages | -0.9% | National; acute in urban cores | Short term (≤2 years) |
| OSFI mortgage stress-test tightening | -0.6% | National; largest in high-priced markets | Medium term (2-4 years) |
| Municipal development-charge escalations (GTA) | -0.3% | Greater Toronto Area | Medium term (2-4 years) |
| Rising insurance premiums on high-rise condos (BC) | -0.1% | British Columbia urban markets | Short term (≤ 2 years) |
| Source: Mordor Intelligence | |||
Build-cost inflation from skilled-labor shortages
Construction costs are 51% above pre-pandemic levels, eroding pro formas and forcing schedule extensions. Retirements outpace apprentice entries, and immigration policies still emphasize knowledge-based talent rather than trades. In response, Ottawa introduced 55-year insured construction loans, but developers in Ontario and British Columbia still cite labor scarcity as their biggest barrier to breaking ground. Alberta benefits from a more mobile workforce that tempers wage spikes, yet national supply chains for steel and glazing remain tight, keeping material costs elevated.
OSFI mortgage stress-test tightening
The regulator continues to enforce the higher of the contract rate plus 2 percentage points or 5.25% as the qualifying rate. While rates began easing in early 2025, the qualifying hurdle still sidelines many first-time buyers. Proposed loan-to-income limits could further restrict lender portfolios, especially in Toronto and Vancouver where average mortgage sizes exceed six times household income. Although OSFI signaled it may lift the test for uninsured mortgages by late 2025, any interim tightening could slow deal velocity and nudge demand toward rentals[2]Office of the Superintendent of Financial Institutions, “Residential Mortgage Underwriting Practices and Procedures,” Office of the Superintendent of Financial Institutions, osfi-bsif.gc.ca.
*Our forecasts treat driver/restraint impacts as directional, not additive. The impact forecasts reflect baseline growth, mix effects, and variable interactions.
Segment Analysis
By Property Type: Apartments and Condominiums led Density Strategy
Apartments command 54.68% of the Canada residential real estate market in 2025 and are forecast to post a 4.93% CAGR to 2031. Developers gravitate to multifamily because CMHC’s insured debt lowers equity requirements, while municipal up-zoning away from single-family exclusivity supports higher-density formats.
Strong institutional appetite anchors this trend. REITs pursue purpose-built rentals that meet ESG mandates and match long-duration liabilities. Modular construction and mass-timber systems shorten delivery cycles, partially offsetting land-price inflation in core markets. Detached-home builders concentrate on outlying suburbs where land costs remain manageable, but the value proposition rests on commute tolerance and fewer transit options.


By Price Band: Affordable Housing Accelerates
Mid-market units represented 51.34% of the Canada residential real estate market share in 2025, yet affordable housing is projected to be the fastest-growing slice at 5.02% CAGR. Government policy now ties infrastructure grants to municipal progress on affordability, pushing cities to expedite approvals for below-market rents.
Developers secure tax abatements and density bonuses by designating 20%-30% of units as affordable, improving blended project returns. Institutional investors, mindful of social-impact mandates, view affordable housing as a hedge against cyclical downturns because waitlists provide durable occupancy. Luxury products still attract foreign buyers in niche areas, but higher transfer taxes and vacancy levies cap speculative momentum.
By Business Model: Rental Momentum Builds
Sales remained the majority with 68.42% of the Canada residential real estate market in 2025, but rentals will outpace at a 5.08% CAGR. CMHC’s 95% loan-to-cost construction financing slashes equity needs for rental developments, nudging merchant builders to retain completed assets.
Pension funds emphasize stabilized cash flows, and REITs grow via forward-purchase agreements that de-risk developers’ exits. Strong rent growth—nationally 7.4% in 2024—supports coverage ratios even amid cost inflation. Homeownership aspirations are moderating as borrowers struggle to pass stress-test hurdles, redirecting demand toward well-amenitized rental communities.
By Mode of Sale: Primary Market Narrows Inventory Gap
Secondary transactions comprised 71.35% of the Canada residential real estate market in 2025, but primary new-build sales will rise at 4.95% CAGR as first-time buyer programs favor newly completed housing.
Federal policy now permits 30-year insured amortizations for new-construction purchases, reducing monthly payments. Developers leverage advanced marketing platforms and virtual tours to pre-sell units earlier, aiding construction financing. Energy-efficiency codes give new builds an operating-cost edge over older stock, swaying cost-conscious buyers toward the primary market despite higher sticker prices.
Geography Analysis
Ontario accounted for 35.58% of the Canada residential real estate market in 2025. Development charges in the Greater Toronto Area, which average USD 165,000 per condo unit, constrain feasibility and lengthen timelines, pushing some activity to surrounding municipalities. Immigration keeps net household formation high, but affordability challenges sustain the rental surge and suppress the ownership rate.
British Columbia stabilizes after deploying transit-oriented zoning and foreign-buyer taxes. Vancouver’s removal of minimum-parking rules near rapid transit allows denser infill, yet high-rise insurance premiums continue to elevate operating expenses. Mass-timber approvals for 18-storey towers reduce structural costs and carbon footprints, positioning the province as a laboratory for next-generation green development.
Alberta posts the fastest growth at 5.08% CAGR to 2031. Calgary’s benchmark price of USD 591,100 remains accessible relative to Toronto and Vancouver, and provincial budget surpluses fuel infrastructure expansions that entice migrants. Edmonton benefits from a 4.8% population increase in early 2024, translating into stronger absorption of both sales and rentals.
Quebec enjoys renewed momentum as single-family median prices near USD 450,000 keep ownership within reach for local buyers. A streamlined online permit portal launched in 2024 cut average approval times by 30 days, reducing carrying costs. Purpose-built rentals dominate new starts in Montréal as institutional capital targets stable yields backed by long-term leases.
Atlantic Canada and smaller prairie markets experience steady inflows from international graduates and remote workers. Lower entry prices balance thinner job markets, while modest construction pipelines protect against over-supply. However, limited contractor capacity could slow delivery of larger multifamily projects unless provincial training programs scale up the trades workforce.
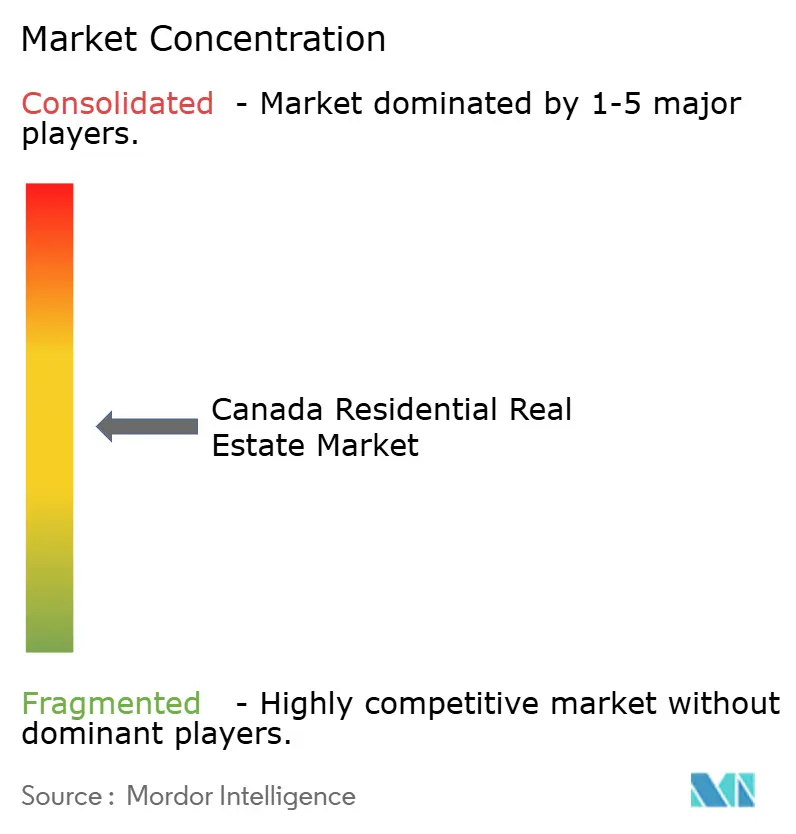
Competitive Landscape
The Canada residential real estate market exhibits moderate fragmentation. The leading players—Brookfield Asset Management, CAPREIT, Tridel Group, First Capital REIT, and Minto Apartment REIT drive the market with their strategic operations. Brookfield skillfully navigates market cycles by utilizing global capital pools to develop master-planned communities that harmoniously integrate office, retail, and rental towers. CAPREIT, on the other hand, emphasizes asset recycling by selling non-core suburban properties and reinvesting the proceeds into new affordable rental projects, supported by CMHC.
Technology is a core differentiator. Tridel deploys off-site modular components to cut 15% from build schedules in the Greater Toronto Area. First Capital uses digital twins for predictive maintenance, extending asset lifespans and optimizing capital-expenditure timing. Minto pilots IoT-enabled energy-management systems that reduce utility costs up to 18%, aligning with tenant ESG preferences.
Consolidation is strengthening buyer power in niche sectors. Forum REIIF’s USD 1.69 billion acquisition of Alignvest Student Housing creates the nation’s largest privately held student portfolio, positioning the group to negotiate bulk service agreements and cross-market leasing rights. Blackstone’s take-private of Tricon Residential signals a bet on single-family rentals’ secular growth. Mid-sized regional developers respond by forming joint ventures to share risk and access cheaper institutional debt.
Canada Residential Real Estate Industry Leaders
Brookfield Asset Management
CAPREIT
Tridel Group
Mattamy Homes
QuadReal Property Group
- *Disclaimer: Major Players sorted in no particular order

Recent Industry Developments
- May 2025: Minto Apartment REIT reported a 5.3% year-over-year rise in average monthly rent and NAV per unit of USD 22.73.
- April 2025: The federal government launched the USD 25 billion Build Canada Homes program to finance factory-built housing.
- March 2025: CAPREIT raised its monthly distribution, underscoring cash-flow resilience.
- February 2025: First Capital REIT posted 4.4% Same Property NOI growth and a 3% distribution increase.


Research Methodology Framework and Report Scope
Market Definitions and Key Coverage
Our study considers the Canadian residential real-estate market as the annual value of new-build and resale dwellings, apartments, condominiums, single-family houses, townhouses, and purpose-built rentals recorded at the final transaction price. Lease revenue is converted to an annualized value, so sales and rental activity sit on one comparable footing. According to Mordor Intelligence, this produced a market size of USD 38.55 billion in 2025.
Scope exclusion: pure land banking, student dormitories, serviced apartments, and commercial mixed-use floors are left outside the calculation.
Segmentation Overview
- By Property Type
- Apartments & Condominiums
- Villas & Landed Houses
- By Price Band
- Affordable
- Mid-Market
- Luxury
- By Mode of Sale
- Primary
- Secondary
- By Business Model
- Sales
- Rental
- By Region (Province)
- Ontario
- Quebec
- British Columbia
- Alberta
- Rest of Canada
Detailed Research Methodology and Data Validation
Primary Research
To bridge data gaps, we interviewed developers, brokerage managers, and mortgage advisors across Ontario, British Columbia, Quebec, Alberta, and Atlantic provinces. Conversations centered on deal velocity, incentive structures, and expected absorption, while an online survey of renters informed vacancy and rent-growth assumptions. The insights confirmed desk findings and guided province-level adjustments.
Desk Research
First, Mordor analysts mapped supply, demand, and pricing signals from open sources such as Statistics Canada building permits and housing starts tables, the Canadian Mortgage and Housing Corporation's completions and vacancy files, Canadian Real Estate Association monthly price indices, and Immigration, Refugees and Citizenship Canada inflow statistics. Lending and stress-test thresholds from the Office of the Superintendent of Financial Institutions and policy rate paths from the Bank of Canada helped us judge affordability swings. Company filings accessed through D&B Hoovers and news archives on Dow Jones Factiva offered developer pipeline and transaction insights. These sources illustrate the evidence base; many additional references were consulted as needed for clarification and cross-checks.
Market-Sizing & Forecasting
A top-down and bottom-up hybrid model underpins the numbers. We began with province-level housing start completions plus resale transactions, multiplied by average selling prices from CREA and MLS feeds, thereby reconstructing annual market value. Bottom-up validation used sampled developer revenues and rental stock roll-ups to fine-tune totals. Key inputs include quarterly housing starts, average resale price, rental vacancy, net immigration, and five-year fixed mortgage rates, each projected through a multivariate regression that captures their combined influence. Scenario analysis stress tested the forecast against rate shocks or slower immigration. Where transaction counts were partial, unit weights were allocated following historical share patterns.
Data Validation & Update Cycle
Model outputs pass two analyst reviews, variance checks against independent metrics, and a re-contact loop with select respondents for anomalies. The report refreshes every twelve months, with off-cycle updates triggered by material policy or rate moves. A final validation sweep occurs just before publication, so clients receive the latest view.
Why Mordor's Canada Residential Real Estate Baseline commands reliability
Published figures often diverge because firms mix asset-stock valuations, different deal types, or outdated exchange rates. Mordor narrows the lens to observable annual transactions, refreshes the file yearly, and anchors prices to verified MLS data, which keeps our baseline steady yet responsive.
Key gap drivers include: some studies fold commercial mixed-use floors into totals, others inflate value by counting cumulative housing stock, and a few rely on broad macro ratios with limited field validation.
Benchmark comparison
| Market Size | Anonymized source | Primary gap driver |
|---|---|---|
| USD 38.55 B (2025) | Mordor Intelligence | - |
| USD 59.3 B (2023) | Industry Information Portal A | Includes land cost and all provinces without transaction-date currency alignment |
| USD 143.2 B (2023) | Regional Consultancy B | Adds commercial mixed-use and applies listing inventory rather than closed deals |
| CAD 1.2 T (2025) | Market Analytics C | Measures full residential asset stock, not annual market turnover |
These comparisons show that once scope creep and valuation method differences are stripped away, Mordor's disciplined, annually refreshed approach delivers a balanced baseline that decision-makers can track and replicate with confidence.


Key Questions Answered in the Report
What is the current Canadian real estate market size?
The market was valued at USD 40.37 billion in 2026 and is projected to reach USD 50.82 billion by 2031.
Which segment is growing fastest within the Canadian real estate market?
Purpose-built rentals lead with a 5.08% CAGR thanks to CMHC loan programs and institutional capital inflows.
Why is Alberta the fastest-growing province?
Housing affordability, job diversification, and net in-migration drive Alberta’s 5.08% CAGR outlook.
What regulatory change could most affect buyers in 2025?
OSFI’s potential removal of the mortgage stress test for uninsured loans may expand borrowing capacity later in 2025.
Page last updated on:


