
Residential Air Purifiers Market Size and Share
Market Overview
| Study Period | 2021 - 2031 |
|---|---|
| Market Size (2026) | USD 12.18 Billion |
| Market Size (2031) | USD 17.62 Billion |
| Growth Rate (2026 - 2031) | 7.68 % |
| Fastest Growing Market | Asia Pacific |
| Largest Market | Asia Pacific |
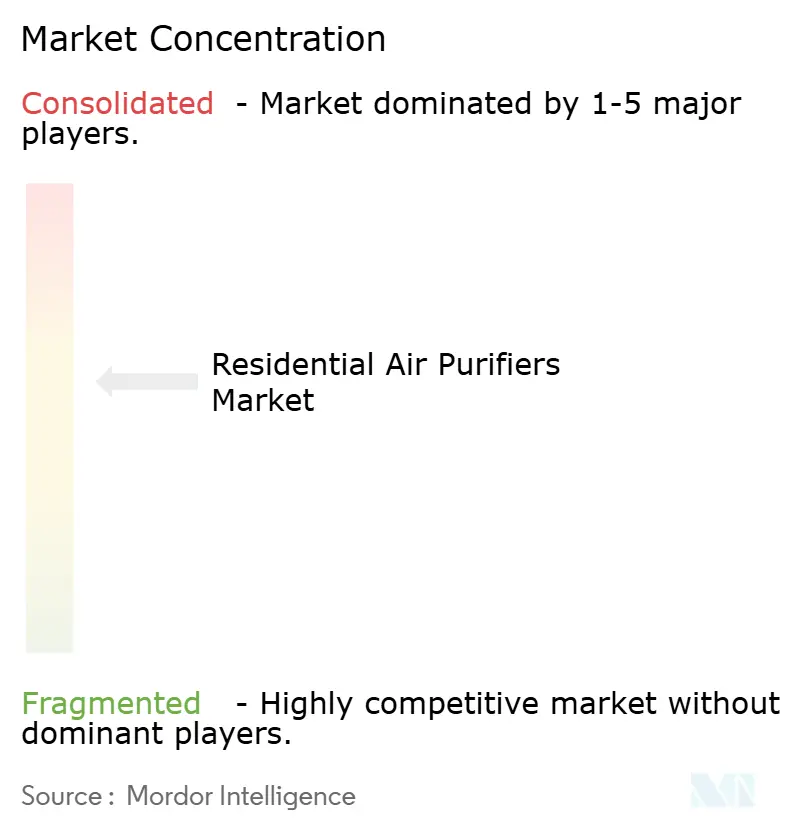
| Market Concentration | Medium |
Major Players *Disclaimer: Major Players sorted in no particular order Image © Mordor Intelligence. Reuse requires attribution under CC BY 4.0. | |
Residential Air Purifiers Market Analysis by Mordor Intelligence
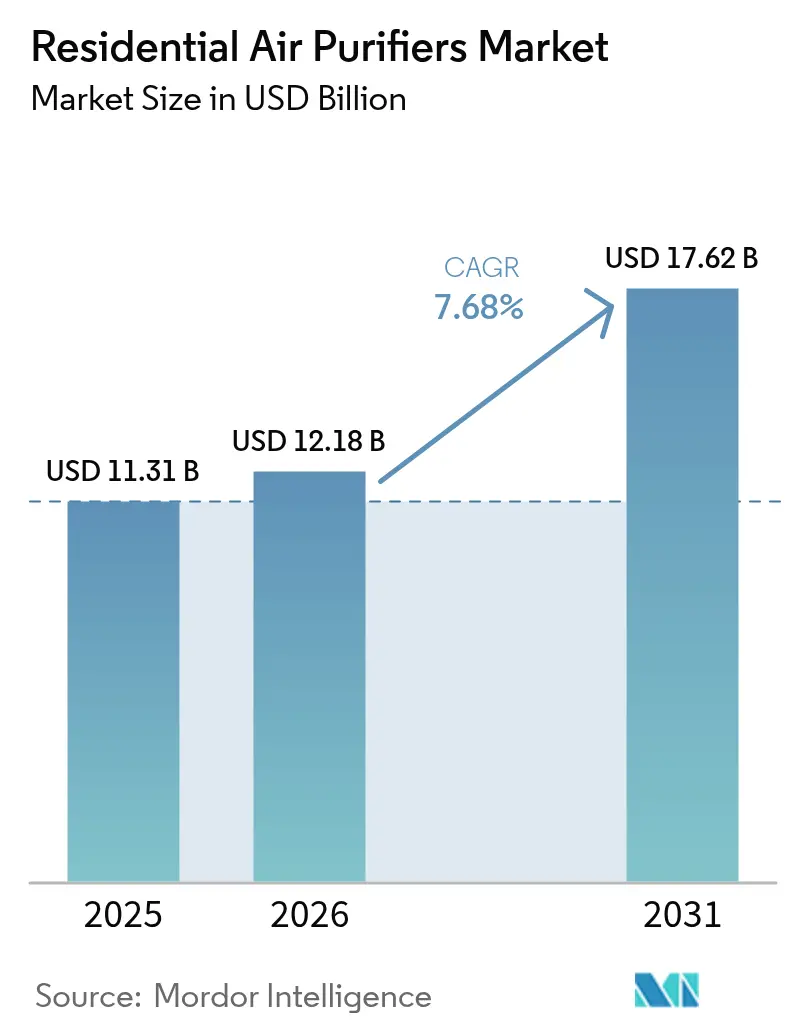
The Residential Air Purifiers Market size is expected to grow from USD 11.31 billion in 2025 to USD 12.18 billion in 2026 and is forecast to reach USD 17.62 billion by 2031 at 7.68% CAGR over 2026-2031.
Consumer concern about indoor pollutants increased significantly after the COVID-19 pandemic, and 53% of homeowners now rank indoor air quality among their top health priorities. Government efficiency rules, such as the U.S. Department of Energy standard that took effect in December 2023, are encouraging manufacturers to adopt lower-power designs. Asia-Pacific drives both volume and growth as chronic urban smog turns air purifiers into everyday appliances. Technology competition is heating up: HEPA remains the benchmark, yet hybrid systems that layer UV-C or carbon filters are gaining favor. Consolidation is underway as appliance giants acquire niche filtration brands to expand their portfolios and generate subscription revenue.
Key Report Takeaways
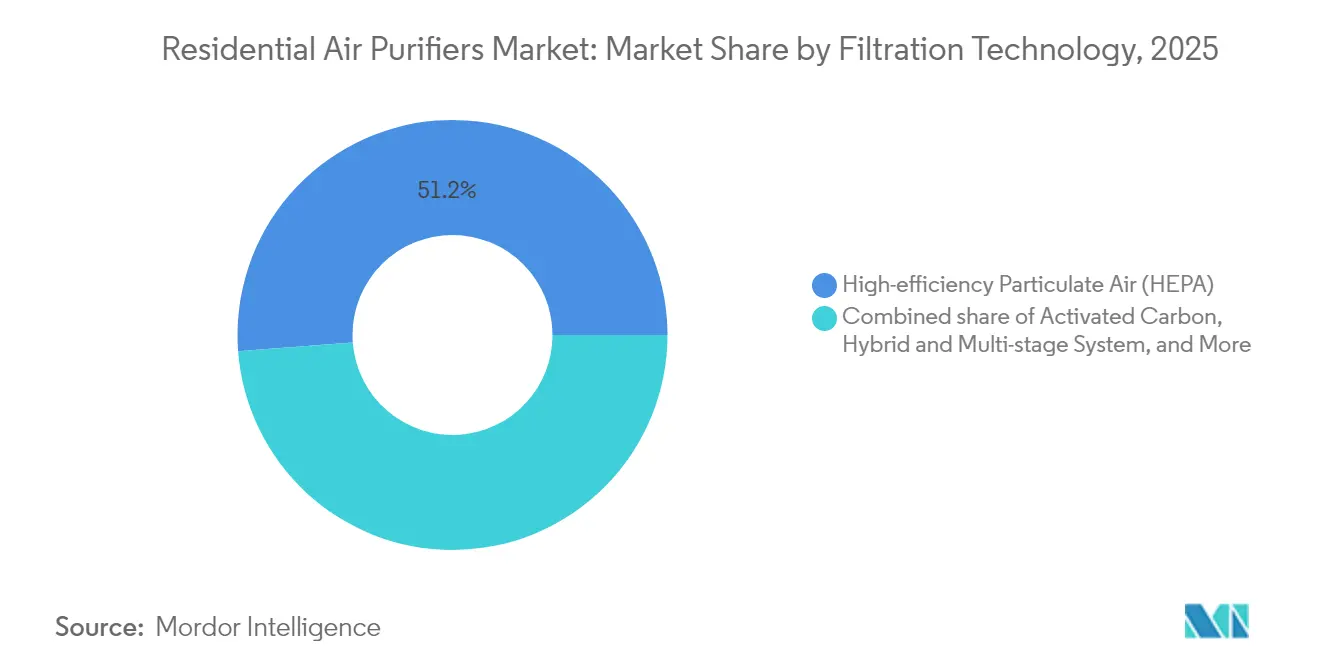
- By filtration Technology, HEPA filtration led with a 51.20% residential air purifiers market share in 2025, while hybrid systems are expected to deliver a 9.05% CAGR through 2031.
- By type, Portable units commanded 86.70% of the residential air purifiers market size in 2025; in-duct solutions are projected to expand at a 10.35% CAGR between 2026-2031.
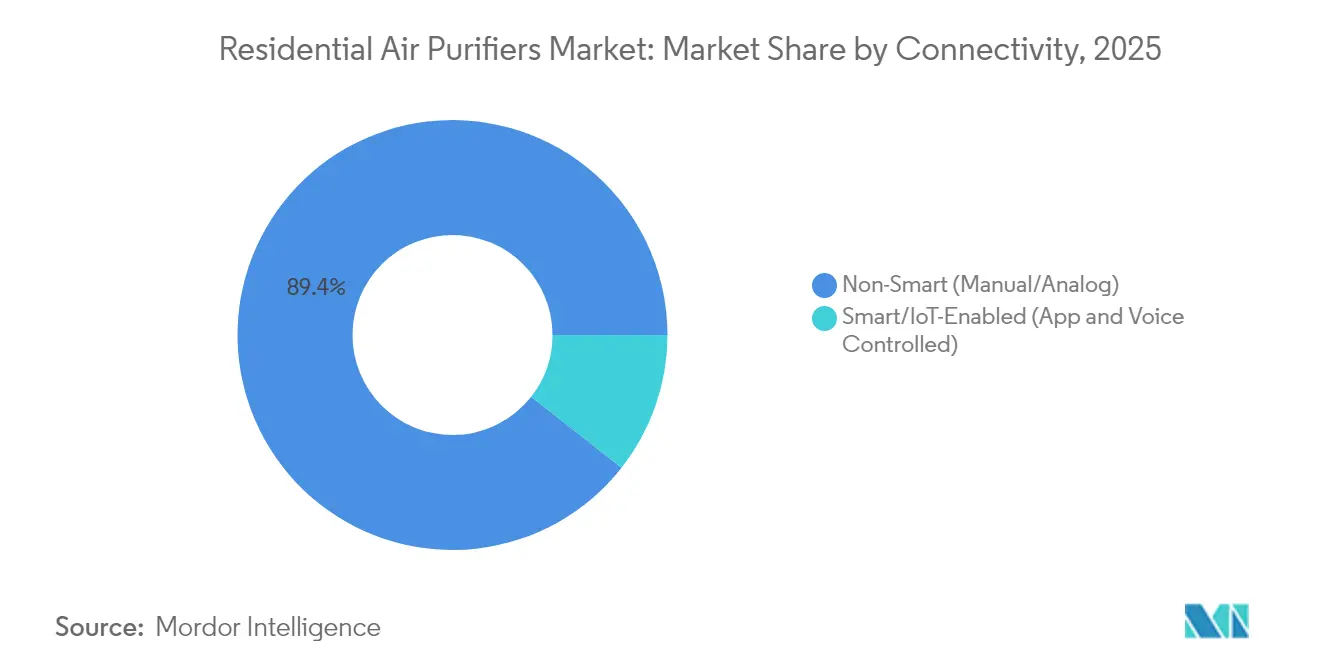
- By connectivity, Traditional non-smart devices held 89.40% of the residential air purifiers market in 2025, but smart models are poised for an 10.95% CAGR to 2031.
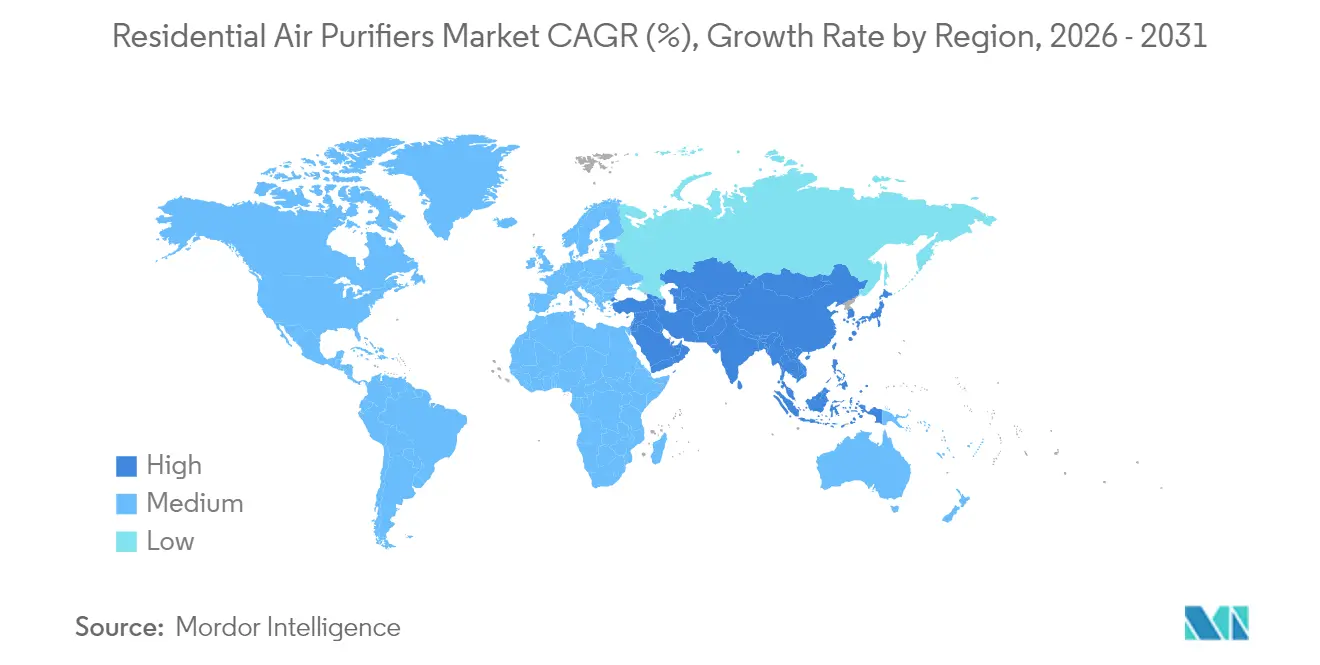
- By geography, Asia-Pacific captured 45.15% of the residential air purifiers market in 2025 and is forecast to post a 9.20% regional CAGR through 2031.
Note: Market size and forecast figures in this report are generated using Mordor Intelligence’s proprietary estimation framework, updated with the latest available data and insights as of 2026.
Market Trends and Insights
Drivers Impact Analysis of Residential Air Purifiers Market*
| Driver | (~) % Impact on CAGR Forecast | Geographic Relevance | Impact Timeline |
|---|---|---|---|
| Rising ambient PM2.5 levels in urban centers | +2.1% | Asia-Pacific core, spill-over to global urban areas | Long term (≥ 4 years) |
| Post-COVID focus on indoor air quality (IAQ) | +1.8% | Global, with highest impact in North America & EU | Medium term (2-4 years) |
| Government incentives for energy-efficient IAQ devices | +1.2% | North America & EU, emerging in Asia-Pacific | Medium term (2-4 years) |
| Smart-home and IoT ecosystem pull-through | +0.9% | Global, led by North America and developed APAC | Long term (≥ 4 years) |
| Subscription-based filter-replacement models | +0.7% | North America & EU, expanding to Asia-Pacific | Short term (≤ 2 years) |
| Growth of remote work increasing indoor time | +0.5% | Global, concentrated in developed markets | Short term (≤ 2 years) |
| Source: Mordor Intelligence | |||
Rising Ambient PM2.5 Levels in Urban Centers
Escalating fine-particle pollution across Asian megacities is driving the residential air purifiers market into a long-term uptrend. PM2.5 readings in Beijing and Delhi often exceed WHO guidelines by 300% to 400%. Health studies link these spikes to respiratory disease, and South Korea attributes 40,000 yearly deaths to pollution. Governments respond with multi-billion-dollar clean-air plans, yet indoor protection remains the consumer’s immediate defense. Manufacturers highlight particulate metrics; Panasonic’s nanoe X platform reports a 99% reduction in PM2.5 efficiency. Persistent smog, therefore, sustains demand for devices, positioning air purifiers alongside water filters as household essentials.
Post-COVID Focus on Indoor Air Quality
The pandemic repositioned clean air from optional comfort to a core health need, triggering new adoption in the residential air purifiers market. U.S. sales are projected to climb from USD 2.8 billion in 2022 to USD 4.78 billion by 2030. Public-health agencies endorse portable HEPA or UV-C units for pathogen control, bolstering trust. Research has shown that photocatalytic filters can deactivate SARS-CoV-2 effectively.[1] Start-ups such as Molekule gained FDA clearance for virus-targeting products, proving commercial traction. Continued expert messaging that better ventilation curbs future outbreaks keeps the momentum alive.
Government Incentives for Energy-Efficient IAQ Devices
Rebates and standards lower ownership costs and spur technology upgrades across the residential air purifiers industry. Oregon’s USD 75 rebate on ENERGY STAR units and California’s USD 2.8 million AB 617 grant in disadvantaged homes trim payback periods.[2] Federal minimum efficiency levels, effective 2023, could yield USD 5.8-13.7 billion in lifetime consumer savings. These policies encourage the development of high-CADR, low-wattage models and create a transparent performance yardstick that lifts premium adoption.
Smart-Home and IoT Ecosystem Pull-Through
Connectivity converts standalone purifiers into data-rich nodes that appeal to tech-savvy buyers. The smart sub-segment is forecast to reach USD 17.7 billion by 2032 at a 10.1% CAGR. Products such as Winix’s C610 integrate WiFi control and sensor-driven automation. Vendors bundle predictive filter replacement and subscription financing, smoothing maintenance hurdles. Voice-assistant compatibility pushes penetration among busy households and elderly users, reinforcing premium positioning in the residential air purifiers market.
Restraints Impact Analysis of Residential Air Purifiers Market*
| Restraint | (~) % Impact on CAGR Forecast | Geographic Relevance | Impact Timeline |
|---|---|---|---|
| High up-front and maintenance costs | -1.4% | Global, most pronounced in price-sensitive emerging markets | Medium term (2-4 years) |
| Ozone & by-product safety concerns | -0.8% | North America & EU, spreading to Asia-Pacific | Long term (≥ 4 years) |
| HVAC integrated filters reducing incremental demand | -0.6% | North America & EU, limited impact in Asia-Pacific | Long term (≥ 4 years) |
| Consumer "filter-replacement fatigue" | -0.4% | Global, particularly in markets without subscription models | Short term (≤ 2 years) |
| Source: Mordor Intelligence | |||
High Up-Front and Maintenance Costs
Effective HEPA units range from USD 150 to USD 1,500, while replacement filters, costing USD 50 to USD 200 twice a year, inflate lifetime outlays. Total cost can match the purchase price within five years, discouraging lower-income families in the regions that need them most. DIY options such as the Corsi-Rosenthal box highlight price sensitivity. Although subscription plans and financing ease the burden, high ownership costs remain the strongest constraint on the residential air purifiers market.
Ozone & By-Product Safety Concerns
Ionic and electrostatic devices face regulatory pushback because they release ozone and secondary pollutants. California mandates that indoor cleaners emit less than 0.05 ppm of ozone, and the FDA labels ozone a toxic gas at any therapeutic level.[3] Studies from the Lawrence Berkeley National Laboratory find that some generators are ineffective at removing VOCs while forming formaldehyde. Brands now pursue UL 2998 validation (<0.005 ppm ozone) or pivot to filter-based designs, but lingering safety doubts temper demand in sensitive consumer segments.
*Our forecasts treat driver/restraint impacts as directional, not additive. The impact forecasts reflect baseline growth, mix effects, and variable interactions.
Residential Air Purifiers Market Segment Analysis
By Filtration Technology:
HEPA Dominance Faces Hybrid InnovationHEPA retained a 51.20% residential air purifier market share in 2025 thanks to its 99.97% capture rate for 0.3-micron particles. Hybrid systems that combine HEPA, activated carbon, and UV-C achieve the fastest 9.05% CAGR, as buyers seek comprehensive pollutant coverage. Ionic solutions decline under ozone rules, while emerging photocatalytic media attract pathogen-focused shoppers.
Manufacturers innovate around multi-stage stacks: Coway’s HyperVortex filter claims 99.999% efficiency down to 0.01 microns. Research into nanofiber HEPA and metal-organic frameworks promises lower pressure drop and longer life. This shift underpins the potential for premium pricing across the residential air purifiers market.

By Type:
Portable Leadership Challenged by Integrated SolutionsPortable units captured 86.70% of the residential air purifiers market size in 2025 because they are easy to install, renter-friendly, and priced entry-level. In-duct systems, however, are growing at a rate of 10.35% annually, as homeowners favor whole-house coverage that leverages existing HVAC ducts.
Remote-work trends increase daily indoor hours and drive demand for broader protection. Filter-free electrostatic plates, now being piloted in Korea with over 90% ultrafine removal efficiency, could significantly reduce maintenance costs. Financing and subscription models are gradually narrowing the cost gap that once limited the use of central solutions.
By Connectivity:
Smart Features Drive Premium AdoptionNon-smart models still dominate, with a 89.40% share in 2025, due to their budget appeal and perceived comfort in terms of privacy. Yet smart devices post an 10.95% CAGR, redefining the residential air purifiers market as part of the connected-home bundle.
Real-time AQI displays, cloud analytics, and voice-activated commands add functional value. Samsung and LG now pitch purifier subscriptions that pair AI diagnostics with automatic filter shipments. Data-rich services lock in customer loyalty and open pathways for energy-management tie-ins.
Geography Analysis
APAC Residential Air Purifiers Market
The Asia-Pacific region posted a 45.15% residential air purifiers market share in 2025 and is expected to lead future growth with a 9.20% CAGR. Chronic urban smog, combined with rising incomes, prompts Chinese and Indian households to view indoor air as a health utility. Xiaomi leverages an IoT ecosystem to scale mid-price purifiers, while Korean firms such as Coway excel with rental models that eliminate upfront cost. Government clean-air budgets accelerate replacement cycles.
North America Residential Air Purifiers Market
North America follows a regulatory-driven path. U.S. incentive programs and wildfire smoke increase purchase urgency, driving the residential air purifiers market size in the region to an expected USD 5.14 billion by 2031. California’s strict ozone cap influences national product standards, and the adoption of smart homes yields a premium skew.
EMEA and South America Residential Air Purifiers Market
Europe values energy efficiency and low noise. Stringent eco-design directives favor low-wattage units, and consumers are willing to accept premium price tags for durable builds. South America and the Middle East & Africa remain nascent but are logging double-digit shipment growth as urbanization spreads and middle-class incomes rise, suggesting a long runway for the global residential air purifiers market.
Regulatory Landscape
In the United States, the regulatory anchor for residential (conventional) room air cleaners is the U.S. Department of Energy (DOE) energy conservation standard finalized via amendments to 10 CFR Parts 429 and 430, with Tier 2 compliance fully effective as of December 31, 2025. The DOE framework uses Integrated Energy Factor (IEF) expressed as PM2.5 Clean Air Delivery Rate per watt, and it designates AHAM AC-7-2022 as the test procedure reference, which pushes manufacturers toward higher PM2.5 CADR/W designs and tighter documentation of certified performance.
Voluntary labeling is converging with mandatory requirements: the U.S. EPA ENERGY STAR Room Air Cleaners Version 3.0 specification became effective October 9, 2025, moving from Smoke CADR/W to PM2.5 CADR/W to align with DOE. In parallel, ozone and by-product concerns continue to shape allowable technologies, with California Air Resources Board (CARB) requirements limiting ozone emissions for indoor air cleaning devices. This reinforces the pivot away from ozone-generating ionization approaches and toward filter-based or validated low-ozone designs. In Europe, Regulation (EU) 2024/1781 established a new ecodesign framework for sustainable products, signaling a tightening pathway for product sustainability and efficiency criteria that interacts with existing ventilation-unit ecodesign rules and industry guidance from bodies such as Eurovent.
Value Chain Analysis
The residential air purifier value chain begins with upstream materials such as meltblown and other nonwoven filtration media, followed by conversion into HEPA and pre-filter assemblies, activated carbon components, and supporting parts including fans/motors, housings, sensors, and control electronics. Material and component costs dominate build economics, with raw materials often representing the largest share of manufacturing operating costs, which makes supplier relationships for filtration media and carbon critical for both performance consistency and margin management. Producers such as Hollingsworth and Vose supply filtration media used across purifier and HVAC filtration applications, while a large base of OEM/ODM filter and finished-goods manufacturers in China supports private-label and branded programs.
Midstream activities include final assembly, performance and safety testing, and compliance certification before products move through retail, e-commerce, and installer channels, especially for in-duct systems. Compliance checkpoints act as gating functions across the chain, including DOE energy standards with Tier 2 effective December 31, 2025 and regional ozone limits such as CARB, which require pre-market testing and traceable documentation. Downstream, recurring filter replacement drives aftermarket revenue and has encouraged subscription and rental models that connect manufacturers, distributors, and end users through replenishment logistics, packaging, and customer support workflows.
Competitive Landscape
The residential air purifier market is fragmented, with no single player controlling a double-digit global share. Appliance majors such as Samsung, LG, and Dyson compete for volume with specialist brands like Coway and IQAir. Post-pandemic demand triggered M&A: iRobot acquired Aeris Cleantec to diversify beyond floor care, while Blade Air acquired InnerEco for its filtration expertise.
Technology differentiation centers on virus inactivation and energy savings. Sharp’s Plasmacluster ions cut SARS-CoV-2 titers by 99.4% in lab tests. Start-ups are harnessing nanomaterials for VOC capture, while incumbents are refining low-wattage fans to comply with forthcoming EU eco-design rules.
Business-model innovation is equally fierce. Samsung’s AI subscription club undercuts upfront pricing, and Coway’s rental accounts reach 10 million worldwide, with 34% outside of Korea. Vendors rely on recurring filter sales to stabilize revenue and finance research and development for the next leap in the residential air purifiers market.
Residential Air Purifiers Industry Leaders
-
Daikin Industries Ltd
-
Koninklijke Philips NV
-
Coway Co. Ltd
-
Xiaomi Corp.
-
Dyson Ltd
- *Disclaimer: Major Players sorted in no particular order
Residential Air Purifiers Market Companies Covered in this Report
- Daikin Industries Ltd
- Sharp Corporation
- Honeywell International Inc.
- LG Electronics Inc.
- Unilever PLC (Blueair AB)
- Dyson Ltd
- Whirlpool Corporation
- AllerAir Industries Inc.
- Panasonic Corporation
- Koninklijke Philips NV
- IQAir AG
- Samsung Electronics Co. Ltd
- WINIX Inc.
- Xiaomi Corp.
- Coway Co. Ltd
- Kent RO Systems Ltd
- Austin Air Systems Ltd
- Levoit (Vesync Co. Ltd)
- Molekule Group Inc.
- Camfil AB
Market Opportunities and Future Outlook
Energy-performance labeling and test-method alignment creates a clear whitespace for products engineered around PM2.5 CADR per watt rather than legacy smoke-based metrics. With the U.S. EPA ENERGY STAR Room Air Cleaners Version 3.0 specification effective October 9, 2025 and DOE efficiency requirements in force with Tier 2 effective December 31, 2025, manufacturers that can document strong PM2.5 CADR/W while maintaining low noise and acceptable replacement-filter costs have a differentiated path in mass retail and utility-rebate driven channels. This also supports opportunities for premiumization through multi-stage designs (HEPA plus carbon and UV-C), provided ozone and by-product concerns are addressed via recognized validation pathways.
New-home and renovation workflows create another opportunity pocket where filtration becomes part of whole-home IAQ compliance rather than a discretionary appliance purchase. U.S. EPA Indoor airPLUS Version 2 requirements, published July 2024, formalize building-level IAQ expectations, and the program transitions so that homes permitted on or after January 2027 are no longer eligible for Version 1, increasing the role of verified ventilation and filtration choices in certified housing. In parallel, the 2025 editions of ASHRAE 62.1 and 62.2 expand attention to humidity control and demand control ventilation, which elevates the role of in-duct filtration and integrated purification options that can be specified alongside HVAC upgrades. Recurring service model initiatives, including Samsung and LG subscription pitches and Coway rental programs, also broaden the addressable base by lowering upfront barriers while improving filter-replacement adherence.
Recent Industry Developments in Residential Air Purifiers Market
- April 2026: Daikin Philippines introduced the Air Creator lineup in the country, including an air purifier model using double-method technology (Streamer and Active Plasma Ion). The rollout extends Daikin's residential air purification footprint in Southeast Asia and supports its positioning around integrated indoor air ecosystems alongside air conditioning.
- March 2026: Coway launched the Airmega Mighty2 (AP-1512N), updating its Mighty series with a modernized design and enhanced control interface. Refreshing a high-volume core product supports competitive differentiation in the portable segment where replacement cycles and consumer experience upgrades influence brand retention.
- December 2024: Samsung unveiled an AI subscription club that includes air purifiers among other home appliances to reduce upfront cost for consumers. Expanding subscription access supports recurring revenue models tied to filter replenishment and increases stickiness within broader smart-home and appliance bundles.
Residential Air Purifiers Market Report Scope and Research Methodology
Market Definition and Coverage
For this study, the residential air purifiers market is defined as the revenue generated from air-cleaning devices bought and used in homes to reduce indoor pollutants like dust, smoke, pollen, and fine particles.
Scope exclusions: The sizing excludes portable humidifiers or dehumidifiers, HVAC-only ventilation equipment, and routine replacement filter purchases unless they are sold as part of a bundled purifier package.
Segments Covered in This Report
- Filtration Technology
- High-efficiency Particulate Air (HEPA)
- Activated Carbon
- Ionic/Electrostatic Precipitators
- UV-C and Photocatalytic Oxidation
- Hybrid and Multi-stage Systems
- Type
- Stand-alone/Portable
- In-duct/Central HVAC
- By Connectivity
- Non-Smart (Manual/Analog)
- Smart/IoT-Enabled (App and Voice Controlled)
- Geography
- North America
- United States
- Canada
- Mexico
- Europe
- United Kingdom
- Germany
- France
- Spain
- Nordic Countries
- Russia
- Rest of Europe
- Asia-Pacific
- China
- India
- Japan
- South Korea
- ASEAN Countries
- Australia
- Rest of Asia-Pacific
- South America
- Brazil
- Argentina
- Colombia
- Rest of South America
- Middle East and Africa
- Saudi Arabia
- United Arab Emirates
- South Africa
- Egypt
- Rest of Middle East and Africa
- North America
Data Sources, Market Sizing, and Validation
Desk Research
Desk research was used to set the factual base for the model and keep assumptions realistic across regions. We relied on public sources such as the US Environmental Protection Agency (indoor air quality guidance), World Health Organization air pollution updates, World Bank urbanization and income indicators, and UN Comtrade trade statistics for relevant product flows.
In parallel, we reviewed company filings, annual reports, investor presentations, and reputable press releases to understand pricing movements, feature adoption, and supply chain shifts that can affect shipments and revenues. Where needed, paid subscriptions for company financials and intelligence and a shipment-level import-export database were used to cross-check supplier presence and trade direction. These examples are illustrative only, and many other public sources were also used for collection, validation, and research clarification.
Primary Interviews and Surveys
Primary interviews focused on validating the residential demand pool and the price structure for common purifier types, since public data can vary by country. We spoke with manufacturers, distributors, and retailers, and also with industry specialists that track indoor air quality products, covering APAC, EMEA, and the Americas so regional adoption and seasonality patterns were not overstated.
Distribution of primary research fieldwork respondents
| Company type | Respondent position | Region |
|---|---|---|
| Top tier: 35% | CXOs: 13% | APAC: 44% |
| Mid tier: 50% | Functional/Unit leaders: 35% | EMEA: 32% |
| Smaller Players: 15% | Managers: 52% | Americas: 24% |
Market-Sizing & Forecasting
Sizing starts with a top-down demand pool build using households by region, urban share, and an adoption rate for dedicated home air cleaning devices. This is then translated into unit estimates and value using typical replacement cycles. Once the structure is in place, totals are checked with selective bottom-up approximations, including sampling average selling price bands by channel and comparing implied unit volumes with supplier and trade signals, then adjusting where the gaps are explainable.
Key inputs that move the model include indoor PM2.5 exposure discussions that influence awareness, wildfire and haze season intensity in key markets, housing type mix that affects room coverage needs, purifier price ladders (entry, mid, premium), and filtration preferences like HEPA share that can shift ASP over time. For forecasting, we used scenario analysis supported by simple multivariate regression checks on variables such as urban households, disposable income trends, and air quality incident frequency, since adoption can jump in particular years. Where the channel view was incomplete in smaller countries, we used proxy penetration and price bands from similar markets, then validated them through interviews before finalizing.
Data Validation & Update Cycle
Validation is done through multiple cross-checks so one noisy data series does not drive the final number. Outputs are compared with independent signals like trade direction, regional growth patterns, and implied unit volumes versus typical device lifetimes, then exceptions are reviewed before sign-off.
When a large variance appears, we re-check assumptions, revisit the source trail, and reconnect with selected interviewees to confirm what changed in pricing, channel mix, or demand conditions. Reports are refreshed annually, and interim updates are made when material events occur, such as regulation shifts, major supply disruptions, or clear changes in consumer demand. Before delivery, we run a final review pass so clients receive the most current view available.
Mordor Intelligence's Residential Air Purifiers Market Size Measured Against Other Published Estimates
Published market sizes for residential air purifiers often do not match because firms do not count the same revenue items, and they do not refresh assumptions on the same cadence. Differences usually come from what is included in scope, how prices are averaged across channels, and whether the model is anchored to a household-based demand pool or to a broader equipment category.
Some external estimates expand the definition by folding in add-on revenues like replacement filters and longer-horizon projections that assume steep adoption jumps in high pollution years. For Mordor Intelligence, the market value is limited to residential purifier device revenue, and price and adoption assumptions are rechecked using interviews and public indicators before the totals are finalized.
Benchmark comparison
| Source | Market Size | Gaps in Research Methodology |
|---|---|---|
| Mordor Intelligence | USD 11.31 B (2025) | |
| Global Publisher A | USD 12.45 B (2025) | Uses a broader revenue lens that can include accessories and aggressive adoption uplift assumptions, which raises the implied ASP and volume beyond device-only demand in some regions. |
| Industry Publisher B | USD 9.80 B (2024) | Base year and currency timing differ, and the scope is often built from a shorter device list and limited channel coverage, which can undercount premium models and online sales in fast-growing markets. |
The spread in values is mainly explained by what is treated as in-scope revenue and how quickly adoption is assumed to rise across regions. By keeping inputs traceable to households, price bands, and repeatable replacement behavior, the sizing can be reconciled back to real-world buying patterns and updated when demand signals shift.
Key Questions Answered in the Report
What is the current residential air purifiers market size and growth outlook?
The residential air purifiers market size reached USD 12.18 billion in 2026 and is projected to hit USD 17.62 billion by 2031, reflecting an 7.68% CAGR.
Which region leads the residential air purifiers market?
Asia-Pacific leads with a 45.15% share in 2025 and is forecast to grow at a 9.20% CAGR through 2031.
What technology dominates the residential air purifiers market?
HEPA filtration holds a 51.20% share, while hybrid multi-stage systems are the fastest-growing at a 9.05% CAGR.
How fast is the smart segment of the residential air purifiers market growing?
Smart/IoT-enabled purifiers are expanding at an 10.95% CAGR from 2026-2031 as connectivity features gain traction.
What is the biggest restraint on residential air purifier adoption?
High initial purchase and ongoing filter replacement costs are the main barriers, especially in price-sensitive regions.
Which companies are pursuing subscription models in the residential air purifiers market?
Samsung, LG, and Coway all offer subscription or rental programs that trade upfront hardware costs for recurring service fees.