
Reservoir Analysis Market Size and Share
Market Overview
| Study Period | 2021 - 2031 |
|---|---|
| Market Size (2026) | USD 10.09 Billion |
| Market Size (2031) | USD 12.84 Billion |
| Growth Rate (2026 - 2031) | 4.92 % |
| Fastest Growing Market | Asia Pacific |
| Largest Market | North America |
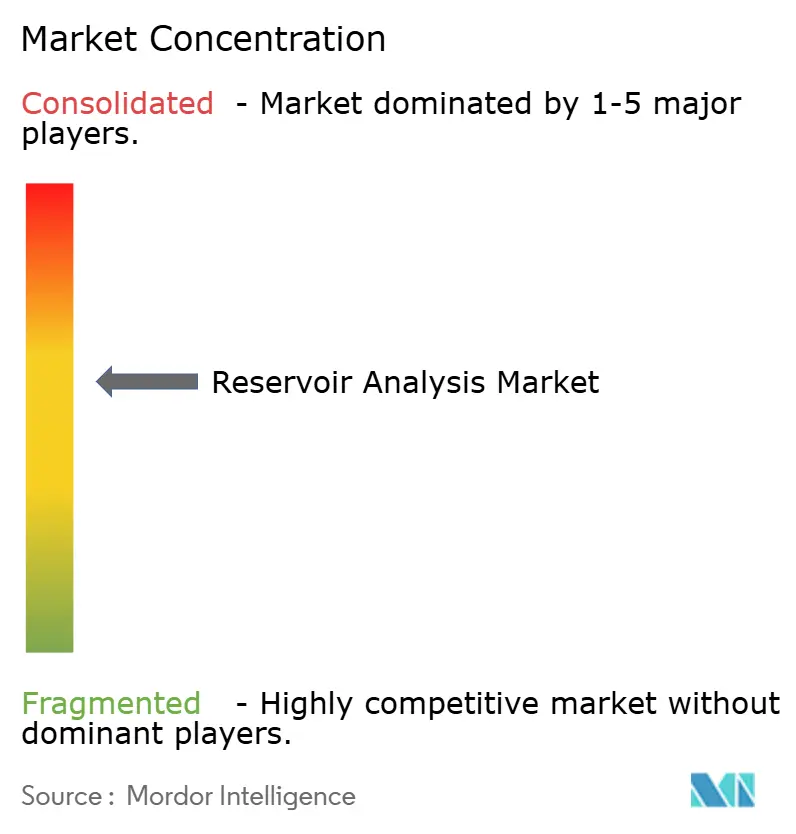
| Market Concentration | Medium |
Major Players *Disclaimer: Major Players sorted in no particular order Image © Mordor Intelligence. Reuse requires attribution under CC BY 4.0. | |
Reservoir Analysis Market Analysis by Mordor Intelligence
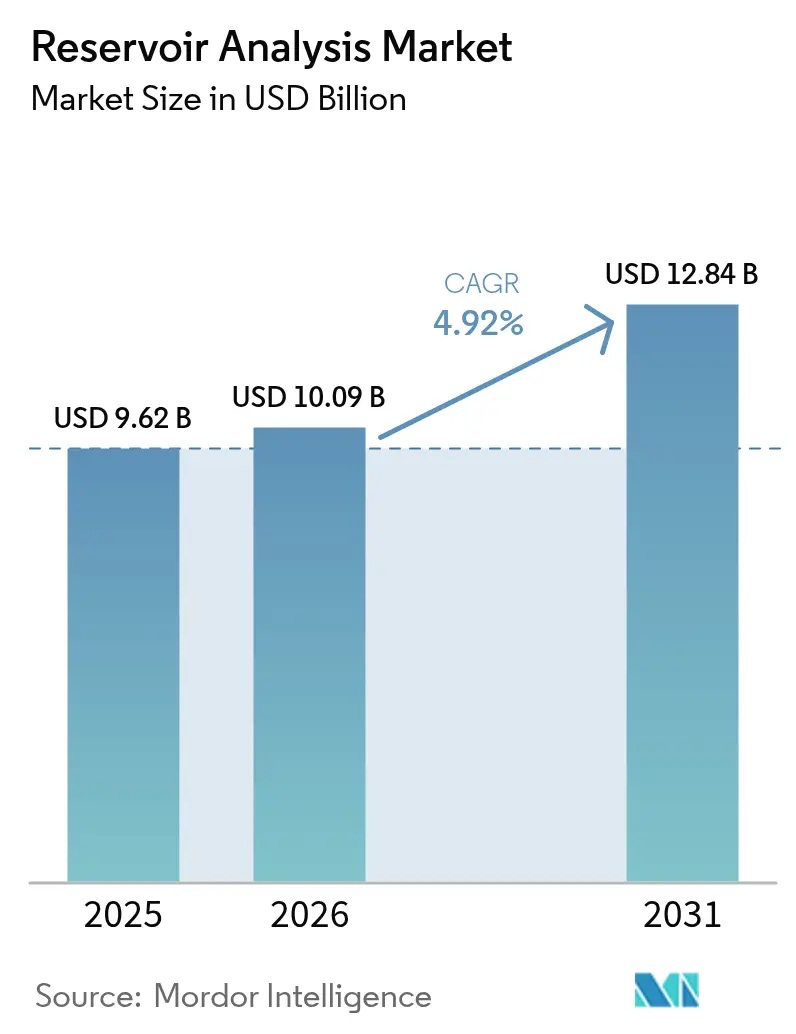
The Reservoir Analysis Market size is expected to grow from USD 9.62 billion in 2025 to USD 10.09 billion in 2026 and is forecast to reach USD 12.84 billion by 2031 at 4.92% CAGR over 2026-2031.
This growth trajectory reflects the industry's strategic shift toward data-driven reservoir optimization, as operators face increasing pressure to maximize recovery rates while minimizing environmental impact. The reservoir analysis sector has become the critical nexus where traditional subsurface engineering converges with advanced analytics, positioning it as an essential enabler for both conventional field optimization and emerging energy transition initiatives. The competitive landscape reflects consolidation dynamics as major service providers integrate AI capabilities through strategic acquisitions and partnerships. Market concentration intensifies as operators demand integrated solutions that span reservoir characterization through production optimization, creating barriers for smaller, specialized providers.
Key Report Takeaways
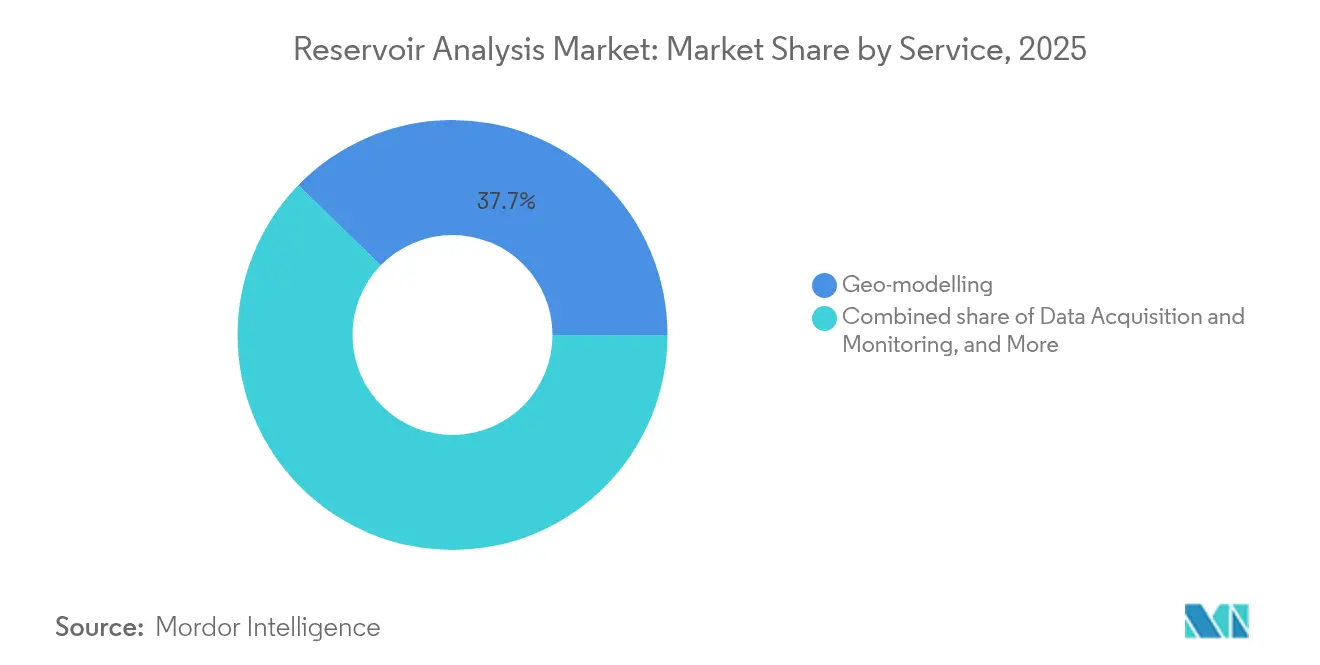
- By service, geo-modeling captured 37.74% of the reservoir analysis market share in 2025. Reservoir simulation is forecasted to expand at a 6.35% CAGR between 2026 and 2031.
- By technology, wireline logging led with 42.98% revenue share in 2025. Machine-learning-assisted analytics is projected to record a 6.88% CAGR through 2031.
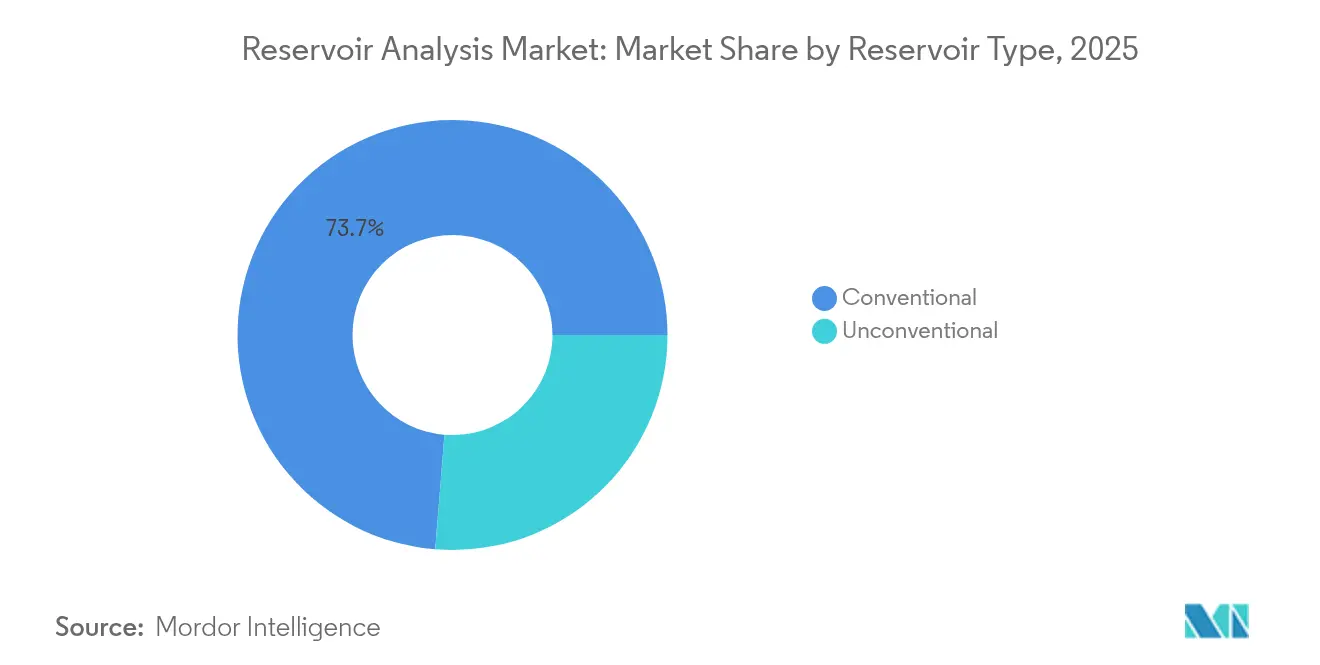
- By reservoir type, conventional assets contributed 73.72% of the reservoir analysis market size in 2025. Unconventional reservoirs are advancing at a 7.06% CAGR to 2031.
- By application, onshore projects held a 67.95% share of the reservoir analysis market size in 2025. Offshore deep- and ultra-deepwater developments are expected to grow at an 7.74% CAGR during the forecast period.
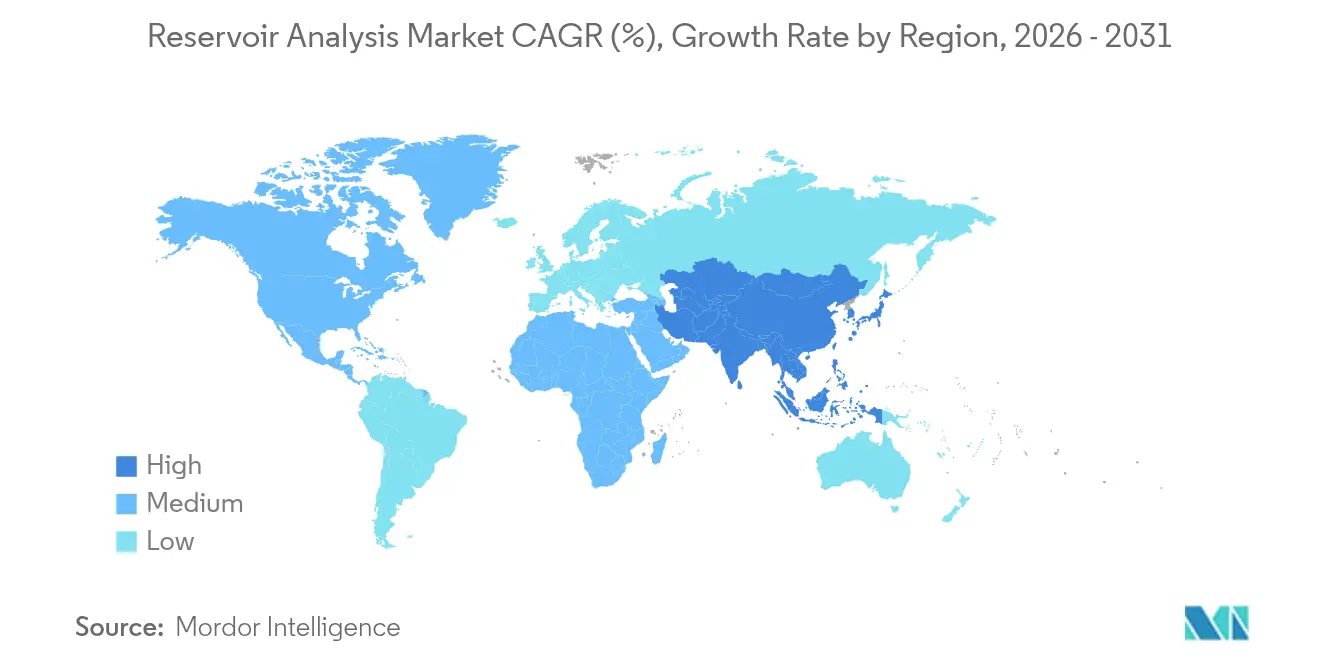
- By geography, North America commanded a 40.52% revenue share in 2025, while the Asia-Pacific is forecasted to register the fastest growth at a 7.31% CAGR to 2031.
Note: Market size and forecast figures in this report are generated using Mordor Intelligence’s proprietary estimation framework, updated with the latest available data and insights as of 2026.
Market Trends and Insights
Drivers Impact Analysis of Reservoir Analysis Market*
| Driver | (~) % Impact on CAGR Forecast | Geographic Relevance | Impact Timeline |
|---|---|---|---|
| Rising unconventional hydrocarbon development | +1.20% | North America core; expanding in APAC & MEA | Medium term (2-4 years) |
| Digital-oilfield adoption & advanced analytics integration | +0.80% | Global; North America & Europe leading | Short term (≤2 years) |
| Increasing offshore deep- / ultra-deepwater E&P spending | +0.60% | Gulf of Mexico, North Sea, Brazil | Long term (≥4 years) |
| Cloud-based collaborative reservoir models | +0.50% | Early uptake in North America & Middle East | Medium term (2-4 years) |
| Mandatory CCUS reservoir suitability studies | +0.40% | Europe & North America; spreading globally | Long term (≥4 years) |
| Geothermal repurposing of depleted fields | +0.30% | Europe & North America; emerging in APAC | Long term (≥4 years) |
| Source: Mordor Intelligence | |||
Rising unconventional hydrocarbon development
Rapid unconventional growth reshapes analytical requirements because shale reservoirs display multiphase flow regimes and artificial fracture networks that evade traditional models. Extra Trees machine-learning algorithms achieved an R² value of 0.81 while forecasting Duvernay shale production, doubling the accuracy compared with legacy decline-curve techniques. Driven completion workflows enable operators to fine-tune fluid volumes and proppant concentration, often doubling early-life output. Such demonstrable gains fuel demand for advanced reservoir characterization, lifting the reservoir analysis market as unconventional assets mature.
Digital-oilfield adoption & advanced analytics integration
Edge AI, IoT sensors, and real-time platforms enable reservoir analysis to shift from episodic studies to continuous optimization. In Ecuador’s Shushufindi Field, SLB’s Agora edge AI prevented 12,000 barrels of deferred oil by predicting injection system failures.(1)SLB, “Agora Edge AI Prevents Deferred Oil in Shushufindi,” slb.comAutomated fracture-stage evaluation now attains 99.7% event-detection accuracy, permitting on-the-fly pumping adjustments. These operational wins accelerate digital oilfield rollouts, reinforcing the steady expansion of the reservoir analysis market.
Increasing offshore deep- / ultra-deepwater E&P spending
Deepwater wells require multidisciplinary data synthesis to derisk investments of USD billions. SLB’s USD 800 million services pact with Petrobras spans 100 wells and leverages Ora intelligent testing for real-time fluid mapping. High-pressure, high-temperature environments enhance analytical rigor through the integration of seismic, petrophysical, and dynamic models, which safeguard well placement. These complexities elevate offshore demand, sustaining value growth in the reservoir analysis market.
Cloud-based collaborative reservoir models
Cloud platforms mobilize global asset teams around a living reservoir model that ingests real-time data. SLB’s 10-year pact with TotalEnergies builds Delfi-enabled AI workflows to automate history matching and predictive maintenance. Continuous updating counters volatile production behavior and accelerates decision cycles. Embracing cloud collaboration further underpins market expansion as operators rationalize software licensing and hardware costs.
Restraints Impact Analysis of Reservoir Analysis Market*
| Restraint | (~) % Impact on CAGR Forecast | Geographic Relevance | Impact Timeline |
|---|---|---|---|
| Oil-price volatility dampening E&P CAPEX | -0.70% | Global; acute in North America shale & offshore projects | Short term (≤2 years) |
| High service cost for HPHT & ultra-deepwater | -0.50% | Gulf of Mexico, North Sea, West Africa | Medium term (2-4 years) |
| Data-sovereignty & cybersecurity concerns | -0.30% | Europe, China, national oil companies | Medium term (2-4 years) |
| Shrinking pool of experienced professionals | -0.20% | North America & Europe | Long term (≥4 years) |
| Source: Mordor Intelligence | |||
Oil-price volatility dampening E&P CAPEX
Despite firmer prices, producers maintain strict capital discipline, which prioritizes short-cycle studies over long-cycle ones. The Dallas Federal Reserve reports that companies are redirecting cash toward debt reduction and dividends rather than exploration budgets. Deferred projects shrink near-term spending on comprehensive reservoir studies, tempering the growth of the reservoir analysis market.
High service cost for HPHT & ultra-deepwater
HPHT projects exceeding 20,000 psi and 400 °F require bespoke metallurgy and sensors, which doubles the service prices relative to conventional work.(2)J. Smith, “Automated Stage-Wise Analysis Reaches 99.7% Accuracy,” OnePetro, onepetro.org Limited supplier pools add oligopolistic premiums, pushing some operators to postpone studies until cash flows stabilize. Elevated costs thus constrain uptake in the reservoir analysis industry.
*Our forecasts treat driver/restraint impacts as directional, not additive. The impact forecasts reflect baseline growth, mix effects, and variable interactions.
Reservoir Analysis Market Segment Analysis
By Service:
Simulation Advances Amid Geo-Modeling PrimacyThe reservoir analysis market size for geo-modeling reached its highest point in 2025, capturing a 37.74% share, due to its foundational role in field planning. Simulation, however, is forecast to post a 6.35% CAGR through 2031 as dynamic modelling supersedes static frameworks in unconventional settings. Operators leverage neural networks that outperform decline-curve forecasts by R² margins exceeding 0.80 in Eagle Ford evaluations. Integrated reservoir management is gaining traction because single-vendor solutions reduce interface risk and shorten decision-making loops.
Data acquisition remains resilient as permanent downhole gauges enable continuous surveillance. Sampling services persist for fluid PVT quality control, although non-invasive spectroscopic tools are reducing the need for core-based tests. Emerging “others” services, digital twins, and automated inversion signal the next wave of analytics, reinforcing the reservoir analysis market as a strategic platform for multi-disciplinary optimisation.


By Technology:
Machine Learning Challenges Wireline DominanceWireline logging retained a 42.98% share of the reservoir analysis market size in 2025, thanks to decades of field use. Machine-learning-assisted analytics, although smaller, are expected to accelerate at a 6.88% CAGR through 2031, as convolutional networks automate lithology classification. Hybrid workflows integrate gamma-ray, resistivity, and acoustic logs with AI models, reducing the interpretation cycle time by 60%. Fiber-optic distributed sensing, coupled with 4D seismic, furnishes real-time fracture diagnostics that augment completion design.
Operators value the fusion of trusted measurement and predictive intelligence, prompting service players to bundle AI software with legacy hardware. Baker Hughes’ SureCONNECT FE fiber-optic wet-mate system, launched in January 2025, exemplifies this integration by enabling continuous monitoring in deepwater. This convergence feeds sustained value creation within the reservoir analysis market.
By Reservoir Type:
Unconventional Momentum Confronts Conventional ScaleConventional resources accounted for 73.72% of the reservoir analysis market share in 2025, driven by mature giant fields and established workflows. Unconventional assets, however, expand at a 7.06% CAGR because optimized fracturing and AI-enabled analytics expose new cash-flow opportunities. Digital rock analysis, combined with machine learning, now predicts core properties without the need for physical plugs, thereby trimming lab time and costs.
Investment trade-offs increasingly reward unconventional plays where rapid payout offsets shorter decline curves. Consequently, service providers tailor simulators to match the complexity of hydraulic fractures, broadening the reservoir analysis industry beyond classical Darcy-flow paradigms.
By Application:
Offshore Upswing Outpaces Onshore ScaleOnshore fields contributed 67.95% of 2025 revenue, underlining their vast well count and lower entry barriers. Offshore projects, particularly deepwater, register the fastest 7.74% CAGR to 2031 because elevated revenue per barrel justifies premium services. Complex pressure regimes, fault compartmentalization, and multi-contact fluids necessitate an integrated analysis that spans geophysics to dynamic modeling.
New fiber-optic solutions that can withstand water depths of 10,000 feet provide real-time production insights, which are crucial for optimizing life-of-field efficiency. The cross-applicability of offshore innovations to shale plays further multiplies the addressable demand, supporting the sustained expansion of the reservoir analysis market.
Geography Analysis
North America Reservoir Analysis Market
North America retains its leadership position with a 40.52% revenue share in 2025, driven by prolific shale drilling and the early adoption of digital oilfield technologies. Operators embed machine learning in every phase from completion design to decline diagnostics, reinforcing regional dominance. Collaborative efforts, such as the SLB-Nabors automation program, illustrate the ongoing technology upgrades that keep the reservoir analysis market vibrant in the region. Regulatory incentives for carbon capture and storage also stimulate new evaluation campaigns across the Gulf Coast.
APAC Reservoir Analysis Market
The Asia-Pacific region posts a 7.31% CAGR, the fastest worldwide, driven by ambitious national energy security targets. China surpassed 400 million tons of oil and gas output in 2024, a milestone underpinned by advanced reservoir analytics that unlocked tight gas and deep carbonate resources. Australia’s gas projects and India’s CBM expansions further accelerate demand for simulation, seismic inversion, and production monitoring. Large-scale CCUS projects such as BP’s Tangguh UCC in Indonesia add a parallel data stream focused on storage integrity.
EMEA Reservoir Analysis Market
Europe sustains a balanced market as operators extract more barrels from aging North Sea fields while pioneering the use of CO₂ sequestration. Meanwhile, the Middle East and Africa channels capex into gas monetisation and offshore frontier plays, respectively. National oil companies in the region are increasingly stipulating integrated reservoir frameworks that bundle AI simulation with real-time surveillance, thereby widening the customer base for reservoir analysis market providers.

Regulatory Landscape
Measurement, reporting, and verification requirements are tightening around both produced hydrocarbons and associated emissions, which increases compliance demands for reservoir surveillance, well testing, and subsurface modeling workflows. In the United States, the Bureau of Safety and Environmental Enforcement (BSEE) issued a final rule effective August 10, 2026, incorporating updated industry standards (including API Manual of Petroleum Measurement Standards) that reinforce traceable production measurement and documentation on offshore operations.
Methane-focused rules are also pushing operators to embed monitoring and diagnostics deeper into field operations, linking environmental compliance to reservoir-management decisions. The US EPA final rule for oil and natural gas operations strengthens leak detection and repair expectations and targets steep long-run methane reductions, while Canada has advanced draft Oil and Gas Sector GHG Emissions Cap Regulations that add new reporting obligations starting June 1, 2027 for 2026 calendar-year emissions. Reserves and resources disclosure expectations continue to shape reservoir analysis deliverables through established guidance, including the UK North Sea Transition Authority (NSTA) reserves and resources guidance and the SPEE Canadian Oil and Gas Evaluation Handbook (COGEH) updates, keeping probabilistic estimation and auditable subsurface inputs central to annual reporting.
Competitive Landscape
The reservoir analysis market is moderately concentrated, with SLB, Halliburton, and Baker Hughes holding the majority share through integrated portfolios that span wireline, seismic, analytics, and production solutions. SLB’s USD 7.1 billion purchase of ChampionX in July 2025 enhances its artificial-lift and chemical offerings, creating an end-to-end asset optimization suite. Halliburton’s TrueSync hybrid ESP motor and OCTIV Auto Frac underline a strategic focus on embedding reservoir understanding directly into downhole hardware.
Competitive differentiation now hinges on the depth of AI capability, cloud delivery, and partnership ecosystems, rather than solely on price. Emerging specialists such as Resoptima and Ikon Science leverage digital twins and rock-physics analytics to secure niche positions. Market entry barriers rise because operators prefer vendors who can guarantee measurable production improvements under outcome-based contracts. As a result, consolidation momentum is set to continue, reinforcing scale advantages for incumbents within the reservoir analysis industry.
Reservoir Analysis Industry Leaders
Schlumberger Limited
Halliburton Company
Baker Hughes Company
Weatherford International PLC
CGG SA
- *Disclaimer: Major Players sorted in no particular order
Reservoir Analysis Market Companies Covered in this Report
- Schlumberger
- Halliburton
- Baker Hughes
- Weatherford
- CGG
- Core Laboratories
- Emerson (Roxar)
- TGS
- Ikon Science
- Kongsberg Digital
- Resoptima
- Petroleum Experts
- Pason Systems
- Fugro
- Paradigm (Emerson)
- Trican Well Service
- TechnipFMC
- NOV
- Schlumberger Software (Petrel)
- Geolog

Market Opportunities and Future Outlook
CCUS and methane-abatement compliance are expanding reservoir analysis from classical hydrocarbon development into long-duration containment, injectivity, and integrity assurance. The report scope already reflects this shift through mandatory CCUS reservoir suitability studies as a demand driver, and operators with assets on the US Gulf Coast, the North Sea, and other regulated basins are using fit-for-purpose characterization and monitoring workflows that resemble hydrocarbon reservoir management (static models, dynamic simulation, and surveillance-driven updates).
A second opportunity area is the move from episodic studies to closed-loop reservoir management, where look-ahead measurements, real-time data, and rapid modeling are linked directly to operational decisions. This direction is reinforced by public and technical signals: in July 2026, the US Department of Energy (HGEO) announced a USD 150 million funding initiative targeting unconventional recovery efficiency and improved fracture characterization, while 2026 technical publications and field case studies continue to cite higher-fidelity AI workflows for permeability prediction and flow-unit identification, along with digital-twin-style interwell connectivity modeling in large producing assets (including work cited for the Changqing oil field in China). These efforts support near-term whitespace for vendors that can productize explainable, auditable AI, integrate it with wireline and distributed sensing, and deliver outcomes through unified, cloud-enabled subsurface platforms.
Recent Industry Developments in Reservoir Analysis Market
- July 2026: Baker Hughes signed new agreements with Oil and Natural Gas Corporation Limited (ONGC) in India to supply advanced wireline logging, perforation, and drill stem testing services. The package, including systems such as Proxima logging and DeepConnect perforation charges, strengthens Baker Hughes presence in complex reservoir evaluation and well intervention work where data quality directly affects modeling and production decisions.
- May 2026: SLB entered an agreement to acquire Tachyus, an AI-driven, physics-based reservoir modeling company focused on high-speed modeling and closed-loop production optimization. Folding Tachyus capabilities into SLB digital platforms (including Delfi and Lumi) tightens the link between reservoir simulation and day-to-day production execution, increasing competitive pressure on standalone reservoir software and niche analytics providers.
- June 2025: Halliburton and PETRONAS Carigali deployed a next-generation subsurface modeling and reservoir-management collaboration, building on automation and digital-workflow integration. The initiative points to operator preference for integrated, end-to-end ecosystems that combine domain workflows with scalable compute and data management, shaping vendor selection toward platform-led offerings.


Reservoir Analysis Market Report Scope and Research Methodology
Market Definition and Coverage
For this study, the reservoir analysis market covers revenue earned from services and solutions used to interpret reservoir rocks and fluids, build reservoir models, and support field development decisions across oil and gas assets.
Scope exclusions: We exclude downstream refining activities and standard drilling services that do not include reservoir characterization or reservoir performance evaluation.
Segments Covered in This Report
- By Service
- Geo-modelling
- Reservoir Simulation
- Data Acquisition and Monitoring
- Reservoir Sampling
- Integrated Reservoir Management
- Others
- By Technology
- Wireline Logging
- 3-D/4-D Seismic Imaging
- Fiber-Optic Distributed Sensing
- Machine-Learning Assisted Analytics
- By Reservoir Type
- Conventional
- Unconventional
- By Application
- Onshore
- Offshore
- By Geography
- North America
- United States
- Canada
- Mexico
- Europe
- Germany
- United Kingdom
- France
- Italy
- NORDIC Countries
- Russia
- Rest of Europe
- Asia-Pacific
- China
- India
- Japan
- South Korea
- ASEAN Countries
- Rest of Asia-Pacific
- South America
- Brazil
- Argentina
- Rest of South America
- Middle East and Africa
- Saudi Arabia
- United Arab Emirates
- South Africa
- Egypt
- Rest of Middle East and Africa
- North America
Data Sources, Market Sizing, and Validation
Desk Research
Desk research starts with building a clear view of upstream activity and reservoir work demand across regions. We reviewed public sources such as the US EIA, the International Energy Agency, the US Geological Survey, and OPEC releases for upstream investment signals and production outlooks. For activity and field trends, we also used sources such as Baker Hughes rig counts and selected national petroleum regulator and ministry publications, where they helped explain local momentum.
We then grounded the model with supply-side information from company annual reports, investor presentations, and press releases that discuss reservoir studies, digital subsurface workflows, and service utilization. Patent databases were checked to understand the pace of analytics and sensing-related filings, which helps stress-test technology adoption assumptions. Where needed, paid subscriptions for company financials and intelligence plus news and financials were used to speed up fact checks and keep timelines consistent. The desk sources listed here are illustrative, and many other public references were also used for collection, validation, and clarification.
Primary Interviews and Surveys
Primary work focused on validating what drives spending in reservoir analysis and how budgets shift between modeling, simulation, monitoring, and sampling work. We spoke with a mix of service providers, subsurface software and workflow specialists, and end users in upstream teams, covering the Americas, EMEA, and APAC to balance offshore and onshore viewpoints. Inputs from these discussions were used to confirm adoption rates for newer analytics, typical project cycles, and practical pricing and utilization patterns that are not visible in public data.
Distribution of primary research fieldwork respondents
| Company type | Respondent position | Region |
|---|---|---|
| Top tier: 28% | CXOs: 15% | APAC: 44% |
| Mid tier: 56% | Functional/Unit leaders: 27% | EMEA: 32% |
| Smaller Players: 16% | Managers: 58% | Americas: 24% |
Market-Sizing & Forecasting
Sizing is built using a top-down approach where upstream activity and reservoir work intensity are translated into a demand pool by region, then split across common reservoir analysis service needs. To keep this practical, we rely on observable signals such as onshore versus offshore project mix, field development and production optimization focus, and the share of unconventional activity, which changes the level of monitoring and modeling required.
Those outputs are cross-checked with selective bottom-up approximations, mainly by using sampled service pricing and volume logic for items like reservoir simulation work, data acquisition and monitoring programs, and reservoir sampling campaigns, followed by adjustments for utilization and project timing gaps. Forecasting is done using scenario analysis, where oil and gas capex direction, offshore project sanctioning pace, and technology uptake (for example, machine-learning assisted analytics and distributed sensing) are varied within ranges confirmed in interviews. When a direct volume proxy is weak in a country, we bridge the gap using regional ratios tied to similar basin types and operator maturity, and then re-validate the implied spending with expert feedback.
Data Validation & Update Cycle
Outputs are checked in several steps before sign-off. First, we compare totals against independent signals such as upstream capex trends, rig activity direction, and major project pipelines, and then investigate any sharp jumps that do not match those signals. Next, assumptions are reviewed across regions to ensure pricing, utilization, and adoption rates stay consistent with how services are procured in practice.
If the model shows unexpected variance, experts are re-contacted to confirm whether the change is real or is coming from a weak input. Reports are refreshed annually, and interim updates are done when material events occur, such as major changes in upstream spending, policy shifts, or step-changes in service demand. Right before delivery, a final analyst pass is completed so the numbers reflect the latest available information.
Mordor Intelligence's Reservoir Analysis Market Size Versus Other Published Estimates
Published market sizes for reservoir analysis can differ even when the topic label looks identical, because the service boundary, the year used, and the way pricing is escalated are not kept consistent across studies. The benchmark table makes these differences easier to see, especially when one estimate is built around upstream demand signals while another relies more on supplier-side rollups.
The table shows a 2025 value of USD 9.62 B (2025), and in Mordor Intelligence's model this reflects reservoir analysis services and related technology workflows tied directly to onshore and offshore upstream activity, rather than bundling broader geoscience, generic drilling logs, or full field operations spending into the same number.
Benchmark comparison
| Source | Market Size | Gaps in Research Methodology |
|---|---|---|
| Mordor Intelligence | USD 9.62 B (2025) | |
| Industry Publisher A | USD 9.45 B (2025) | Uses a narrower service basket in practice, with limited coverage of advanced monitoring and analytics, and applies more conservative pricing progression assumptions, which lowers the 2025 total. |
| Trade Source B | USD 8.25 B (2024) | Uses a different base year and appears to rely on a tighter supplier-defined revenue pool, which can undercount work delivered through integrated contracts and bundled subsurface programs. |
Overall, the spread is mainly explained by what gets counted as reservoir analysis work and how the year and pricing are treated. By keeping the demand triggers visible (activity mix, offshore intensity, and monitoring adoption) and then checking the implied spend against real-world project behavior, the estimate stays traceable to steps that can be repeated and reviewed.


Key Questions Answered in the Report
What is the current value of the reservoir analysis market?
The market generated USD 10.09 billion in 2026 and is projected to reach USD 12.84 billion by 2031.
Which region dominates reservoir analysis spending?
North America leads with 40.52% 2025 revenue share, driven by mature shale plays and advanced digital-oilfield adoption.
What segment is growing fastest in the reservoir analysis market?
Machine-learning assisted analytics is projected to post a 6.88% CAGR through 2031, making it the fastest-expanding technology segment.
How are unconventional reservoirs influencing demand?
Unconventional assets are expected to grow at a 7.06% CAGR as AI-enabled completion design improves recovery, driving higher demand for dynamic simulation and real-time monitoring services.
What impact does CCUS have on reservoir analysis?
Mandatory CO₂ storage assessments in Europe and North America are creating new workflows focused on reservoir suitability and long-term monitoring, expanding the addressable market beyond traditional hydrocarbon applications.
Who are the key players in the reservoir analysis industry?
SLB, Halliburton, and Baker Hughes hold the largest shares, while specialists such as Ikon Science and Resoptima provide niche analytics solutions, especially in digital twins and rock-physics areas.
Page last updated on:


 Your data is secure and never sold or shared.


