
Research Antibodies Market Size and Share
Market Overview
| Study Period | 2020 - 2031 |
|---|---|
| Market Size (2026) | USD 4.68 Billion |
| Market Size (2031) | USD 5.81 Billion |
| Growth Rate (2026 - 2031) | 4.42 % |
| Fastest Growing Market | Asia Pacific |
| Largest Market | North America |
| Market Concentration | Medium |
Major Players *Disclaimer: Major Players sorted in no particular order Image © Mordor Intelligence. Reuse requires attribution under CC BY 4.0. | |
Research Antibodies Market Analysis by Mordor Intelligence
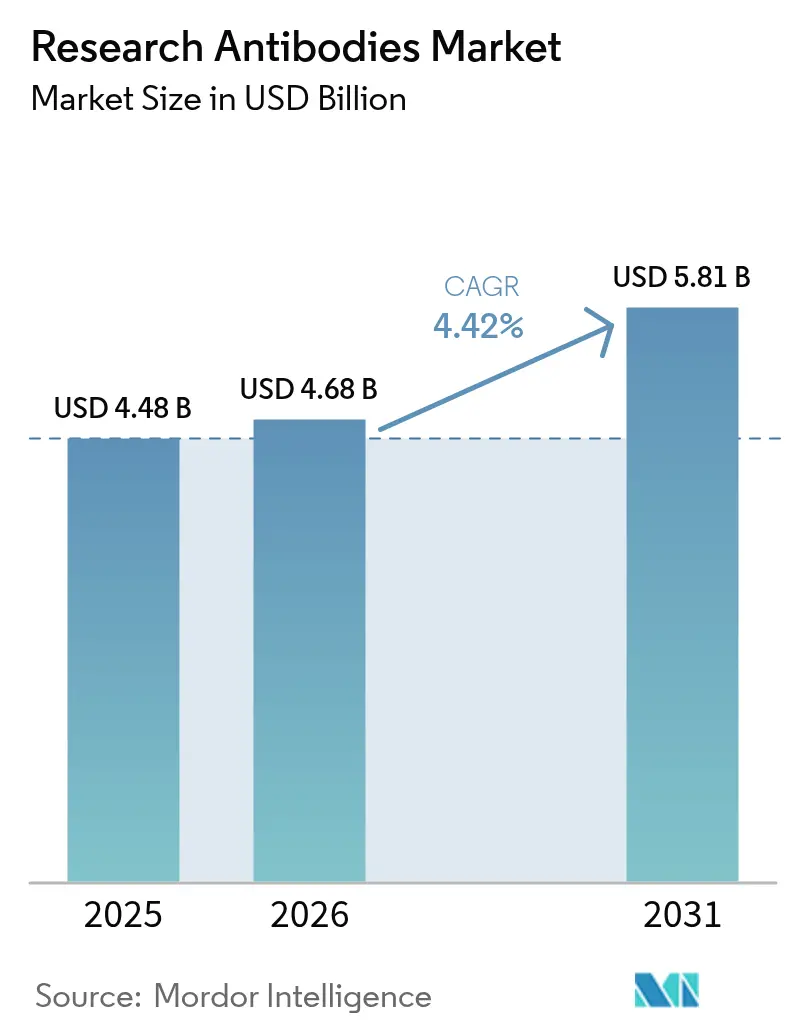
Research Antibodies Market size in 2026 is estimated at USD 4.68 billion, growing from 2025 value of USD 4.48 billion with 2031 projections showing USD 5.81 billion, growing at 4.42% CAGR over 2026-2031.
Robust demand from proteomics, spatial-omics, and outsourced biologics production keeps the research antibodies market on a steady expansion path. The United States Food and Drug Administration's decision in April 2025 to retire mandatory animal testing for monoclonal antibodies is expected to accelerate recombinant production workflows and reduce validation timelines. Simultaneously, AI-enabled design platforms shorten discovery cycles, allowing suppliers to deliver particular binders that tackle the reproducibility crisis affecting many laboratories. Recombinant fragments, camelid-derived single-domain antibodies, and advanced secondary reagents are gaining traction as users seek reproducible performance across multiplexed imaging, CRISPR screens, and precision-diagnostic assays. Regionally, the research antibodies market enjoys broad adoption, yet Asia-Pacific outpaces the global average as Chinese and Japanese biopharmaceutical investments climb.
Key Report Takeaways
- By antibody type, monoclonal antibodies led with 68.74% revenue share in 2025, while recombinant fragments are projected to expand at a 9.98% CAGR through 2031.
- By source species, mouse-derived products held 42.10% of the research antibodies market share in 2025; camelid variants are advancing at an 8.36% CAGR to 2031.
- By product, primary antibodies commanded 58.72% share of the research antibodies market size in 2025, whereas secondary antibodies are set to rise at a 9.34% CAGR between 2026 and 2031.
- By application, immunology captured 31.05% share of the research antibodies market size in 2025; oncology and stem-cell biology segments are growing at an 10.95% CAGR through 2031.
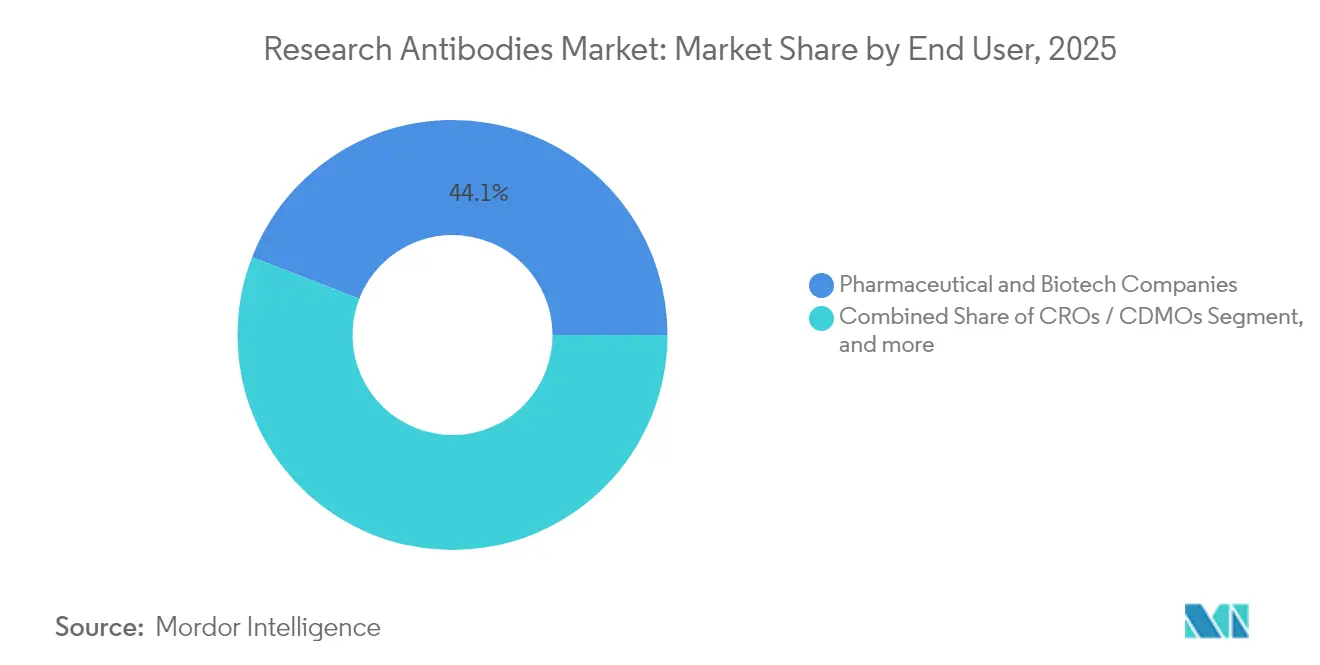
- By end user, pharmaceutical and biotech enterprises accounted for 44.10% revenue share in 2025, and CROs plus CDMOs are projected to expand at a 11.98% CAGR to 2031.
- By region, North America dominated with 43.05% revenue share in 2025, although Asia-Pacific is forecast to post the fastest 8.61% CAGR through 2031.
Note: Market size and forecast figures in this report are generated using Mordor Intelligence’s proprietary estimation framework, updated with the latest available data and insights as of 2026.
Market Trends and Insights
Drivers Impact Analysis of Research Antibodies Market*
| Driver | (~) % Impact on CAGR Forecast | Geographic Relevance | Impact Timeline |
|---|---|---|---|
| Expansion of life-science R&D budgets | +1.2% | North America and European Union | Medium term (2-4 years) |
| Growth of proteomics and genomics projects | +1.5% | Asia-Pacific and North America | Long term (≥ 4 years) |
| Outsourcing boom to CROs and CDMOs | +0.8% | Global with APAC hubs | Short term (≤ 2 years) |
| Adoption of precision-medicine diagnostics | +1.1% | North America and European Union | Medium term (2-4 years) |
| Spatial-omics and single-cell imaging demand | +0.7% | Global research centers | Long term (≥ 4 years) |
| CRISPR screening workflows | +0.6% | Academic clusters in North America and European Union | Medium term (2-4 years) |
| Source: Mordor Intelligence | |||
Continued Expansion of Life-Science R&D Budgets
AbbVie lifted R&D spending by 60% to USD 12.8 billion in 2024, and capital intensity across large pharmaceutical firms supports sustained antibody procurement. The rise in funding comes as biologics pipelines lengthen, and many assays require validated binders to confirm target engagement. Venture investment of USD 34 billion flowed into life-science startups by November 2024, creating fresh demand for high-quality reagents. Because antibody quality is a key variable in experimental reproducibility, global laboratories upgrade inventories to well-characterized formats. As a result, the research antibodies market benefits directly from every incremental dollar invested in therapeutic discovery.
Accelerated Growth of Proteomics & Genomics Projects
Thermo Fisher Scientific acquired Olink for USD 3.1 billion in July 2024, adding a 5,300-protein biomarker panel that depends on rigorously validated antibodies.[1] Spatial transcriptomics platforms unite genetic and protein-level insights, which intensifies the requirement for binders that tolerate multiplexed imaging conditions. AI design engines reduce development cycles from months to days, letting suppliers launch application-specific antibodies in record time. Expansion into neurology and autoimmune research widens the addressable pool of protein targets, reinforcing the growth trajectory of the research antibodies market. The convergence of data-rich ‘omics’ disciplines ensures continuing demand for recombinant and sequence-defined reagents.
Outsourcing Boom to CROs & CDMOs for Antibody Production
Contract manufacturers are projected to control 54% of global biologics capacity by 2028, and Asia is set to host nearly half that capacity. Samsung Biologics already supplies 16 of the top 20 pharmaceutical companies and recently expanded capacity for trispecific and bispecific antibodies.[2]The new FDA guidance that removes mandatory animal testing for monoclonal antibodies is steering sponsors toward organ-on-chip and in-silico validation models that can be outsourced efficiently to specialist partners. Smaller biotechnology firms now access industrial-scale production without heavy capital outlay, boosting the research antibodies market as verified reagents flow into discovery pipelines worldwide.
Rising Adoption of Precision-Medicine Diagnostics
The FDA cleared 55 novel drugs in 2023, many with companion diagnostics that employ antibody-based assays.[3] Antibody-drug conjugates now move beyond oncology into autoimmune and neurological indications, which multiplies the antigen targets under investigation. Record numbers of AI-integrated medical devices approved in 2024 rely on antibodies for real-time biomarker capture. Diagnostic developers therefore require consistent batch quality because assay accuracy determines patient stratification. This dynamic pushes suppliers to standardize recombinant production and to publish extensive validation files, strengthening confidence in the research antibodies market.
Restraints Impact Analysis of Research Antibodies Market*
| Restraint | (~) % Impact on CAGR Forecast | Geographic Relevance | Impact Timeline |
|---|---|---|---|
| High procurement and validation costs | -1.8% | Emerging markets worldwide | Short term (≤ 2 years) |
| Batch-to-batch variability | -1.4% | Global research institutions | Medium term (2-4 years) |
| Rise of aptamers and nanobodies | -0.9% | North America and European Union | Long term (≥ 4 years) |
| Stricter animal-welfare regulations | -0.7% | European Union and North America | Medium term (2-4 years) |
| Source: Mordor Intelligence | |||
High Procurement & Validation Costs for Premium Antibodies
Monoclonal therapeutics can cost between USD 15,624 and USD 143,833 per treatment course, and high-grade research antibodies mirror that pricing pressure. Academic laboratories in lower-income regions often postpone projects or choose lower validation levels because budgets cannot stretch to premium reagents. Validation assays sometimes exceed the price of the antibody itself, since full characterization covers specificity, sensitivity, and lot stability. Although new expression systems cut production expenses, list prices remain elevated due to stringent quality controls. This cost burden restrains adoption and slows the overall research antibodies market in emerging economies.
Batch-to-Batch Variability Causing Reproducibility Issues
The YCharOS consortium revealed that two-thirds of tested antibodies underperformed against manufacturer claims, aggravating the reproducibility crisis. Laboratories incur financial losses when experiments must be repeated, and lost time delays grant deliverables. Researchers now insist on detailed lot validation data before committing funds, prolonging procurement cycles. Suppliers respond with sequence-defined recombinant formats, yet legacy hybridoma products dominate large catalogues and continue to display variability. Until full conversion to recombinant production occurs, variability will temper growth of the research antibodies market.
*Our forecasts treat driver/restraint impacts as directional, not additive. The impact forecasts reflect baseline growth, mix effects, and variable interactions.
Research Antibodies Market Segment Analysis
By Antibody Type:
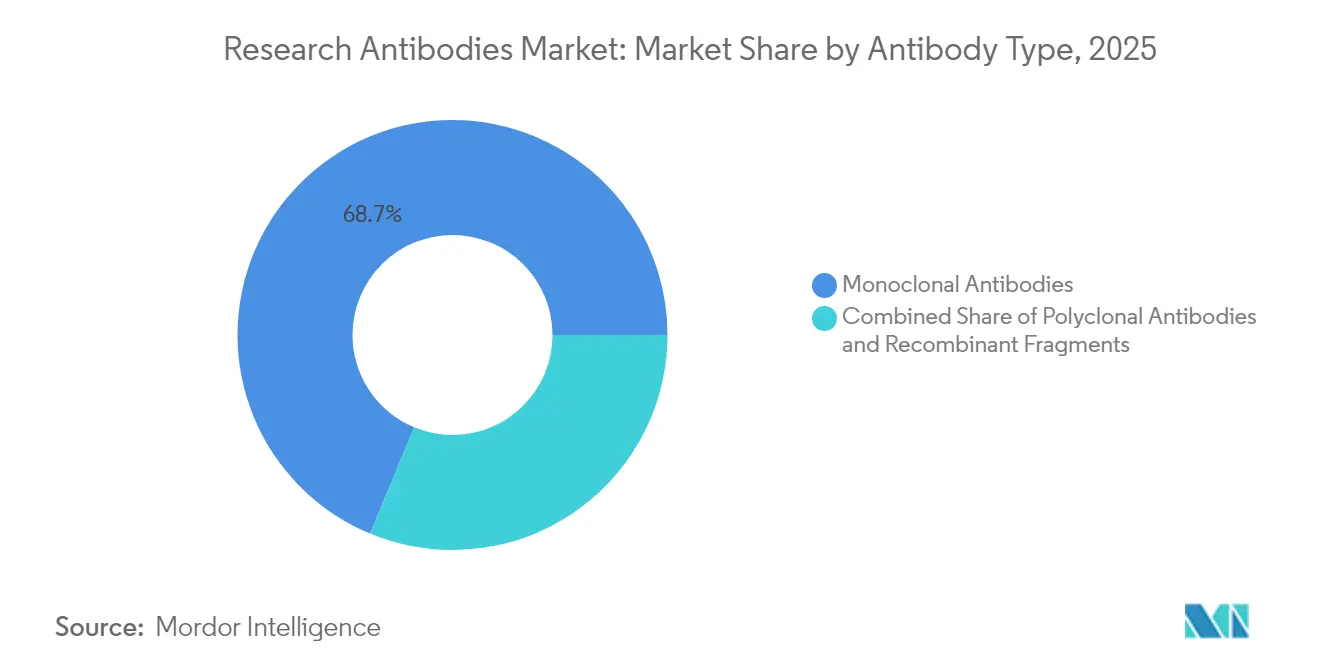
Recombinant Fragments Drive InnovationMonoclonal antibodies delivered 68.74% of 2025 revenue, reflecting their entrenched role in ELISA, Western blot, and flow cytometry protocols. Recombinant fragments such as scFv and Fab pieces register the quickest ascent at a 9.98% CAGR, because users value their defined sequences and lot-to-lot consistency. These fragments eliminate hybridoma drift and can be engineered for enhanced affinity, which supports multiplex imaging and high-throughput screening. The research antibodies market benefits as regulatory agencies endorse sequence-defined reagents for critical validation. Polyclonal antibodies, while less reproducible, retain relevance where multi-epitope binding boosts detection sensitivity.
The FDA removal of obligatory animal testing accelerates uptake of in-vitro recombinant expression systems that shorten production timelines. Humanized formats attract therapeutic developers seeking translatable binders, whereas murine clones continue servicing routine academic assays. Recombinant libraries also integrate seamlessly with AI affinity maturation, advancing bespoke solutions for niche targets. Together these factors keep the research antibodies market centered on innovation in antibody engineering.

By Source Species:
Camelid Innovation Challenges Mouse DominanceMouse-derived products owned 42.10% of demand in 2025 after decades of reliable hybridoma outputs. Camelid single-domain antibodies, however, grow at 8.36% CAGR due to their compact size and access to cryptic epitopes. Their heat resistance and solubility suit harsh assay environments, including intracellular imaging and microfluidic platforms. Rabbit monoclonals remain preferred for high-affinity Western blot detection because of strong antigen recognition.
Emerging transgenic chicken lines promise broad antibody diversity at industrial scale, and goat or donkey antibodies sustain niche roles as secondary reagents with multiple labeling sites. Camelid nanobodies enter therapeutic pipelines for tissue penetration advantages, fueling commercial investment by biotech firms. These species dynamics collectively diversify the research antibodies market and propel specialty reagent development.
By Product:
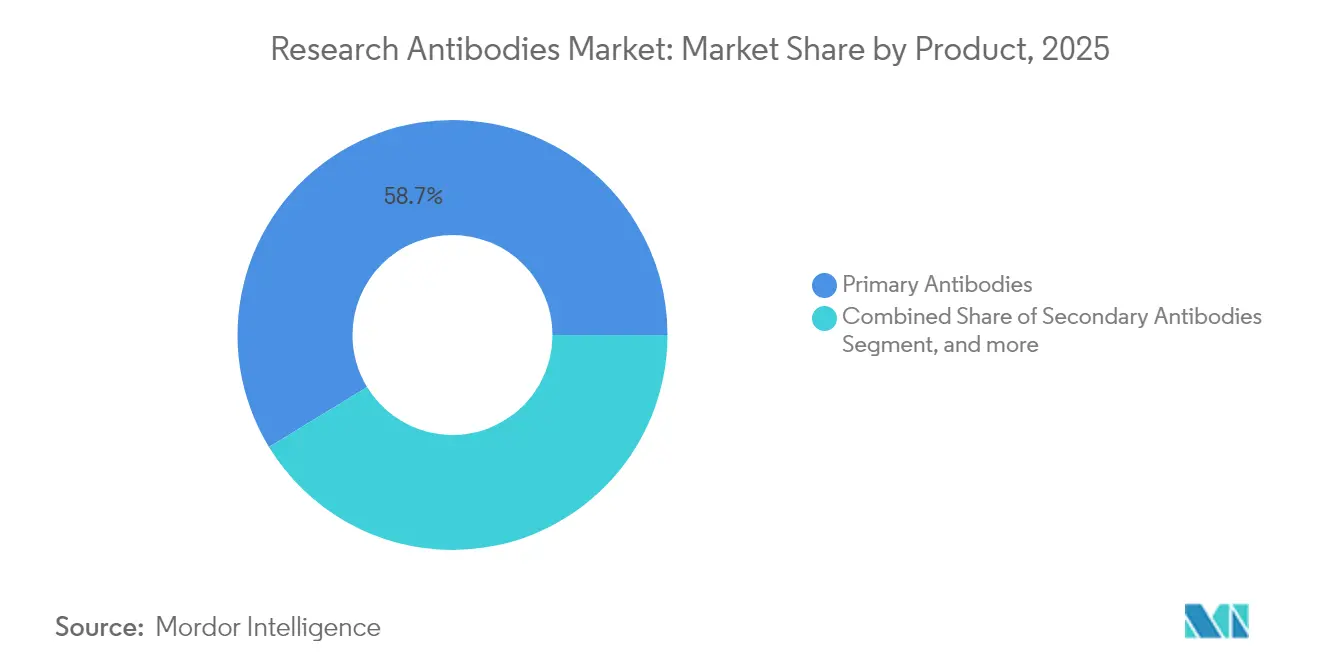
Secondary Antibodies Accelerate in Multiplexed ApplicationsPrimary antibodies accounted for 58.72% of revenue in 2025, underpinning most capture and detection assays. Demand remains steady because every new antigen target still requires a primary binder. Secondary antibodies track a faster 9.34% CAGR as multiplex fluorescence imaging, barcoding, and high-content screens proliferate. Enhanced linker chemistries deliver brighter signals at lower background, expanding utility in single-cell analysis.
Controls and isotype standards occupy a modest but rising share as journals and funders tighten reproducibility requirements. Manufacturers now bundle controls with primary antibodies, encouraging adoption and safeguarding experimental credibility. This trend further anchors the research antibodies market in a quality-first paradigm.
By Application:
Oncology Drives Next-Generation DemandImmunology consumed 31.05% of total revenue in 2025 through studies on adaptive and innate pathways. Oncology and stem-cell biology advance at 10.95% CAGR as CAR-T therapies, bispecific antibodies, and spatial-omics mapping reshape cancer research. Accurate phenotyping of tumor microenvironments relies on multiplexed panels of highly specific binders.
Neuroscience maintains momentum due to intensified exploration of neuroinflammation and neurodegeneration. Infectious disease programs pivot toward rapid outbreak response platforms, expanding the roster of viral and bacterial antigens that require detection. As precision oncology converges with metabolic and autoimmune insights, cross-disciplinary projects buy versatile reagents, strengthening the research antibodies market.
By End User:
CROs Lead Outsourcing RevolutionPharmaceutical and biotech firms represented 44.10% of 2025 demand, funding expansive screening campaigns and GLP validation. CROs and CDMOs rise at 11.98% CAGR as sponsors externalize both discovery and biomanufacturing to manage pipeline risk. Integrated service providers now deliver antibody generation, engineering, and validation in unified packages that shorten time to clinic.
Academic and research institutes sustain a stable baseline but face budget constraints, so they increasingly exploit recombinant fragments for cost-effective consistency. Diagnostic laboratories adopt antibodies for companion tests, while hospital-based precision-medicine centers begin procuring research-grade binders for translational assays. This diversified clientele keeps the research antibodies market resilient across funding cycles.
Geography Analysis
North America Research Antibodies Market
North America held 43.05% of 2025 revenue and benefits from USD 288 billion in pharmaceutical R&D spending, venture capital depth, and regulatory policies that support non-animal validation. Canada’s precision-medicine programs and Mexico’s growing manufacturing base extend regional demand beyond the United States. Consequently, the research antibodies market receives consistent orders tied to oncology, immunology, and high-throughput screening initiatives.
APAC Research Antibodies Market
Asia-Pacific registers an 8.61% CAGR to 2031, driven by China’s leadership in antibody-drug conjugate trials and Japan’s government funding that targets a tripling of biotech output by 2030. South Korea’s strategic investment in cell therapy manufacturing and India’s expanding generic biologics sector amplify reagent consumption. Regional CDMO capacity, projected to reach 45% of global supply by 2028, further anchors the research antibodies market within Asia.
EMEA and South America Research Antibodies Market
Europe exhibits balanced growth supported by stringent validation standards and an overarching shift toward recombinant, animal-free reagents following World Health Organization draft guidelines. Germany and the United Kingdom remain innovation hubs, whereas France, Italy, and Spain benefit from rising biotech start-ups. Middle East, Africa, and South America deliver emerging pockets of demand as clinical research infrastructure matures, extending the research antibodies market footprint into new territories.

Regulatory Landscape
Research antibodies are indirectly affected by broader biologics standardization and streamlined nonclinical expectations, trends that are reinforcing demand for sequence-defined, well-characterized reagents used in discovery and analytical workflows. In the United States, FDA issued draft guidance in December 2025 on streamlined nonclinical safety studies for monoclonal antibodies, emphasizing approaches that reduce non-human primate use. The agency followed with a March 2026 draft Q&A guidance tied to the Biologics Price Competition and Innovation Act for abbreviated licensure pathways for biosimilars under section 351(k). While these policies target therapeutics, they shape supplier validation practices and documentation norms that also carry into research-use catalogs.
International alignment is supported through reference materials and standardization activities. The World Health Organization (WHO) Expert Committee on Biological Standardization (ECBS) continued expanding international biological reference standards, including actions from the October 2025 ECBS meeting and additional recommendations in April 2026. These steps covered new and replacement standards, alongside future standardization projects, and they provide a quality benchmark used by national control authorities and industry. As a result, suppliers have incentives to strengthen antibody characterization, comparability, and lot consistency claims, which laboratories increasingly use to support reproducibility.
Competitive Landscape
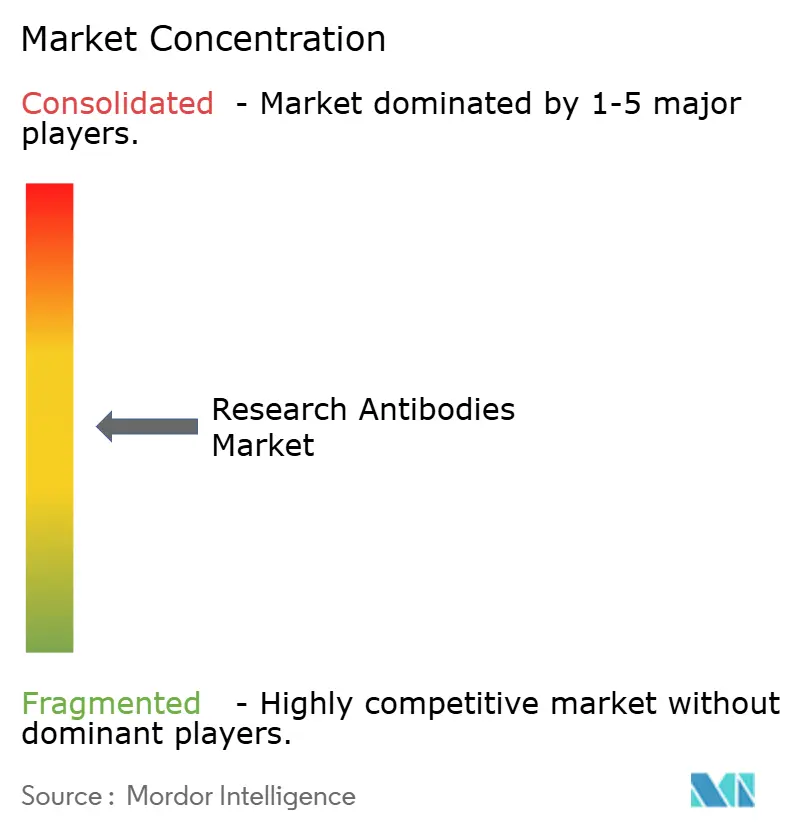
The research antibodies market shows moderate fragmentation with intensifying technological competition. Thermo Fisher Scientific consolidated its proteomics capability through its Olink acquisition, adding high-throughput protein panels that depend on validated antibodies. AbCellera expanded a multi-year partnership with Eli Lilly, demonstrating how computational discovery slashes lead-generation timelines and wins sizeable development contracts.
Traditional catalog suppliers respond by upgrading validation pipelines and launching recombinant versions of high-volume clones, trying to mitigate batch variability. AI-first startups position themselves as innovators that deliver tailor-made antibodies with complete sequencing data. The FDA decision favoring non-animal testing accelerates this pivot, because recombinant platforms align perfectly with the new guidance. Suppliers that combine antibody production with granular validation reports earn preferred-vendor status, shaping purchasing decisions across pharmaceutical and academic buyers. In sum, competitive advantage rests on reproducibility, speed, and integration with digital discovery workflows, and these factors will decide future share shifts in the research antibodies market.
Research Antibodies Industry Leaders
-
Bio-Rad Laboratories, Inc.
-
Abcam plc
-
Merck KGaA
-
Thermo Fisher Scientific
-
Becton, Dickinson and Company
- *Disclaimer: Major Players sorted in no particular order
Research Antibodies Market Companies Covered in this Report
- Abcam
- Thermo Fisher Scientific
- Merck
- Bio-Rad Laboratories
- Cell Signaling Technology
- Agilent Technologies
- PerkinElmer
- Beckton Dickinson
- Roche
- Lonza Group
- GenScript Biotech Corp.
- Santa Cruz Biotechnology Inc.
- Proteintech Group Inc.
- Bio-Techne
- GeneTex Inc.
- Rockland Immunochemicals Inc.
- Jackson ImmunoResearch Labs
- Miltenyi Biotec
- Dianova GmbH
- Creative Diagnostics
Market Opportunities and Future Outlook
A gap is emerging where reproducibility and speed intersect, as users shift away from legacy, variable hybridoma products toward sequence-defined recombinant antibodies, fragments, and specialty secondaries that arrive with richer validation files. The April 2025 FDA step to retire mandatory animal testing for monoclonal antibodies also reinforces non-animal and in-silico or in-vitro validation mindsets, which aligns with recombinant workflows used by research antibody suppliers. External benchmarking pressure is adding to this pull, including YCharOS findings that a large share of tested antibodies underperformed against manufacturer claims, which is pushing labs and procurement teams toward vendors that provide transparent validation and consistent lots.
Opportunities also track procurement patterns around capacity, localization, and toolchain integration, particularly for biopharma and service providers that buy and qualify large volumes of antibodies for screening and analytics. In 2026, several biomanufacturing investments and facility milestones signaled continued buildout around antibody modalities, including Celltrion announcing major capacity expansion at Songdo and in the United States (March 2026), LOTTE Biologics completing and receiving approval for its Songdo Plant 1 (June 2026), and Icosagen completing an expansion of its Estonian GMP site (July 2026). Even though these moves are therapeutic-manufacturing focused, they expand the installed base of antibody development and analytics and support demand for discovery and characterization reagents, along with service models where CROs and CDMOs bundle antibody generation, engineering, and validation into integrated offerings.
Recent Industry Developments in Research Antibodies Market
- June 2026: Merck KGaA, Darmstadt, Germany agreed to acquire Bio-Techne for about USD 11.3 billion, adding a large portfolio of antibodies, cytokines, and growth factors. The deal strengthens scale in life-science reagents and can reshape catalog breadth and pricing power across research antibody workflows.
- October 2025: Merck KGaA signed an agreement to acquire the chromatography business of JSR Life Sciences, including Protein A resin technologies used in monoclonal antibody production, with closing targeted by the end of Q2 2026. Bringing Protein A capabilities in-house tightens Merck's downstream bioprocessing stack, which supports integrated offerings for antibody discovery-to-manufacturing ecosystems.
- October 2024: Thermo Fisher Scientific transitioned 125,000 Invitrogen antibodies to ambient temperature shipping. This logistics change reduces cold-chain dependence and packaging burden, improving fulfillment flexibility for large antibody catalogs and high-frequency lab ordering.
Research Antibodies Market Report Scope and Research Methodology
Market Definition and Coverage
For this methodology, the market covers revenues generated from research-use antibodies that are purchased as reagents for laboratory workflows. This includes primary and secondary antibodies supplied for in vitro experiments across life science and biomedical research.
Scope exclusions: This sizing excludes antibodies sold for therapeutic use, clinical diagnostics, antibody-drug conjugates, and GMP bulk intermediates.
Segments Covered in This Report
- By Antibody Type
- Monoclonal Antibodies
- Murine
- Chimeric
- Humanized
- Human
- Polyclonal Antibodies
- Recombinant Fragments
- Monoclonal Antibodies
- By Source Species
- Mouse
- Rabbit
- Goat
- Donkey
- Camelid
- By Product
- Primary Antibodies
- Secondary Antibodies
- Controls & Isotype Standards
- By Application
- Immunology
- Oncology & Stem-Cell Biology
- Neuroscience
- Infectious Diseases
- Metabolic & Cardiovascular
- Others
- By End User
- Pharmaceutical & Biotech Companies
- CROs / CDMOs
- Academic & Research Institutes
- Diagnostic Laboratories
- Hospitals
- By Geography
- North America
- United States
- Canada
- Mexico
- Europe
- Germany
- United Kingdom
- France
- Italy
- Spain
- Rest of Europe
- Asia-Pacific
- China
- Japan
- India
- Australia
- South Korea
- Rest of Asia-Pacific
- Middle East & Africa
- GCC
- South Africa
- Rest of Middle East & Africa
- South America
- Brazil
- Argentina
- Rest of South America
- North America
Data Sources, Market Sizing, and Validation
Desk Research
Desk work starts by building the demand context for research-use antibodies, and then it is mapped back to what can be produced and sold through typical lab supply channels. We use public science and funding indicators to understand where antibody usage is rising, and we cross-check that with trade and manufacturing signals that can explain supply-side changes.
Common inputs include sources such as NIH funding data, OECD health and R&D statistics, World Bank macro series, UN Comtrade trade flows for relevant lab reagent categories, and peer-reviewed journals that discuss antibody validation trends and adoption in proteomics and immunoassays. We also review company filings, investor presentations, product catalogs, and reputable press to understand portfolio mix, pricing bands, and go-to-market patterns. Where needed, paid subscriptions that cover company financials and intelligence, news and financials, and patent databases are used to confirm timelines and reduce gaps in product and technology tracking. These examples are illustrative only, and the desk sources referenced are not exhaustive because additional public and paid sources were also consulted for data collection, validation, and clarification.
Primary Interviews and Surveys
Primary work focuses on validating what desk sources do not show clearly, specifically purchase volumes, average selling prices, and how mix shifts between primary and secondary antibodies across different lab settings. We speak with a spread of participants across the value chain, including manufacturers, distributors, and frequent end users in academia, biopharma R&D, and service labs. Feedback is balanced across major regions so assumptions do not rely on one geography.
Distribution of primary research fieldwork respondents
| Company type | Respondent position | Region |
|---|---|---|
| Top tier: 33% | CXOs: 12% | APAC: 46% |
| Mid tier: 49% | Functional/Unit leaders: 39% | EMEA: 35% |
| Smaller Players: 18% | Managers: 49% | Americas: 19% |
Market-Sizing & Forecasting
Sizing begins with a top-down build that reconstructs the addressable demand pool from life science R&D activity and typical antibody consumption per workflow. This pool is translated into spend using realistic price bands. To keep the math aligned with purchasing behavior, we use practical inputs such as R&D funding direction, assay and imaging activity levels, antibody validation and reproducibility trends, the mix shift between primary versus secondary antibodies, and the share of custom antibodies used when off-the-shelf options do not fit.
Those totals are then corroborated with selective bottom-up approximations. We sample supplier and channel signals, check catalog breadth and price ladders, and apply sanity checks using sampled ASPs multiplied by estimated volumes for common research protocols. When gaps appear, such as limited visibility on smaller catalog sellers, the model uses conservative fill factors that are stress-tested through distributor and end-user feedback, and then adjusted only when independent checks agree.
For forecasting, scenario analysis is used so growth can be tied to a small set of drivers, including expected R&D budget paths, lab throughput trends, and pricing movement in widely used antibody formats. Expert inputs help set realistic adoption ranges, and the mid-case is selected when multiple respondent groups converge on similar expectations.
Data Validation & Update Cycle
Outputs are checked in a few ways before sign-off, including cross-checks against independent signals like R&D spend direction, publication and experiment activity patterns, and observed pricing movement in common antibody formats. When results move outside expected ranges, assumptions are rechecked, outliers are traced to a specific driver, and follow-up calls are triggered if the reason cannot be explained from existing evidence.
Each report is refreshed annually. Interim updates are made when material events change pricing, supply availability, or the research funding outlook. Before delivery, a final pass is completed so clients receive the latest updated view based on the most recent public data and validation feedback.
Mordor Intelligence's Research Antibodies Market Size Measured Against Other Published Estimates
Published numbers for research antibodies often differ because the included product scope and the assumed demand pool are not the same across studies, even when the title looks identical. Differences also come from how pricing is treated, whether custom antibodies are counted, and how quickly assumptions are refreshed when funding or lab activity changes.
The main gap drivers in this market are whether adjacent categories are added in, such as broader research reagents, diagnostic-use antibodies, or therapeutic-related antibodies, which can inflate totals. Some figures also rely on a single base year and then apply a fixed CAGR without rechecking price bands and mix shift, and currency conversion timing can change the USD view across regions.
Benchmark comparison
| Source | Market Size | Gaps in Research Methodology |
|---|---|---|
| Mordor Intelligence | USD 4.68 B (2026) | |
| Industry Publisher A | USD 5.39 B (2024) | Uses an earlier base year and tends to keep the scope broad, where diagnostic-use demand and certain adjacent antibody categories are not consistently separated from research-use purchasing. |
| Market Report B | USD 10.69 B (2024) | Reports a combined total for antibodies and other research reagents, which lifts the number well beyond antibody-only spend and can mix different pricing bases into one figure. |
The comparison shows that scope expansion into reagents and misalignment in the base year are the biggest reasons the figures are far apart. By keeping the total limited to research-use primary and secondary antibodies and refreshing price-band assumptions when mix shifts show up in interviews, a cleaner antibody-only total is produced by Mordor Intelligence.
Key Questions Answered in the Report
What is the current value of the research antibodies market?
The research antibodies market stands at USD 4.68 billion in 2026 and is forecast to reach USD 5.81 billion by 2031.
Which antibody format is growing fastest?
Recombinant fragments record the highest growth, rising at a 9.98% CAGR because of superior reproducibility and known sequences.
Why is Asia-Pacific the fastest-growing region?
Strong investment in antibody-drug conjugate trials, expanding CDMO capacity, and supportive government funding in China, Japan, and South Korea underpin an 8.61% CAGR in Asia-Pacific.
How does the FDA animal-testing phaseout affect suppliers?
The 2025 guidance encourages recombinant production and in-vitro validation, prompting suppliers to scale sequence-defined antibody platforms.
What is driving demand for secondary antibodies?
Multiplexed imaging and single-cell assays require bright, low-background detection reagents, which pushes secondary antibody sales at a 9.34% CAGR.
How are CROs influencing the market?
Outsourcing trends mean CROs and CDMOs grow at a 11.98% CAGR as they provide integrated antibody discovery, engineering, and validation services that shorten development timelines.