
Remote Monitoring And Control Market Size and Share
Market Overview
| Study Period | 2020 - 2031 |
|---|---|
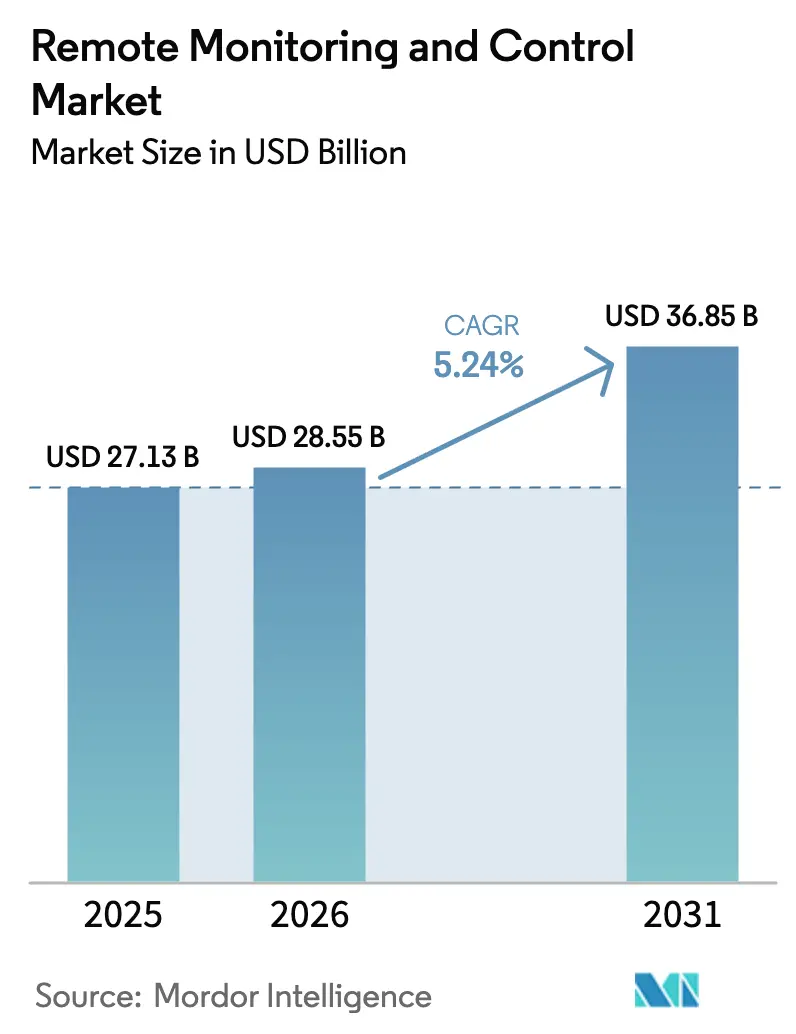
| Market Size (2026) | USD 28.55 Billion |
| Market Size (2031) | USD 36.85 Billion |
| Growth Rate (2026 - 2031) | 5.24% CAGR |
| Fastest Growing Market | Asia-Pacific |
| Largest Market | North America |
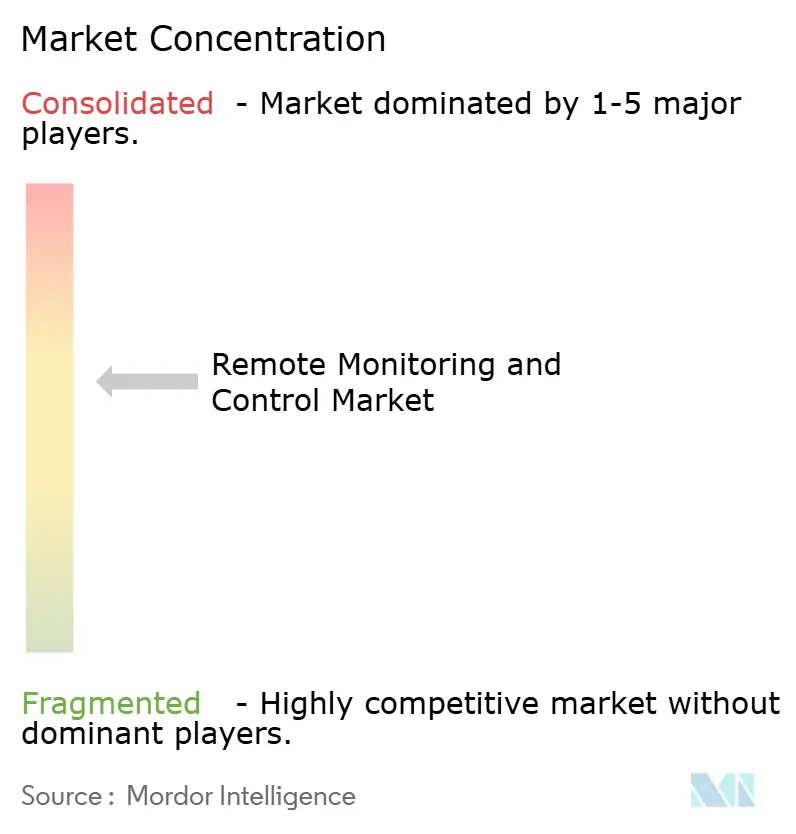
| Market Concentration | Medium |
Major Players *Disclaimer: Major Players sorted in no particular order Image © Mordor Intelligence. Reuse requires attribution under CC BY 4.0. | |
Remote Monitoring And Control Market Analysis by Mordor Intelligence
The remote monitoring and control market size is expected to grow from USD 27.13 billion in 2025 to USD 28.55 billion in 2026 and is forecast to reach USD 36.85 billion by 2031 at 5.24% CAGR over 2026-2031. Growth reflects the convergence of operational technology and advanced connectivity, stricter carbon-tracking rules, and rising IIoT deployments that cut downtime and maintenance costs. [1]Environmental Protection Agency, “Revisions and Confidentiality Determinations for Data Elements Under the Greenhouse Gas Reporting Rule,” epa.gov Private 5G networks and edge-AI controllers now deliver real-time analytics in hazardous sites, trimming field visits and improving safety. Cloud-native SCADA platforms reduce capital outlay, while subscription pricing opens the technology to smaller operators. Oil and gas keeps the largest user share, but life-science facilities adopt remote monitoring rapidly to meet new FDA digital-device guidance. Regionally, North America leads on the strength of environmental regulations, whereas Asia-Pacific shows the fastest expansion thanks to automation investments and large infrastructure projects.
Key Report Takeaways
- By component, solutions dominated with 59.70% of remote monitoring and control market share in 2025; field instruments are forecast to rise at an 7.86% CAGR through 2031.
- By deployment mode, on-premise systems held 58.05% share of the remote monitoring and control market in 2025, while cloud platforms are advancing at a 9.12% CAGR to 2031.
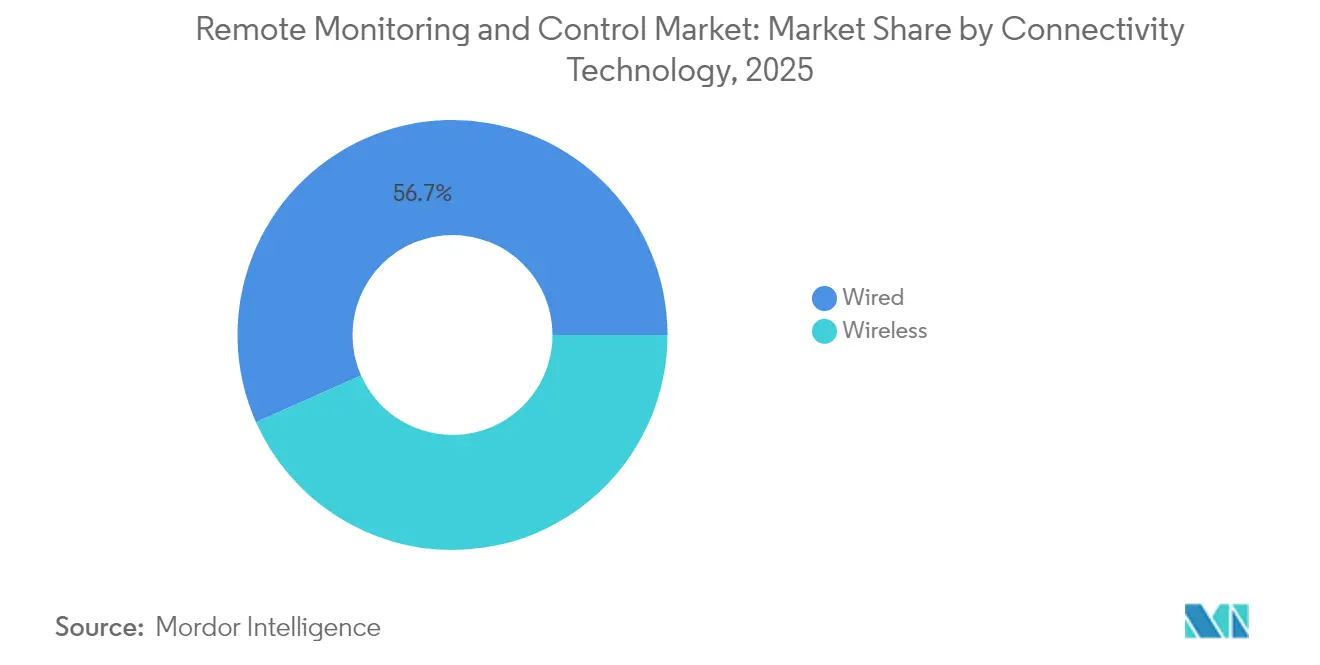
- By connectivity, wired networks accounted for 56.65% share, yet wireless technologies are expanding at an 8.43% CAGR through 2031.
- By end-user industry, oil and gas led with 22.05% revenue share in 2025; pharmaceuticals and life sciences are projected to grow at a 7.38% CAGR to 2031.
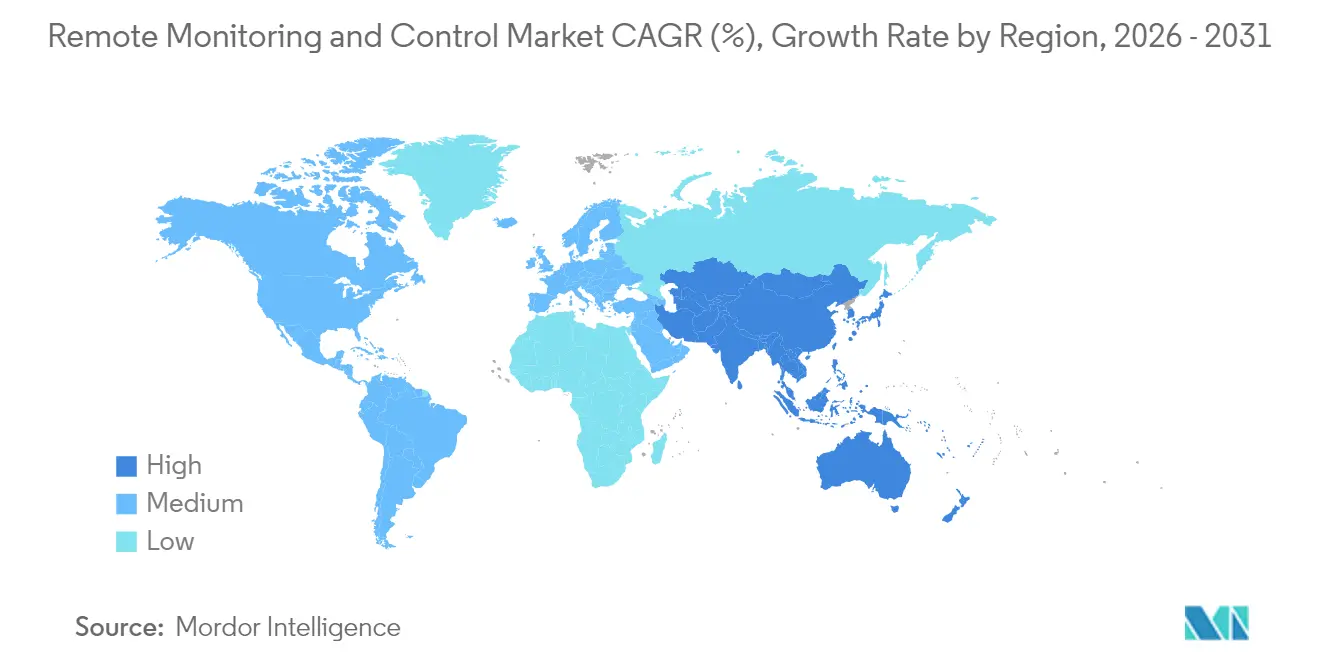
- By geography, North America commanded 33.85% of the remote monitoring and control market size in 2025, while Asia-Pacific is set to expand at an 7.95% CAGR between 2026 and 2031.
Note: Market size and forecast figures in this report are generated using Mordor Intelligence’s proprietary estimation framework, updated with the latest available data and insights as of 2026.
Global Remote Monitoring And Control Market Trends and Insights
Drivers Impact Analysis*
| Driver | (~) % Impact on CAGR Forecast | Geographic Relevance | Impact Timeline |
|---|---|---|---|
| Rising demand for industrial automation | +1.2% | Global; strongest in APAC and North America | Medium term (2-4 years) |
| Increasing use of industrial mobility and remote management | +0.8% | Global; concentrated in oil and gas and mining regions | Short term (≤ 2 years) |
| Expanding IIoT-enabled predictive maintenance programs | +1.0% | North America and EU lead; APAC adoption accelerating | Medium term (2-4 years) |
| Proliferation of edge-AI controllers in hazardous sites | +0.7% | Global; early uptake in developed markets | Long term (≥ 4 years) |
| Stricter carbon-tracking regulations needing real-time data | +0.9% | North America and EU primary; expanding to APAC | Short term (≤ 2 years) |
| Emerging private-5G networks for ultra-reliable low-latency links | +0.6% | Global; industrial clusters leading deployment | Long term (≥ 4 years) |
| Source: Mordor Intelligence | |||
Rising demand for industrial automation
Manufacturers view automation as a primary lever for offsetting labor shortages and boosting throughput. Private 5G networks built by Rockwell Automation and Nokia support real-time control over Citizens Broadband Radio Service spectrum, enabling autonomous operations in discrete and process plants. [2]Rockwell Automation, “Digital Transformation through 5G Standalone (SA),” rockwellautomation.com Collaborative robots, AI vision, and predictive analytics now run side-by-side on unified platforms, letting operators re-configure production lines with minimal downtime. The result is lower cost per unit and safer work environments. Similar benefits appear in mining and petrochemical facilities where wireless sensors alert technicians before a fault escalates. Companies that delay adoption risk competitive erosion as peers capture savings from faster cycle times and reduced scrap.
Expanding IIoT-enabled predictive maintenance programs
FactoryTalk Analytics Guardian AI uses machine-learning models at the asset layer to catch anomalies early, extending equipment life and shrinking spare-parts inventories. [3]Rockwell Automation, “Advancements in Predictive Maintenance & the IIoT,” rockwellautomation.com Edge computing allows vibration and temperature data to be processed locally, cutting cloud bandwidth and providing instant feedback for maintenance crews. In harsh mining locations, wireless gateways stream health metrics from haul-truck drivetrains, enabling just-in-time service that maximizes fleet availability. Manufacturers similarly track spindle wear on CNC machines, avoiding costly unplanned shutdowns. Across industries, these programs translate into consistent OEE improvements and measurable ROI within one budget cycle.
Proliferation of edge-AI controllers in hazardous sites
Autonomous robots now drill and haul ore while transmitting real-time telemetry that protects workers from blast zones. Edge-AI vision systems watch for gas leaks on offshore rigs and trigger automatic shutdowns in seconds. Battery-backed processors onboard each device ensure continuity if connectivity drops, meeting safety-integrity targets. Vendors have bundled AI chips inside smart cameras, removing the need for bulky servers in explosive areas. The technology also feeds compliance reports automatically, easing audit workloads. As costs decline, adoption is shifting from pilot projects to multi-site rollouts in chemicals, power, and logistics.
Stricter carbon-tracking regulations needing real-time data
The EPA’s updated Greenhouse Gas Reporting Rule makes continuous emissions monitoring mandatory for facilities emitting 25,000 metric tons of CO₂e or more. Oil and gas producers have begun replacing manual checks with laser-based sensors that capture methane leaks every second. TotalEnergies targets a 60% methane-emission cut by 2025, using cloud-linked detectors that sync with existing SCADA layers. Automated logs help verify compliance and avoid penalties, while also revealing energy-efficiency opportunities. The result is a dual benefit of regulatory certainty and operating-cost reduction, reinforcing the business case for real-time monitoring upgrades.
Restraints Impact Analysis*
| Restraint | (~) % Impact on CAGR Forecast | Geographic Relevance | Impact Timeline |
|---|---|---|---|
| High initial CAPEX and complex brown-field integration | -0.8% | Global; particularly affects SMEs in developing markets | Short term (≤ 2 years) |
| Cyber-security vulnerabilities in OT-IT convergence | -0.6% | Global; heightened concerns in critical infrastructure | Medium term (2-4 years) |
| Skilled workforce shortage for multi-vendor platforms | -0.5% | North America and EU most affected; emerging in APAC | Long term (≥ 4 years) |
| Legacy protocol lock-in limiting interoperability | -0.4% | Global; notable in established industrial regions | Medium term (2-4 years) |
| Source: Mordor Intelligence | |||
High initial CAPEX and complex brown-field integration
Retrofitting decades-old pumps, drives, and valves with modern sensors often requires custom gateways and protocol converters. Engineering teams must stage upgrades carefully to keep plants running, lengthening project timelines and inflating budgets. Water utilities upgrading to advanced SCADA face the added burden of mapping thousands of I/O points while maintaining regulatory reporting. These factors delay decision-makers, particularly in resource-constrained municipalities and SMEs, despite clear long-term savings.
Cyber-security vulnerabilities in OT-IT convergence
Connecting previously air-gapped control networks exposes programmable logic controllers to ransomware and phishing attacks. Emerson advocates zero-trust frameworks that authenticate every device and enforce least-privilege policies. Yet many operators lack specialists who understand both IT firewalls and OT protocols. Auditing and patch management remain onerous across multi-vendor environments, which can include gear installed 20 years ago. Budget holders must balance cyber-risk mitigation with production targets, slowing adoption in certain verticals.
*Our forecasts treat driver/restraint impacts as directional, not additive. The impact forecasts reflect baseline growth, mix effects, and variable interactions.
Segment Analysis
By Component: Solutions Dominate Hardware Transition
Solutions accounted for 59.70% of remote monitoring and control market share in 2025, affirming the shift toward software-centric architectures. Cloud dashboards, analytics engines, and cybersecurity modules form the digital backbone that binds diverse field devices. Vendors bundle licensing, updates, and support into subscription plans that trim upfront costs and smooth cash flow. Field instruments, while holding a smaller slice, represent the fastest-growing sub-segment at an 7.86% CAGR. Smart sensors embed microcontrollers that run local diagnostics, easing network traffic and ensuring resilience during link outages. Early adopters report fewer site visits and quicker anomaly detection, which feeds back into efficiency gains.
Field instruments’ rise also signals a broader move to edge intelligence. Devices now host algorithms that once lived on centralized servers, compressing data before transfer and cutting cellular fees. This evolution widens the remote monitoring and control market as firms attach low-cost nodes to legacy pumps, motors, and conveyors. Software publishers, in turn, enhance their platforms with drag-and-drop configuration, helping non-specialists deploy new sensor packs. The combined momentum of smarter hardware and agile software underpins steady expansion of the remote monitoring and control industry across diverse plants and utilities.


By Deployment Mode: Cloud Acceleration Reshapes Infrastructure
On-premise systems kept 58.05% share of the remote monitoring and control market in 2025, reflecting entrenched investment and regulatory data-residency rules. They remain vital where sub-second control loops govern safety-critical processes. Yet cloud deployments are rising at a 9.12% CAGR as firms favor scalability and lower maintenance overhead. Emerson’s DeltaV SaaS SCADA exemplifies this swing by delivering secure browser access and elastic compute for analytics.
Hybrid topologies now blend edge servers for latency-sensitive tasks with cloud layers for long-term optimization. Such designs let operators modernize without discarding sunk-cost assets, accelerating the remote monitoring and control market size expansion. Standardized APIs streamline data export into enterprise resource-planning suites, turning plant metrics into financial dashboards. As 5G coverage broadens, bandwidth constraints ease, making full-cloud control viable even for high-speed production lines.
By Connectivity Technology: Wireless Innovation Drives Transformation
Wired Ethernet and fieldbus links still carry 56.65% of plant traffic thanks to deterministic performance and electromagnetic immunity. However, wireless nodes are gaining fastest at an 8.43% CAGR. LPWAN protocols like LoRaWAN and NB-IoT enable battery-powered sensors to report once every minute for several years, ideal for remote pipelines and tank farms. Private 5G adds gigabit-speed, ultra-reliable links for autonomous haul trucks and collaborative robots.
These breakthroughs extend the remote monitoring and control market into terrains once deemed unreachable. Maintenance crews receive vibration alerts on handheld tablets instead of walking miles to inspect equipment. Meanwhile, mesh topologies self-heal around obstacles, raising uptime. Interoperability standards such as OPC UA FX over TSN reduce lock-in fears, broadening adoption across conservative industries.
By End-User Industry: Oil and Gas Leadership Faces Pharmaceutical Challenge
Oil and gas retained 22.05% of revenue in 2025, driven by pipeline integrity, flare management, and offshore platform surveillance. Electro-hydraulic valves and all-electric subsea trees from Baker Hughes supply granular process control while cutting hydraulic leakage risks. Yet pharmaceuticals and life sciences now outpace others at a 7.38% CAGR as FDA guidance for AI-enabled devices pushes plants toward continuous environmental monitoring.
Regulated cleanrooms demand constant logging of temperature, humidity, and airborne particles. Remote dashboards flag deviations instantly, reducing batch rejections and safeguarding patient safety. These strict requirements enlarge the remote monitoring and control market size among life-science firms. Utilities, chemicals, and food processors also expand spend to meet traceability rules and sustainability targets, diversifying vendor revenue streams and cushioning sector dependence on hydrocarbons.
Geography Analysis
North America led the remote monitoring and control market with 33.85% share in 2025, anchored by the United States’ stringent emissions legislation and broad IIoT maturity. Federal infrastructure funds stimulate upgrades in water and wastewater utilities, while shale operators fit methane-detection arrays to comply with the 2025 EPA rule. Canada augments demand through carbon price mechanisms that reward real-time energy analytics. Mexico’s automotive clusters digitalize assembly lines to maintain export competitiveness, ensuring steady regional inflows for solution providers.
Asia-Pacific, projected to rise at an 7.95% CAGR, benefits from China’s smart-manufacturing subsidies and India’s production-linked incentive schemes. Semiconductor fabs in Taiwan and South Korea deploy private 5G to orchestrate mobile robots, while Australian miners automate haulage in remote deserts. ASEAN nations invest in smart-city water grids that rely on cloud SCADA to minimize leakage. This diverse set of projects expands the remote monitoring and control market footprint across developing and advanced economies alike.
Europe records consistent uptake as companies chase Green Deal targets and adopt predictive maintenance to offset high energy costs. German automotive OEMs retrofit legacy lines with edge gateways, whereas UK utilities adopt SaaS SCADA to modernize century-old networks under tight budgets. The Middle East leverages oil revenue to digitize gas processing trains, and South Africa pilots smart-grid telemetry in mining towns. Together, these efforts highlight a global demand curve that is both geographically widespread and use-case specific.

Regulatory Landscape
Regulation for remote monitoring and control is tightening around product-level cybersecurity and governance of remote access, particularly for critical infrastructure and IoT-connected assets. In the United States, the Federal Energy Regulatory Commission (FERC) approved NERC CIP Reliability Standard CIP-003-11 in March 2026, strengthening requirements intended to mitigate coordinated cyberattacks on low-impact Bulk Electric System cyber systems that can include remote connectivity pathways.
Cybersecurity guidance is also converging toward lifecycle controls for connected devices and the remote data-processing components that support them. NIST published NIST IR 8259 Revision 1 in April 2026 (foundational cybersecurity activities for IoT product manufacturers) and released an initial public draft of NIST SP 800-213 Revision 1 in June 2026 (IoT product cybersecurity guidelines for the federal government). In the European Union, the Cyber Resilience Act (CRA) adds compliance obligations around vulnerability handling and reporting, with key CRA applicability milestones in 2026, including Chapter IV becoming applicable on 11 June 2026 and mandatory reporting obligations for actively exploited vulnerabilities taking effect on 11 September 2026.
Value Chain Analysis
The value chain spans field-layer devices (sensors, transmitters, PLCs/RTUs, gateways), industrial connectivity (wired industrial Ethernet/fieldbus, LPWAN, private 5G, and carrier networks), and software layers that deliver SCADA/HMI, historians, analytics, and remote-operations workflows, followed by integration and lifecycle services. Platform vendors and automation OEMs package cloud-native dashboards, cybersecurity modules, and device management with subscription pricing, while system integrators handle brownfield protocol conversion, control-loop engineering, and validation in regulated plants.
Recent proof points show the chain moving toward edge-to-cloud control and network-enabled remote operations. NTT and Toshiba demonstrated long-distance production-equipment control using IOWN APN and a cloud-based PLC with a 20 ms control cycle (November 2025). HAZAMA ANDO and NTT launched a remote tunnel-construction management initiative using IOWN across distances up to 1,000 km (August 2025). At the deployment layer, solutions such as cellular or Wi-Fi add-ons for micro-PLC monitoring aim to reduce onsite IT and firewall bottlenecks, while recurring constraints center on IT security approvals, proprietary ecosystem lock-in, and access to low-latency, high-reliability connectivity needed for real-time remote command execution.
Competitive Landscape
The competitive arena remains moderately concentrated. Multinationals such as ABB, Siemens, Schneider Electric, Emerson, Honeywell, and Yokogawa offer end-to-end stacks spanning sensors to analytics. Their global service arms and deep domain expertise keep switching costs high. To defend share, incumbents acquire niche software firms that add AI engines, cybersecurity modules, or cloud orchestration features. Siemens, for instance, unveiled the Simatic Automation Workstation, which shifts PLC logic into a virtualized environment and reduces hardware SKUs.
Challengers such as Inductive Automation and ICONICS court mid-tier manufacturers with browser-based tools that deploy in hours rather than months. Subscription pricing resonates with CFOs wary of large capital layouts. Partnerships between automation vendors and telecom carriers further reshape value chains; private 5G offerings bundle radios, SIMs, and remote-monitoring apps under one SLA. This convergence blurs traditional product boundaries and intensifies feature wars around latency, cybersecurity, and scalability.
White-space opportunities appear in pharmaceutical cleanroom monitoring, edge-AI video analytics for worker safety, and microgrid optimization for renewable assets. Vendors able to certify solutions under multiple regulatory regimes hold an edge. Meanwhile, the shift to zero-trust security drives demand for integrated identity management across PLCs and cloud APIs, rewarding firms with proven frameworks. As ecosystems mature, differentiation will hinge less on hardware specs and more on software agility and lifecycle services.
Remote Monitoring And Control Industry Leaders
ABB Ltd.
Emerson Electric Co.
Honeywell International Inc.
Schneider Electric SE
General Electric Co.
- *Disclaimer: Major Players sorted in no particular order

Market Opportunities and Future Outlook
Energy management and industrial electrification workflows are expanding the addressable scope for remote monitoring and control, particularly where storage, distributed energy resources, and facility operations require coordinated telemetry and dispatch. HiTHIUM and Turbo Energy deployed an AI-driven energy management platform across 15 European industrial facilities totaling 366 MWh of battery storage (June 2026), which illustrates demand for integrated monitoring, optimization, and control across multi-site footprints.
Industrial networking and data standardization efforts also create whitespace for vendors that connect shop-floor and field assets to enterprise and grid interfaces with lower integration friction. In the United States, proposed legislation such as the FLOWS Act (S. 3967, 2026) targets grants for rural water utilities to adopt digital infrastructure including remote sensing and real-time monitoring, aligning with the sector need to modernize SCADA and improve leak and fault detection. In the United Kingdom, DESNZs post-2025 smart metering framework includes funded communications hub-only exchanges to support a transition to 4G services, reinforcing demand for interoperable, remotely managed endpoints and secure data pathways. Alongside these programs, observed industry emphasis is shifting from predictive maintenance alerts toward prescriptive maintenance workflows, showcased at Hannover Messe 2026, increasing demand for remote operations platforms that can close the loop from detection to action across distributed assets.
Recent Industry Developments
- June 2026: ABB launched Grinding Connect, a cloud-based software suite for remote monitoring and predictive maintenance of gearless mill drive systems, integrating more than 180 trend signals. The release strengthens ABBs digital service stack in mining by packaging condition monitoring, analytics, and remote support into a scalable offer for critical, high-value rotating assets.
- November 2025: Emerson was selected to automate South32s Hermosa mine in Arizona, deploying integrated remote operations and centralized control software. The win expands Emersons footprint in large greenfield industrial projects where remote monitoring, safety instrumentation, and control-room consolidation are procured as a unified architecture.
- December 2024: Schneider Electric announced new solutions aimed at energy and sustainability management for AI-driven, high-density data center infrastructure, including AI-enabled monitoring and software. This strengthens the role of advanced electrical and energy monitoring in remote operations, widening demand beyond classic process industries into data center power and cooling ecosystems.


Research Methodology Framework and Report Scope
Market Definition and Coverage
This market covers spending on industrial remote monitoring and control solutions that connect field assets to operators, so teams can track conditions, raise alarms, and execute control actions from a remote control room.
Scope exclusions: We exclude consumer remote monitoring devices, pure IT network monitoring software, and standalone maintenance contracts that are not bundled with monitoring or control capability.
Segmentation Overview
- By Component
- Solutions
- Field Instruments
- By Deployment Mode
- On-premise
- Cloud
- By Connectivity Technology
- Wired
- Wireless
- By End-user Industry
- Oil and Gas
- Power Generation and Utilities
- Chemicals and Petrochemicals
- Metals and Mining
- Water and Wastewater
- Food and Beverages
- Pharmaceuticals and Life Sciences
- Pulp and Paper
- Semiconductor and Electronics
- Other End-user Industries
- By Geography
- North America
- United States
- Canada
- Mexico
- South America
- Brazil
- Argentina
- Chile
- Rest of South America
- Europe
- Germany
- United Kingdom
- France
- Italy
- Spain
- Russia
- Rest of Europe
- Asia-Pacific
- China
- India
- Japan
- South Korea
- Malaysia
- Singapore
- Australia
- Rest of Asia-Pacific
- Middle East and Africa
- Middle East
- United Arab Emirates
- Saudi Arabia
- Turkey
- Rest of Middle East
- Africa
- South Africa
- Nigeria
- Rest of Africa
- Middle East
- North America
Data Sources, Market Sizing, and Validation
Desk Research
To set the market boundaries and build the initial demand map, we started with public, non-paywalled references such as the US Energy Information Administration (EIA), US EPA rules and compliance documents, the International Energy Agency (IEA), Eurostat industrial statistics, and World Bank macro series. These inputs helped frame where remote operations are most common, including utilities, oil and gas, and process industries, and they also supported reasonable adoption and replacement-cycle ranges.
We also reviewed company annual reports, investor decks, product catalogs, and reputable press coverage to understand how monitoring platforms are packaged, for example hardware gateways, software subscriptions, and integration. Where needed, we used paid subscriptions for company financials and intelligence, news and financials, patent databases, and an import-export shipment-level database to cross-check installed base signals and pricing movements. The desk sources listed above are illustrative, and many other public documents were used to collect data, validate assumptions, and clarify definitions.
Primary Interviews and Surveys
Primary calls and structured surveys were used to pressure-test the scope and ensure the model matched how monitoring and control are deployed at sites. We spoke with a mix of solution providers, system integrators, and end users, including operations, maintenance, and engineering leaders across major regions, so gaps from desk research, such as typical contract structure and upgrade timing, could be closed.
Distribution of primary research fieldwork respondents
| Company type | Respondent position | Region |
|---|---|---|
| Top tier: 38% | CXOs: 15% | APAC: 47% |
| Mid tier: 47% | Functional/Unit leaders: 37% | EMEA: 29% |
| Smaller Players: 15% | Managers: 48% | Americas: 24% |
Market-Sizing & Forecasting
Sizing used a combined top-down and bottom-up logic. We reconstructed production, capacity, and operating site counts by region and industry, then filtered those totals through adoption rates for connected monitoring and remote control. Those adoption rates were anchored using indicators practitioners track, such as SCADA and telemetry rollout intensity, the number of remote or unmanned sites, regulatory inspection and emissions-monitoring requirements, and the pace of modernization in utilities and process plants.
To keep totals realistic, we corroborated results with selective bottom-up approximations, including sampled average selling price (ASP) ranges for gateways, sensors, software subscriptions, and integration services, multiplied by estimated deployment volumes and refresh cycles. Where the bottom-up view had gaps, for example private integrators with limited disclosures, we filled them using peer pricing bands and channel checks, and then adjusted only if multiple signals pointed in the same direction.
Forecasting relied mainly on scenario analysis, since spending moves with capex cycles and reliability initiatives, not only GDP. We carried forward a base case using primary feedback on budget direction, then varied the path using inputs like industrial output, energy capacity additions, and connectivity availability in remote areas.
Data Validation & Update Cycle
Model outputs were checked against independent signals such as automation spending proxies, industrial production movement, and visible tender activity for remote operations projects. If an assumption created an unusual jump in a region or end-use, it was flagged, reworked, and reviewed again before sign-off.
Reports are refreshed annually, and interim updates are made when material changes affect pricing, supply availability, or deployment cadence. Before delivery, an analyst performs a fresh pass on the core inputs so clients receive the most current view available at the time of publication.
Mordor Intelligence's Remote Monitoring and Control Market Sizing Compared With Other Published Estimates
Market size figures for remote monitoring and control can differ across published sources because the service boundary is not always handled the same way, and pricing can be treated as a one-time license in one study and as recurring subscription revenue in another. Differences also show up when older base-year assumptions are rolled forward without a clean check against current industrial activity.
In our model, the price deck and currency conversion are refreshed as part of the annual update cycle, and then validated against recent contract patterns and mix shifts between hardware, software, and integration, which is where Mordor Intelligence reduces drift that can build up in longer forecast runs.
Benchmark comparison
| Source | Market Size | Gaps in Research Methodology |
|---|---|---|
| Mordor Intelligence | USD 28.55 B (2026) | |
| Trade Journal A | USD 25.70 B (2022) | Uses an earlier base year and extends growth with a smoother curve, and the scope leans more toward field instruments while undercounting software subscriptions in later years. |
| Global Forecast Service B | USD 24.81 B (2024) | Applies a narrower definition around core monitoring equipment, and uses a slower ASP progression that does not fully reflect the shift toward subscription and integration-heavy deals. |
The table shows that the spread is mainly explained by base-year timing and how recurring software and integration revenue is counted. By keeping assumptions tied to observable deployment activity and repeatable price logic, the estimate remains traceable and easier to reconcile with what buyers see in the field.


Key Questions Answered in the Report
What is the current value of the remote monitoring and control market?
The market is valued at USD 28.55 billion in 2026 and is forecast to reach USD 36.85 billion by 2031.
Which segment is growing fastest within the remote monitoring and control market?
Cloud deployment leads growth at a 9.12% CAGR, reflecting demand for scalable, subscription-based platforms.
Why are pharmaceuticals adopting remote monitoring rapidly?
FDA guidance on digital health technologies requires continuous cleanroom and process monitoring, driving a 7.38% CAGR in the segment.
How do private 5G networks enhance remote monitoring?
They deliver ultra-reliable, low-latency links that support autonomous equipment and real-time analytics in demanding industrial settings.
What is the main restraint hindering wider adoption?
High initial capital expenditure and complex brown-field integration slow projects, particularly for smaller operators.
Which region shows the highest growth potential?
Asia-Pacific is projected to expand at an 7.95% CAGR to 2031, propelled by large automation investments in China, India, and Southeast Asia.
Page last updated on:






