
Rehabilitation Equipment Market Size and Share
Market Overview
| Study Period | 2020 - 2031 |
|---|---|
| Market Size (2026) | USD 20.16 Billion |
| Market Size (2031) | USD 28.12 Billion |
| Growth Rate (2026 - 2031) | 6.88 % |
| Fastest Growing Market | Asia-Pacific |
| Largest Market | North America |
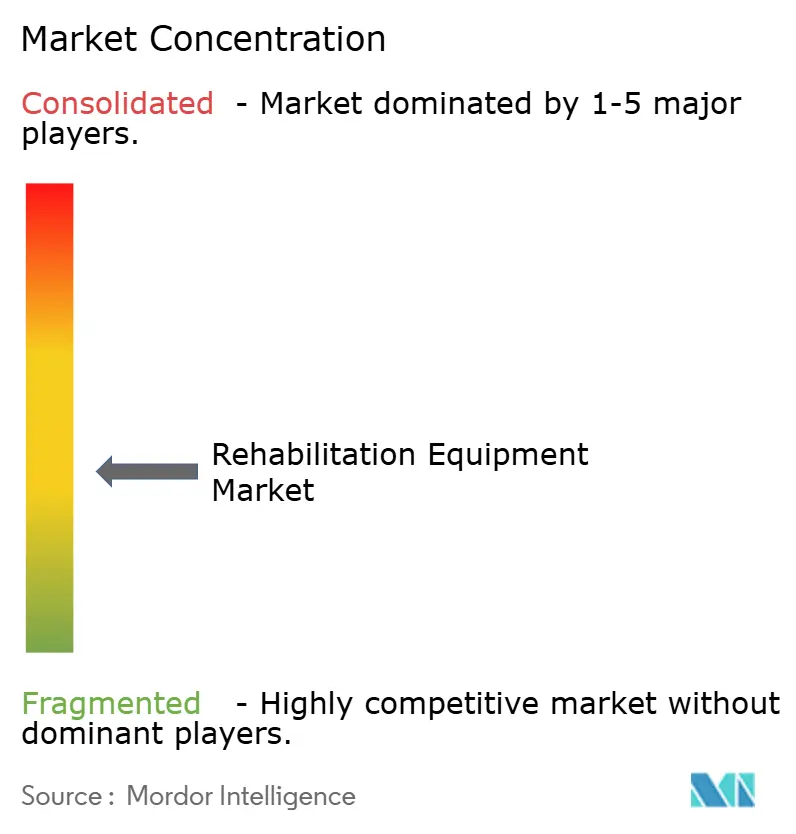
| Market Concentration | Medium |
Major Players *Disclaimer: Major Players sorted in no particular order Image © Mordor Intelligence. Reuse requires attribution under CC BY 4.0. | |
Rehabilitation Equipment Market Analysis by Mordor Intelligence
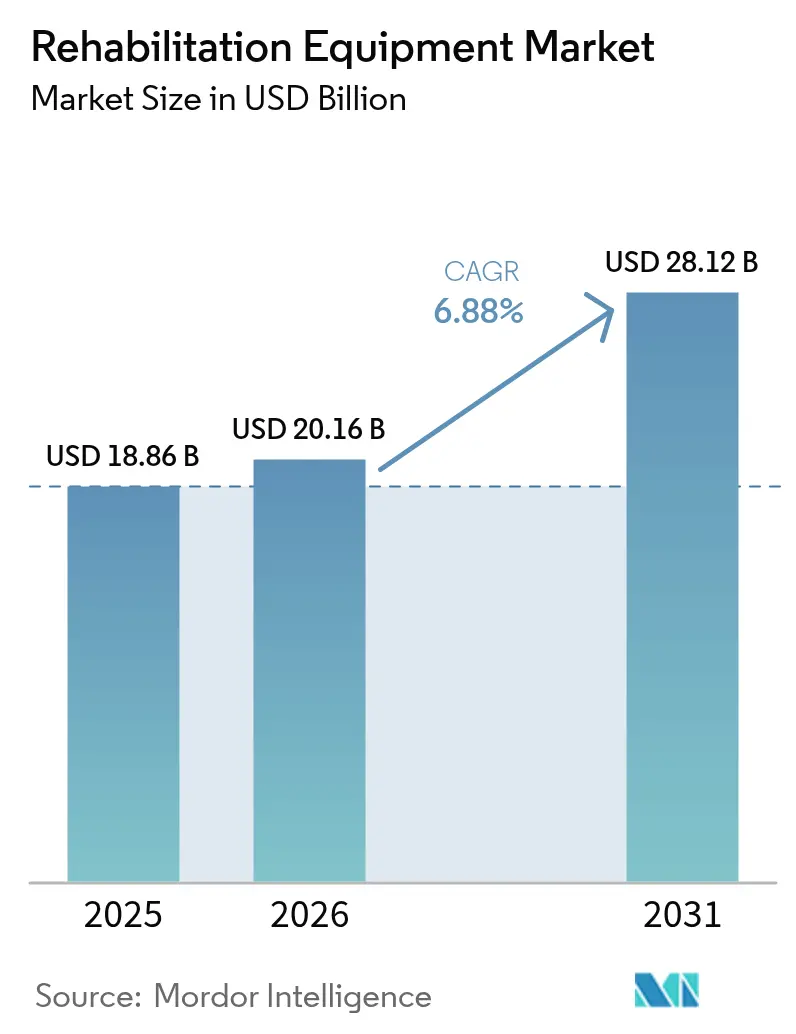
The rehabilitation equipment market size expanded to USD 18.86 billion in 2025, is estimated to reach USD 20.16 billion in 2026, and is projected to grow to USD 28.12 billion by 2031, registering a CAGR of 6.88% between 2026 and 2031. The growing prevalence of chronic diseases, rapid population aging, and payment reforms that reward improvements in functional outcomes are driving demand away from bulky, facility-bound devices toward connected, portable solutions. At the same time, ambulatory surgery centers, hospital-at-home programs, and remote monitoring codes are fragmenting the traditional care pathway, increasing the urgency for equipment that works across settings. Robotics, artificial intelligence, virtual reality, and sensor miniaturization are redefining product design priorities, tilting capital toward platforms that generate actionable data for clinicians and payers. Competitive boundaries are blurring as consumer electronics firms embed health sensors into mobility aids, while established durable medical equipment suppliers bolster digital capabilities through acquisitions and partnerships. Capital budgets remain tight, but leasing, pay-per-session, and reimbursement expansions for advanced devices are beginning to ease adoption hurdles in high-volume practices.
Key Report Takeaways
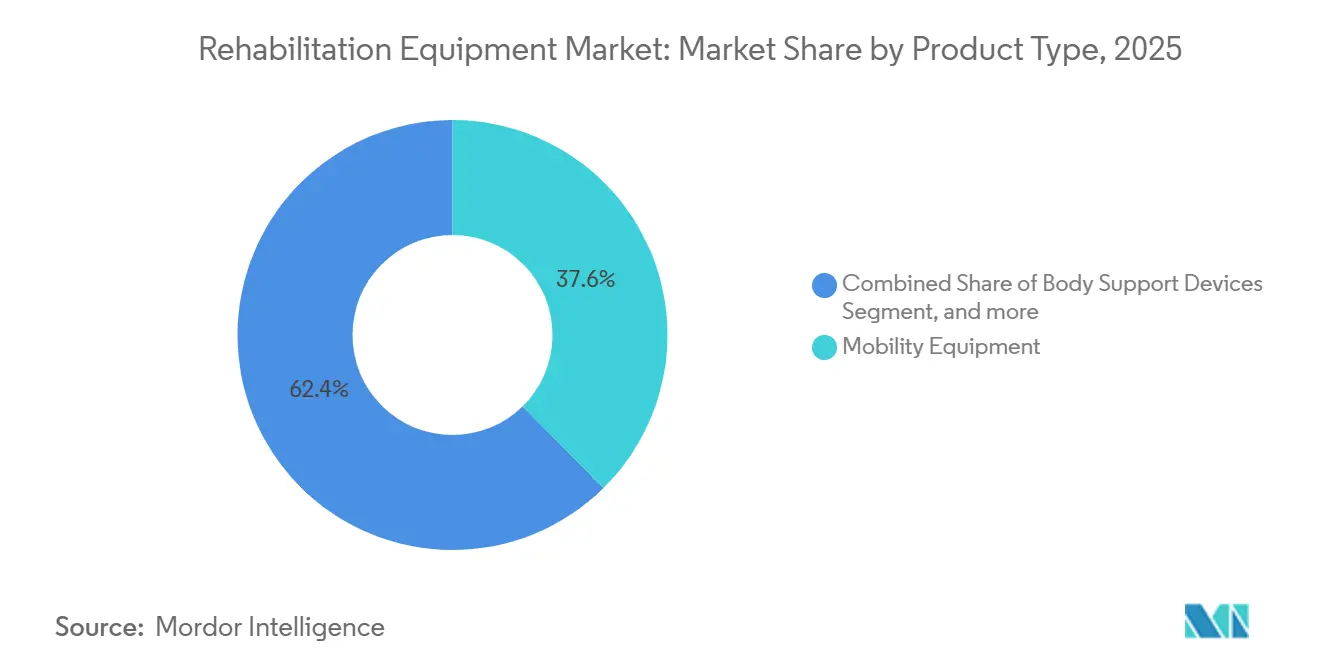
- By product type, mobility equipment led with 37.55% rehabilitation equipment market share in 2025, whereas robotic and smart systems are forecast to expand at a 12.85% CAGR through 2031.
- By application, physiotherapy accounted for 50.53% of the rehabilitation equipment market in 2025, while neuro-rehabilitation is projected to grow at a 10.75% CAGR through 2031.
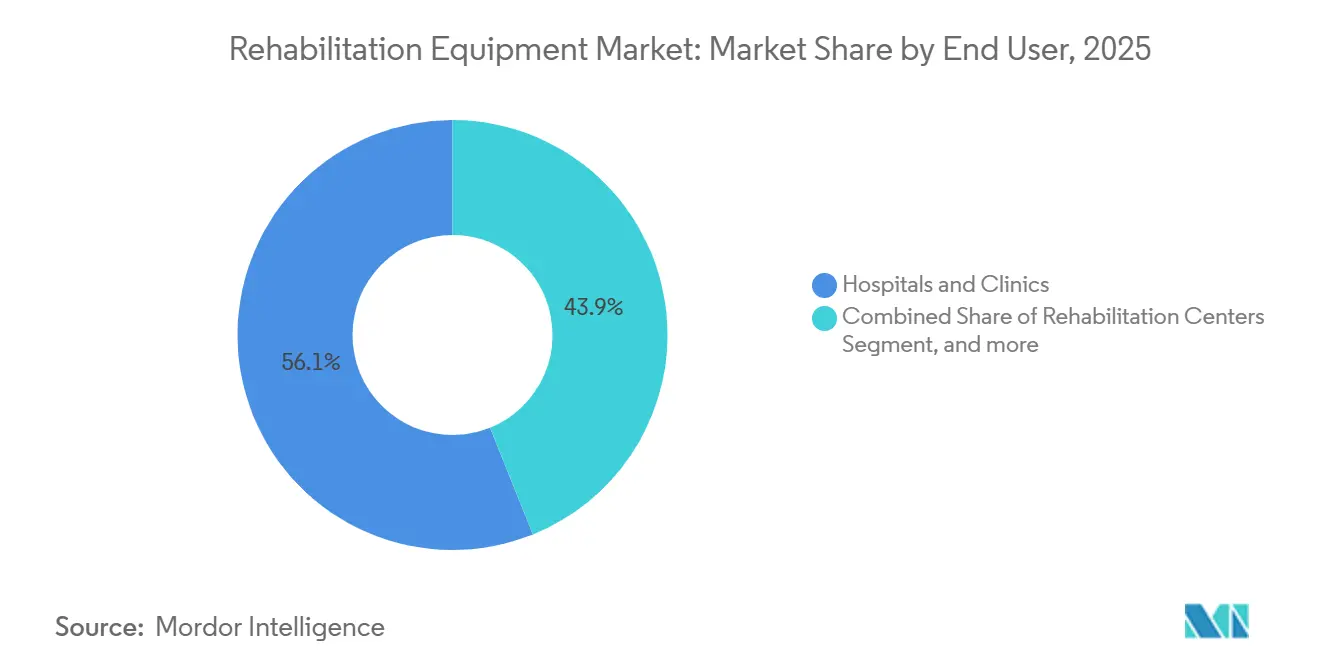
- By end user, hospitals held a 56.15% share of the rehabilitation equipment market in 2025, yet home-care settings recorded the highest projected CAGR of 11.82% during 2026-2031.
- By geography, North America commanded 42.52 of % rehabilitation equipment market share in 2025, although Asia-Pacific shows the fastest momentum with a 9.12% CAGR through 2031.
Note: Market size and forecast figures in this report are generated using Mordor Intelligence’s proprietary estimation framework, updated with the latest available data and insights as of 2026.
Market Trends and Insights
Drivers Impact Analysis of Rehabilitation Equipment Market*
| Driver | (~) % Impact on CAGR Forecast | Geographic Relevance | Impact Timeline |
|---|---|---|---|
| Rapid Growth of Post-Acute and Chronic-Disease Rehabilitation Demand | +1.8% | Global, strongest in North America, Europe, urban Asia-Pacific | Medium term (2-4 years) |
| Rising Adoption of AI-Powered and Robotic Exoskeleton Devices | +2.1% | North America, European Union, Japan, South Korea, Australia | Long term (≥ 4 years) |
| Expansion of Home-Based Tele-Rehabilitation Ecosystems | +1.5% | North America, Western Europe, China, India | Short term (≤ 2 years) |
| Surge in Ambulatory Surgery Centers Driving Portable Device Uptake | +1.2% | United States, Canada, Germany, United Kingdom | Medium term (2-4 years) |
| Integration of VR And Gamified Therapy Boosting Adherence | +0.9% | United States, Japan, Germany, Australia | Long term (≥ 4 years) |
| Source: Mordor Intelligence | |||
Rapid Growth of Post-Acute and Chronic-Disease Rehabilitation Demand
Hospitals are discharging patients sooner, shifting recovery workloads onto skilled nursing facilities, outpatient clinics, and homes. Stroke remains a pivotal public health concern, with roughly 795,000 annual events in the United States alone, each requiring months of intensive therapy[1]. Orthopedic cases add volume, as hip and knee replacements climb among aging adults across developed markets. Diabetes, COPD, and heart failure add steady demand, since supervised exercise and education lower mortality by up to 30%[2]. Value-based payment models reward fewer readmissions, pushing providers to adopt equipment that accelerates mobility gains and measures progress. Together, these factors are driving the rehabilitation equipment market toward data-rich devices that demonstrate improved outcomes.
Rising Adoption of AI-Powered and Robotic Exoskeleton Devices
FDA clearances and emerging billing codes are shifting exoskeletons from research labs to clinics. Ekso NR received U.S. clearance in 2024, enabling data-guided gait therapy that improves weight-bearing symmetry[3]. Lifeward reported a 40% increase in hospital uptake for ReStore after Medicare introduced a dedicated G-code reimbursing up to USD 150 per session[4]. Japan widened nursing-care insurance in 2025 to subsidize exoskeleton rentals, reducing caregiver injuries. AI algorithms now adjust resistance in real time, extending therapy sessions while lowering therapist fatigue. As batteries shrink and component prices fall, small centers and even select home programs begin leasing units, widening the footprint of the rehabilitation equipment market.
Expansion of Home-Based Tele-Rehabilitation Ecosystems
Remote Patient Monitoring codes, expanded by CMS in 2024, allow connected devices to transmit range-of-motion, adherence, and pain data directly to therapists. A 2025 peer-reviewed study found that connected equipment users achieved 85% exercise adherence, compared with 60% for standard programs, and posted 15% higher functional gains. Medicare Advantage plans are scaling hospital-at-home benefits and bundling rehabilitation equipment into care packages to cut skilled nursing utilization. These trends boost demand for sensor-based bands, pedal exercisers, and lightweight walkers, solidifying the rehabilitation equipment market in living rooms and rural communities.
Surge in Ambulatory Surgery Centers Driving Portable Device Uptake
ASC procedure volume in the United States rose 8% in 2025, with joint replacements the fastest-growing category. Patients leave the same day and need devices within 24 hours, creating a premium on lightweight walkers, continuous passive motion machines, and battery-powered electrotherapy units. Germany’s statutory insurers now reimburse portable NMES devices immediately after orthopedic surgery, linking early muscle activation to lower disability claims. Rapid feedback loops between patients and suppliers shorten product iteration cycles, channeling more innovation into user-friendly form factors that strengthen the rehabilitation equipment market.
Restraints Impact Analysis of Rehabilitation Equipment Market*
| Restraint | (`) % Impact on CAGR Forecast | Geographic Relevance | Impact Timeline |
|---|---|---|---|
| High Upfront and Lifecycle Costs for Advanced Robotic Systems | -1.3% | Global, sharpest in emerging markets and small facilities | Medium term (2-4 years) |
| Fragmented Reimbursement for Home and Digital Therapies | -0.9% | United States, Europe, Latin America, Southeast Asia | Short term (≤ 2 years) |
| Limited Therapist Skill Sets for Multidisciplinary Tech Integration | -0.7% | Rural North America, Eastern Europe, developing Asia-Pacific | Medium term (2-4 years) |
| Low Awareness and Access in Rural and Low-Income Areas | -0.6% | Sub-Saharan Africa, South Asia, remote North America, Australia | Long term (≥ 4 years) |
| Source: Mordor Intelligence | |||
High Upfront and Lifecycle Costs for Advanced Robotic Systems
Acquisition prices of USD 75,000–150,000 plus 10–15% annual service fees challenge hospitals contending with thin operating margins. A 2024 American Hospital Association survey found that 62% of U.S. facilities delayed capital purchases amid higher interest expenses. Smaller centers rarely treat the 15–20 weekly patients required to break even within five years. Import duties and weak service networks further inflate costs in emerging markets. Leasing shifts expenditure to operating budgets but still demands utilization guarantees, moderating near-term growth in the rehabilitation equipment market.
Fragmented Reimbursement for Home and Digital Therapies
Only 38% of U.S. commercial plans covered app-based therapy or connected devices in 2025. Europe varies: Germany reimburses approved DiGA apps, whereas the United Kingdom restricts most devices to hospital discharge pathways. Navigating dozens of payer-specific codes slows launches and raises administrative overhead. Out-of-pocket costs deter adoption among lower-income patients, leaving portions of the rehabilitation equipment market untapped despite technological readiness.
*Our forecasts treat driver/restraint impacts as directional, not additive. The impact forecasts reflect baseline growth, mix effects, and variable interactions.
Rehabilitation Equipment Market Segment Analysis
By Product Type:
Robotic Systems Outpace Traditional AidsRobotic and smart systems are set to expand at a 12.85% CAGR through 2031, nearly double the overall rehabilitation equipment market. Mobility equipment retained a 37.55% share in 2025, underscoring durable demand for manual and powered wheelchairs. Manual chairs remain volume leaders for short-term needs, while powered variants gain ground as insurers now fund advanced seating that prevents pressure sores. Daily living aids such as smart beds with weight sensors alert caregivers to unassisted exits, lowering fall risk and extending independent living. Exercise equipment is evolving into connected platforms that gamify motion and feed adherence metrics to therapists.
Robotic exoskeletons, gait trainers, and upper-limb robots are shifting momentum. A 2025 meta-analysis recorded 18% greater motor recovery in stroke patients receiving robotic-assisted therapy compared with matched conventional doses. With clinical evidence accumulating, payers are opening dedicated billing codes, positioning robotics to capture a growing share of the rehabilitation equipment market by 2031. Traditional suppliers are responding through joint ventures and acquisitions aimed at embedding AI modules into wheelchairs, lifts, and beds, signaling an era where software usability competes with mechanical durability.

By Application:
Neuro-Rehabilitation Gains MomentumPhysiotherapy accounted for 50.53% of the rehabilitation equipment market in 2025, reflecting its broad scope across musculoskeletal injuries and chronic pain. Equipment ranges from resistance bands to isokinetic dynamometers and remains well reimbursed. Neuro-rehabilitation is climbing at a 10.75% CAGR, propelled by rising stroke survival rates and traumatic brain injury protocols that apply constraint-induced movement and brain-computer interfaces.
New brain-stimulation devices cleared by the FDA in 2025 expand therapist toolkits, while NIH earmarked USD 120 million for neuro-tech R&D that same year. The occupational therapy and geriatric rehabilitation segments are adding incremental growth through adaptive devices and fall-prevention systems designed for aging populations. Cardiopulmonary rehabilitation leverages treadmills and respiratory trainers to reduce readmissions, with 25% lower five-year mortality documented among program completers. Diversifying clinical evidence cements multi-disciplinary equipment portfolios, broadening the rehabilitation equipment market beyond core physiotherapy.
By End User:
Home-Care Settings AccelerateHospitals and clinics commanded 56.15% of the rehabilitation equipment market share in 2025, buttressed by capital-intensive gear such as hydrotherapy pools and robotic gait trainers that deliver high throughput. Yet home-care settings are advancing at an 11.82% CAGR, energized by hospital-at-home waivers and direct-to-consumer e-commerce. Portable ultrasound, wearable gait sensors, and tablet-based exercise games now ship directly to living rooms, where therapists monitor compliance via cloud dashboards.
Ambulatory surgery centers strengthen this shift, discharging orthopedic patients on the same day and prescribing lightweight walkers and electrotherapy units that arrive before anesthesia wears off. Rehabilitation centers maintain relevance by bundling multi-disciplinary services under one roof, but their device choices increasingly mirror home-care priorities such as wireless connectivity and app-based coaching. Taken together, these trends disperse rehabilitation equipment market growth across settings, reducing reliance on any single channel.
Geography Analysis
North America Rehabilitation Equipment Market
North America preserved 42.52 of % rehabilitation equipment market share in 2025, led by the United States, where Medicare Advantage enrollment reached 31 million and bundled rehabilitation benefits encourage adoption of powered wheelchairs and connected exercise gear. Canada’s provincial formularies fund mobility aids, while its tele-rehabilitation pilots bridge therapist gaps in rural zones. A competitive mix of legacy suppliers and robotics start-ups operates through hospital GPO contracts, home-health agencies, and direct web sales.
Europe Rehabilitation Equipment Market
Europe exhibits diverse reimbursement climates. Germany updated its Hilfsmittelverzeichnis in 2024 to include exoskeletons, enabling statutory coverage when evidence shows they outperform conventional therapy. The United Kingdom grapples with budget ceilings, favoring lower-cost connected exercise equipment for community rehab teams. France covers up to 100% of device costs depending on severity, stimulating demand for smart beds and adaptive bathrooms. Spain and Italy witness private centers offering VR therapies ahead of public adoption. The Medical Device Regulation’s stringent evaluation rules encourage consolidation, nudging small manufacturers toward partnerships.
APAC, MEA and South America Rehabilitation Equipment Market
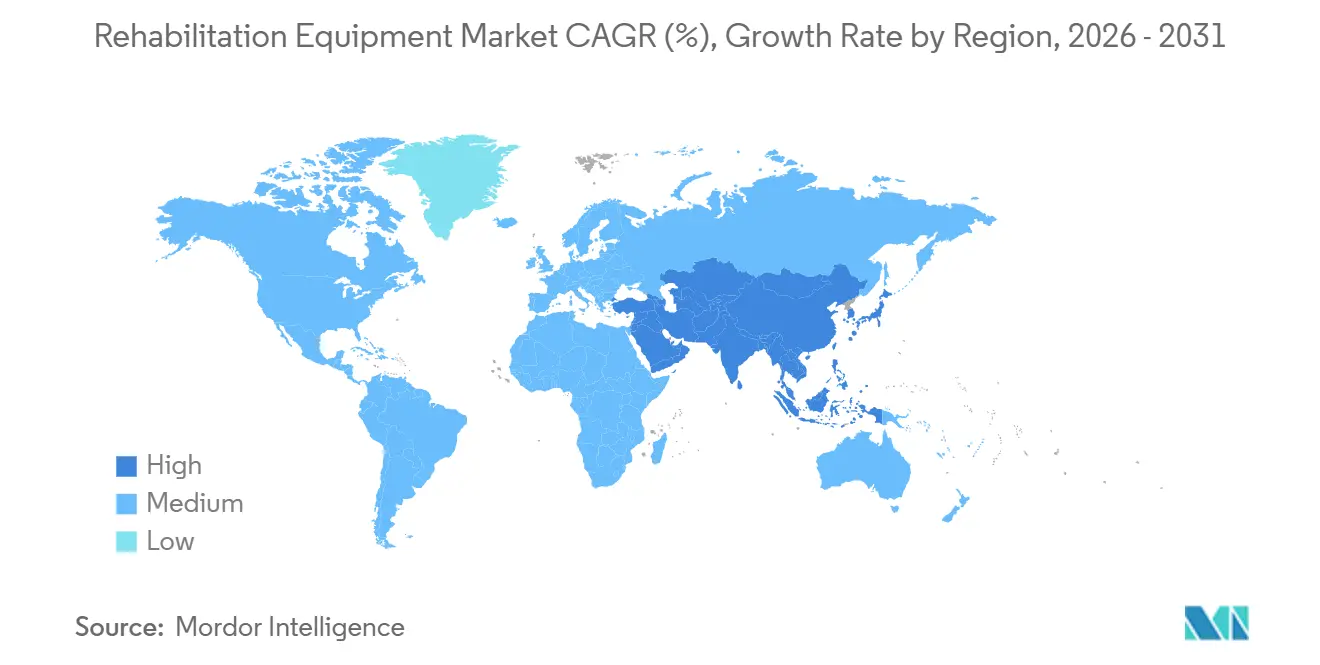
Asia-Pacific leads in growth at a 9.12% CAGR. China’s plan to open 10,000 rehabilitation hospitals by 2030 subsidizes 50–70% of qualifying equipment purchases. Japan’s 2025 nursing-care reforms hike payments for robotic lifts to mitigate caregiver strain. India’s Production Linked Incentive scheme supports domestic manufacturing, though the market still favors imported mid-range devices. Australia and South Korea exploit high broadband penetration to deploy tele-rehabilitation, while Middle East, Africa, and South America progress steadily through medical tourism and private hospital expansion. Across regions, localized manufacturing incentives and digital-health investments will continue to diversify rehabilitation equipment market demand patterns.
Regulatory Landscape
Rehabilitation equipment manufacturers operate under medical device quality-system and premarket frameworks that affect time-to-market and lifecycle costs. In the United States, the FDA regulates devices through establishment registration and listing, labeling, and premarket pathways such as 510(k), PMA, and IDE, plus postmarket requirements including Medical Device Reporting (MDR). A notable compliance change is the FDA Quality Management System Regulation (QMSR), effective February 2, 2026, which incorporates ISO 13485:2016 into the FDA quality system framework and increases the emphasis on harmonized QMS documentation for global suppliers selling into the U.S. market.
In Europe, Regulation (EU) 2017/745 (MDR) continues to impose stringent clinical evidence and conformity assessment obligations, with notified-body capacity and documentation requirements affecting launch sequencing for higher-risk devices, including advanced robotic and smart systems. Regulatory updates through delegated and implementing acts add additional steps for manufacturers, including Commission Delegated Regulation (EU) 2026/1451 (20 March 2026), which amends MDR by updating the list of implantable devices and class III devices exempted from the obligation to perform clinical investigations. Alongside regulation, engagement on tariffs and import treatment for medical devices and related components remains active through industry bodies such as the American Orthotic & Prosthetic Association (AOPA) and the American Hospital Association (AHA), which can influence procurement when trade measures change the cost and availability of inputs.
Competitive Landscape
The rehabilitation equipment market remains moderately fragmented. Invacare, Permobil, and Sunrise Medical collectively hold a commanding position in manual and powered wheelchairs, bolstered by nationwide servicing and durable reputations. Arjo and Baxter leverage critical-care footprints to cross-sell patient lifts and smart beds under bundled contracts. Robotics specialists such as Ekso Bionics and Lifeward secured 2024-2025 FDA clearances, enabling them to target neuro-rehabilitation units willing to invest over USD 100,000 per system. Ekso’s 2025 patent for AI gait analysis that tweaks resistance based on electromyography signals highlights a pivot from hardware exclusivity to software defensibility.
Consumer electronics giants like Samsung and Xiaomi are putting pressure by embedding fall detection and vitals monitoring in walking aids and bathroom supports. ISO 13482 and IEC 60601-1 safety standards raise compliance costs, favoring firms with established regulatory teams. Strategic alliances multiply, pairing device makers with health IT vendors to feed rehabilitation data into electronic records, thereby locking in provider workflows. Looking ahead, suppliers lacking digital ecosystems risk share erosion as the rehabilitation equipment market rewards outcome-verified, data-driven platforms
Rehabilitation Equipment Industry Leaders
-
Medline Industries, Inc
-
Drive DeVilbiss Healthcare
-
Invacare Corporation
-
Permobil
-
Sunrise Medical
- *Disclaimer: Major Players sorted in no particular order
Rehabilitation Equipment Market Companies Covered in this Report
- AlterG Inc.
- Arjo AB
- Baxter, Inc. (Hill-Rom Services Inc.)
- Caremax Rehabilitation Equipment Co. Ltd.
- DJO Global
- Drive DeVilbiss Healthcare
- Dynatronics
- Ekso Bionics
- GF Health Products
- Handicare Group AB
- Hocoma
- Hospital Equipment Manufacturing Company
- Invacare
- Lifeward (Formerly ReWalk Robotics)
- Medline Industries
- Mettler Electronics
- Motus Nova LLC
- Ottobock
- Permobil AB
- Pride Mobility Products
- RECK-Technik GmbH & Co. KG
- Roma Medical Aids Ltd.
- Sunrise Medical
Market Opportunities and Future Outlook
The clearest whitespace is emerging where rehabilitation shifts across settings and where devices function as data-generating platforms that can integrate into remote care workflows. In the United States, CMS remote patient monitoring code expansion (2024) and payer interest in objective adherence and progress metrics support demand for connected exercise equipment, sensorized mobility aids, and systems that can document functional outcomes beyond facilities. The report context also points to an adoption wedge for advanced gait and neuro-rehabilitation solutions supported by changing reimbursement mechanics, including Medicare session-based coding for exoskeleton-assisted therapy.
Innovation and supply-side programs are also converging on intelligent sensing, neural interaction, and intent decoding. China issued a Three-Year Action Plan (2026-2028) through multiple government agencies to upgrade the rehabilitation assistive device industry, reinforcing opportunities for suppliers that can localize manufacturing and integrate smart sensing into mobility and robotic platforms. Activity on pilot deployments highlights early scale-up pockets, including deployment of FREE Walk exoskeletons in Taiwan through collaboration between Onyx Healthcare, Intel, and FREE Bionics, while peer-reviewed clinical advances, such as multisensory digital rehabilitation platforms and virtual connection frameworks for therapist-exoskeleton interaction, can support procurement decisions when they translate into cleared, serviceable product offerings.
Recent Industry Developments in Rehabilitation Equipment Market
- February 2026: Invacare Europe and Asia-Pacific combined with Direct Healthcare Group to create DHCare following Rhône completing the acquisition. The combination broadens a scaled supplier base across mobility and reduced-movement care categories and extends distribution and servicing reach across core rehabilitation channels.
- October 2025: Kingswood Capital Management entered into a definitive agreement to acquire Drive DeVilbiss Healthcare from CD&R. The transaction underscores ongoing consolidation in essential medical products and can reshape capital allocation for product development, manufacturing footprint, and go-to-market focus in rehabilitation-related durable equipment.
- November 2024: Invacare Holdings Corporation and MIGA Holdings LLC announced MIGA's acquisition of Invacare's North American business. The divestiture reorganized competitive positioning in North American mobility and rehab equipment, with potential changes to brand stewardship, distribution priorities, and customer contracting across home-care and facility segments.
Rehabilitation Equipment Market Report Scope and Research Methodology
Market Definition and Coverage
For this study, the rehabilitation equipment market covers the sale of devices used to restore, maintain, or improve functional ability for people recovering from injury, surgery, disability, or age-related decline across clinical and home settings.
Scope exclusions: This sizing excludes rehabilitation services and therapy sessions, and it also excludes general fitness equipment not primarily intended for medical rehabilitation use.
Segments Covered in This Report
- By Product Type
- Daily Living Aids
- Medical Beds
- Bathroom & Toilet Assist Devices
- Reading, Writing & Computer Aids
- Other Daily Living Aids
- Mobility Equipment
- Walking Assist Devices
- Manual Wheelchairs
- Powered Wheelchairs & Mobility Scooters
- Exercise Equipment
- Upper-body Exercise Equipment
- Lower-body Exercise Equipment
- Body Support Devices
- Patient Lifts
- Medical Lifting Slings
- Robotic & Smart Rehabilitation Systems
- Daily Living Aids
- By Application
- Physiotherapy
- Occupational Therapy
- Neuro-rehabilitation
- Cardiopulmonary Rehabilitation
- Geriatric Rehabilitation
- By End-User
- Hospitals
- Rehabilitation Centers
- Home-care Settings
- Ambulatory Surgical Centers
- By Geography
- North America
- United States
- Canada
- Mexico
- Europe
- Germany
- United Kingdom
- France
- Italy
- Spain
- Rest of Europe
- Asia-Pacific
- China
- India
- Japan
- Australia
- South Korea
- Rest of Asia-Pacific
- Middle East and Africa
- GCC
- South Africa
- Rest of Middle East and Africa
- South America
- Brazil
- Argentina
- Rest of South America
- North America
Data Sources, Market Sizing, and Validation
Desk Research
Desk work started by mapping the patient and therapy workload that creates equipment demand, then checking where the spend is captured as medical devices in public statistics. We relied on non-paywalled sources such as the World Health Organization, the US CDC, US Census Bureau trade statistics, OECD health statistics, and sources such as Eurostat to reflect population aging and healthcare delivery signals.
To anchor product boundaries and price direction, we reviewed sources such as US FDA device databases, clinical publications in peer-reviewed rehabilitation journals, and public procurement notices where available. We also used company annual reports, investor presentations, and credible press coverage on care pathway shifts. A few paid subscriptions were used in a limited way for company financials, news screening, patent lookups, and shipment-level trade checks where public series were not granular enough. The desk sources listed here are illustrative only, and many other public and paid references were used to collect, validate, and clarify inputs during the study.
Primary Interviews and Surveys
Primary interviews and short surveys were used to pressure-test the equipment mix, replacement cycles, and typical pricing by channel, institutional procurement versus home-care purchases. We spoke with a spread of manufacturers, distributors, rehab providers, and clinical stakeholders across major regions so assumptions on utilization, tender timing, and adoption of robotic and smart systems could be adjusted before totals were finalized.
Distribution of primary research fieldwork respondents
| Company type | Respondent position | Region |
|---|---|---|
| Top tier: 37% | CXOs: 15% | APAC: 50% |
| Mid tier: 47% | Functional/Unit leaders: 38% | EMEA: 32% |
| Smaller Players: 16% | Managers: 47% | Americas: 18% |
Market-Sizing & Forecasting
Sizing used a combined top-down and bottom-up approach, where the top-down build starts from rehabilitation demand pools and care setting capacity, then translates into equipment category spend using observed procurement patterns and average selling prices. We corroborated totals through selective bottom-up checks, including supplier revenue sampling, distributor channel checks, and a few ASP times volume sanity builds for high-visibility categories such as mobility equipment and patient lifts.
Key model inputs included growth in the older adult population, incidence and recovery pathways for conditions that commonly require rehab, the split of therapy delivered in hospitals versus rehab centers versus home-care, typical replacement cycles for high-use equipment, and pricing progression for technology-led categories (for example, robotic and smart systems). Forecasting relied mainly on scenario analysis supported by variable-by-variable expert views, since reimbursement changes, home-care adoption, and capital spending cycles can shift the short-term path even when long-term demand stays steady. Where bottom-up visibility was patchy, gaps were handled using conservative penetration assumptions tied back to provider counts and utilization, then rechecked during follow-up calls.
Data Validation & Update Cycle
Outputs were cross-checked against independent signals such as healthcare infrastructure indicators, trade flows for relevant device groups, and public company revenue direction, and we also reviewed any sharp year-to-year swings before sign-off. When variance was material, assumptions were reopened, and the related respondents were re-contacted to confirm whether the change was real or driven by timing, currency, or one-off tenders.
Before publication, the full model and its key assumptions go through multi-step analyst reviews so arithmetic, logic, and scope alignment stay consistent across regions and product categories. Reports are refreshed annually, and interim updates are triggered when major events materially change pricing, regulation, or care delivery patterns. Right before delivery, a final pass is completed so clients receive the most current view available.
Mordor Intelligence's Rehabilitation Equipment Market Size Compared With Other Published Estimates
Published market values for rehabilitation equipment often do not match because the scope line moves between studies, and the pricing and channel assumptions then follow that scope choice. Differences also show up when one publisher reports manufacturer-level revenues and another mixes in distribution margins or includes adjacent care products.
The biggest gap drivers are whether robotic and smart rehab systems are counted as core rehab equipment, whether daily living aids are treated as part of rehabilitation or as general assistive products, and whether values are normalized to the same year-average currency rates. Some studies also anchor the near-term size to a single base year and extend forward mechanically, while others re-check replacement cycles and home-care mix changes each refresh, which is why the 2025 value of USD 18.86 B is kept tied to the stated product scope and annual update checks applied by Mordor Intelligence.
Benchmark comparison
| Source | Market Size | Gaps in Research Methodology |
|---|---|---|
| Mordor Intelligence | USD 18.86 B (2025) | |
| Global Research Publisher A | USD 18.29 B (2025) | Uses a different base year anchor (2024) and can apply broader type groupings, which may shift the included mix of daily living aids and higher-priced smart systems when translating to 2025. |
| Industry Research Publisher B | USD 18.49 B (2025) | Values are described at factory-gate level and may treat related creator-sold services and certain assistive device lines differently, which can move totals even when the same end-use settings are discussed. |
Across the three figures, the spread is mainly explained by what gets counted inside the equipment basket and how pricing is carried into the current year. By keeping inputs traceable to demand setting, replacement behavior, and a clearly stated product scope, our estimate stays easier to reproduce and compare over time.
Key Questions Answered in the Report
How big will rehabilitation equipment spending be by 2031?
The rehabilitation equipment market size is forecast to reach USD 28.12 billion by 2031, growing at a 6.88% CAGR from 2026 through 2031.
Which product segment is growing the fastest?
Robotic and smart rehabilitation systems are projected to expand at a 12.85% CAGR, more than double the overall market pace to 2031.
What drives home-care demand for rehabilitation devices?
Hospital-at-home programs, Medicare Advantage benefits, and remote monitoring codes enable patients to receive therapy at home, lifting home-care equipment growth to an 11.82% CAGR.
Which region will add the most new revenue?
Asia-Pacific shows the strongest momentum, advancing at a 9.12% CAGR thanks to China's eldercare build-out, Japan's nursing-care reforms, and India's manufacturing incentives.
How much do robotic exoskeletons cost and who pays?
Units typically list between USD 75,000 and USD 150,000, with leasing options rising; coverage now exists through Medicare G-codes, Japan's nursing-care insurance, and select European funds.