
Regulator Network Quality Benchmarking Solutions Market Size and Share
Market Overview
| Study Period | 2020 - 2031 |
|---|---|
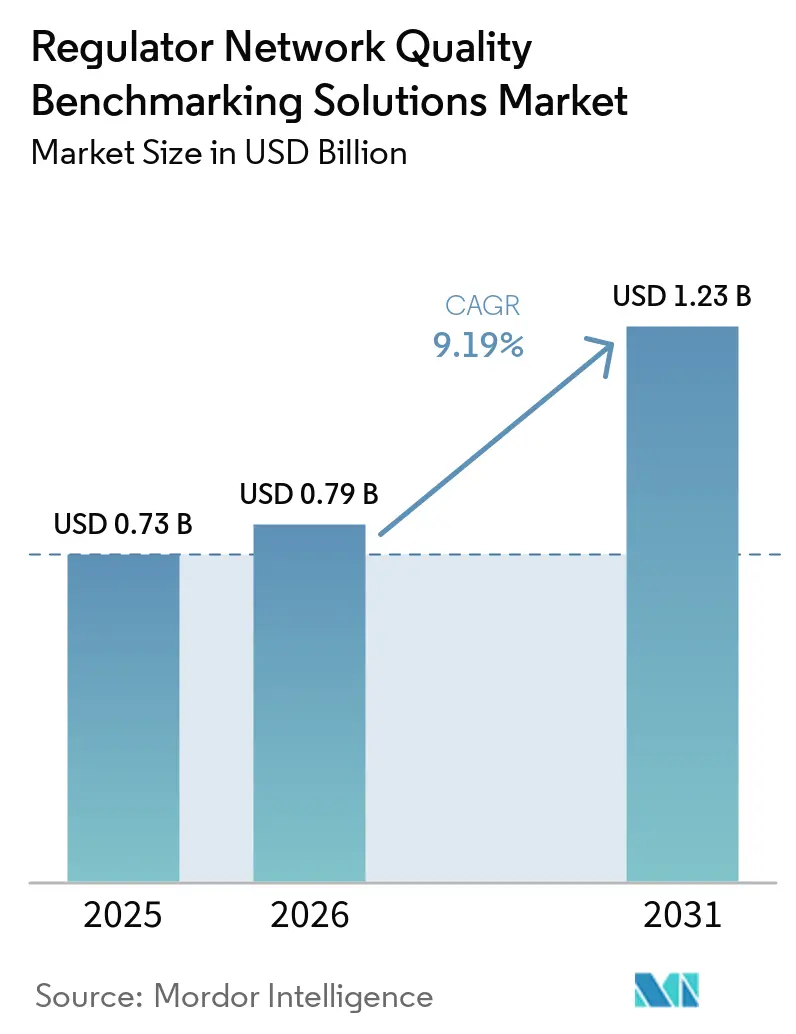
| Market Size (2026) | USD 0.79 Billion |
| Market Size (2031) | USD 1.23 Billion |
| Growth Rate (2026 - 2031) | 9.19 % |
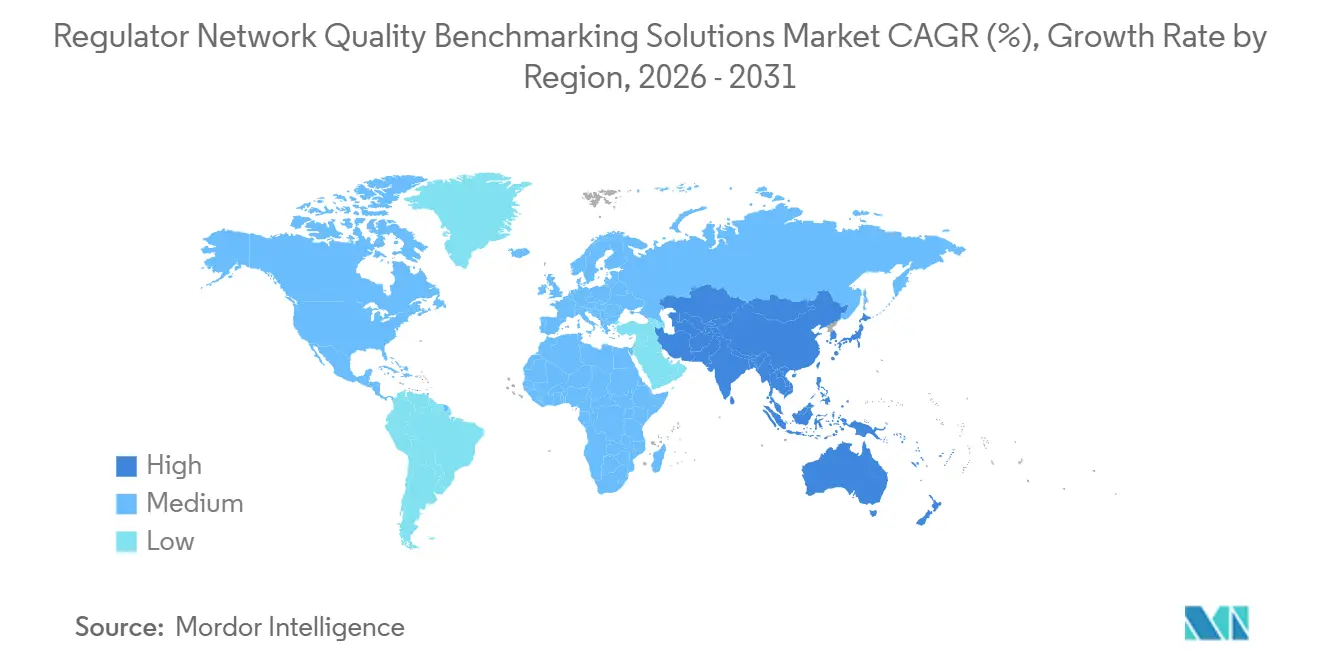
| Fastest Growing Market | Asia-Pacific |
| Largest Market | Middle East |
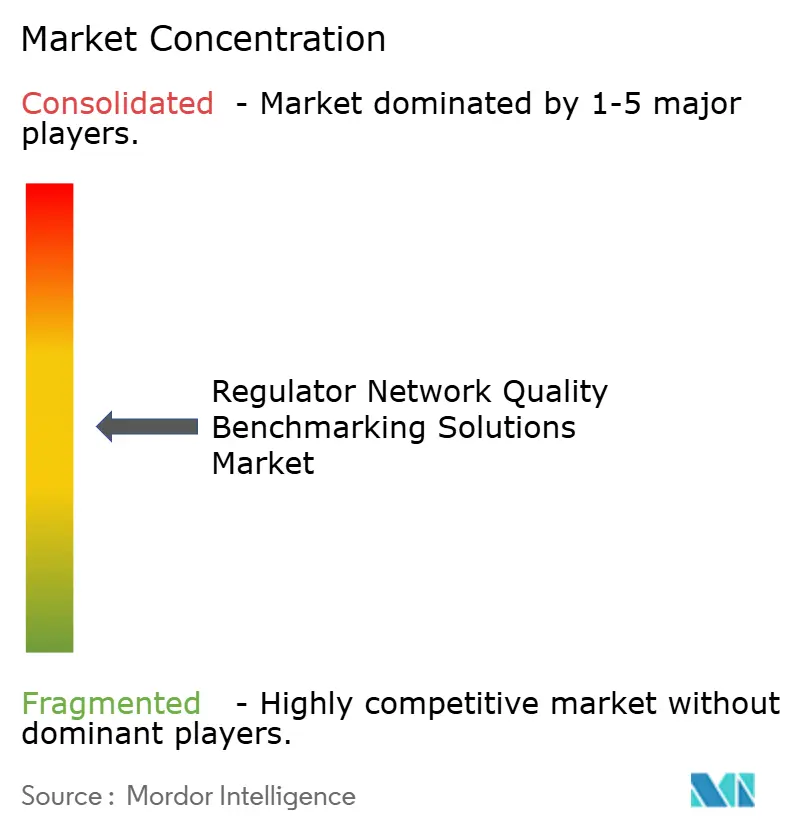
| Market Concentration | Medium |
Major Players *Disclaimer: Major Players sorted in no particular order Image © Mordor Intelligence. Reuse requires attribution under CC BY 4.0. | |
Regulator Network Quality Benchmarking Solutions Market Analysis by Mordor Intelligence
The Regulator Network Quality Benchmarking Solutions Market size is projected to expand from USD 0.73 billion in 2025 and USD 0.79 billion in 2026 to USD 1.23 billion by 2031, registering a CAGR of 9.19% between 2026 to 2031. Independent performance evidence is becoming central to spectrum licensing, public funding accountability, and consumer reporting. National authorities are using measured network data instead of relying only on operator-reported results. Broadband expansion programs and mandatory testing frameworks are creating a longer procurement cycle in more than 40 countries. Regulatory buyers are placing greater value on tools that combine recurring measurement, data processing, and reporting workflows. Data residency requirements and inconsistent measurement definitions are making it harder to deploy a single platform across several jurisdictions.
Key Report Takeaways
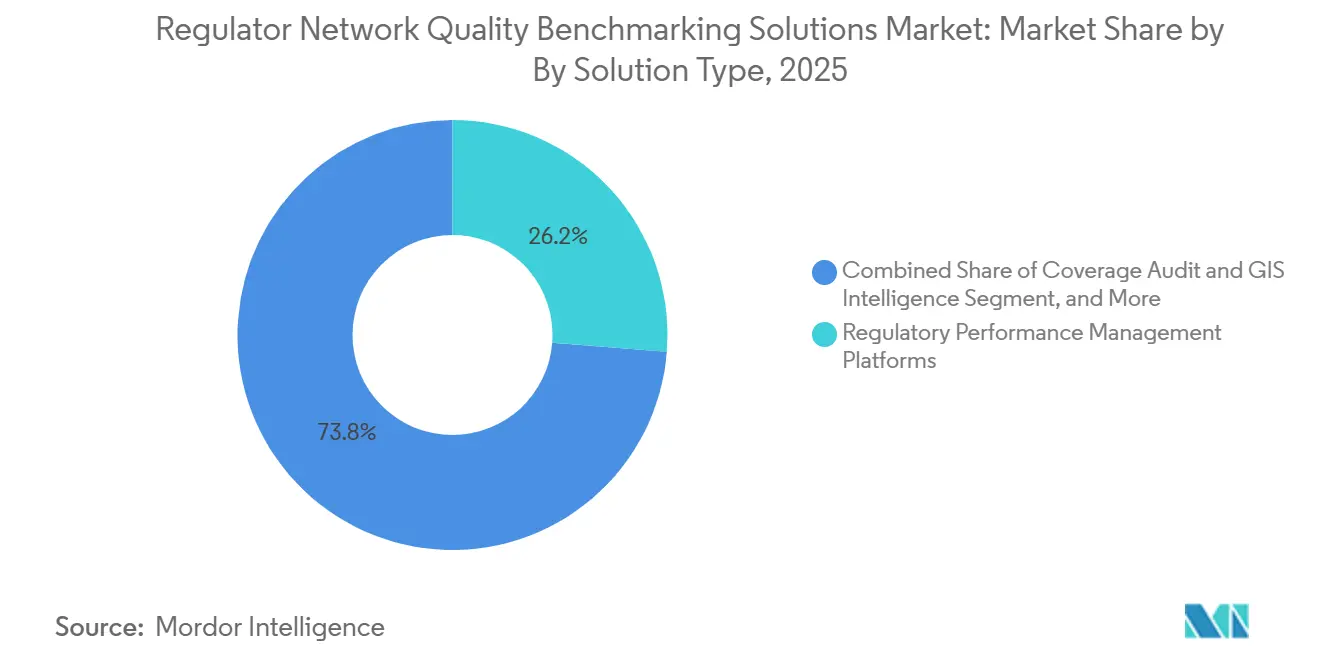
- By solution type, Regulatory Performance Management Platforms held 26.24% of the regulator network quality benchmarking solutions market share in 2025, while Crowdsourced and Passive Measurement Platforms are projected to expand at a 9.48% CAGR through 2031.
- By network scope, Mobile Networks held 55.61% of the regulator network quality benchmarking solutions market share in 2025, while Fixed Wireless Access Networks are projected to expand at a 9.51% CAGR through 2031.
- By KPI domain, Coverage and Signal Quality held 26.17% of the market share in 2025, while Voice, Video, and Application QoE is projected to expand at a 9.77% CAGR through 2031.
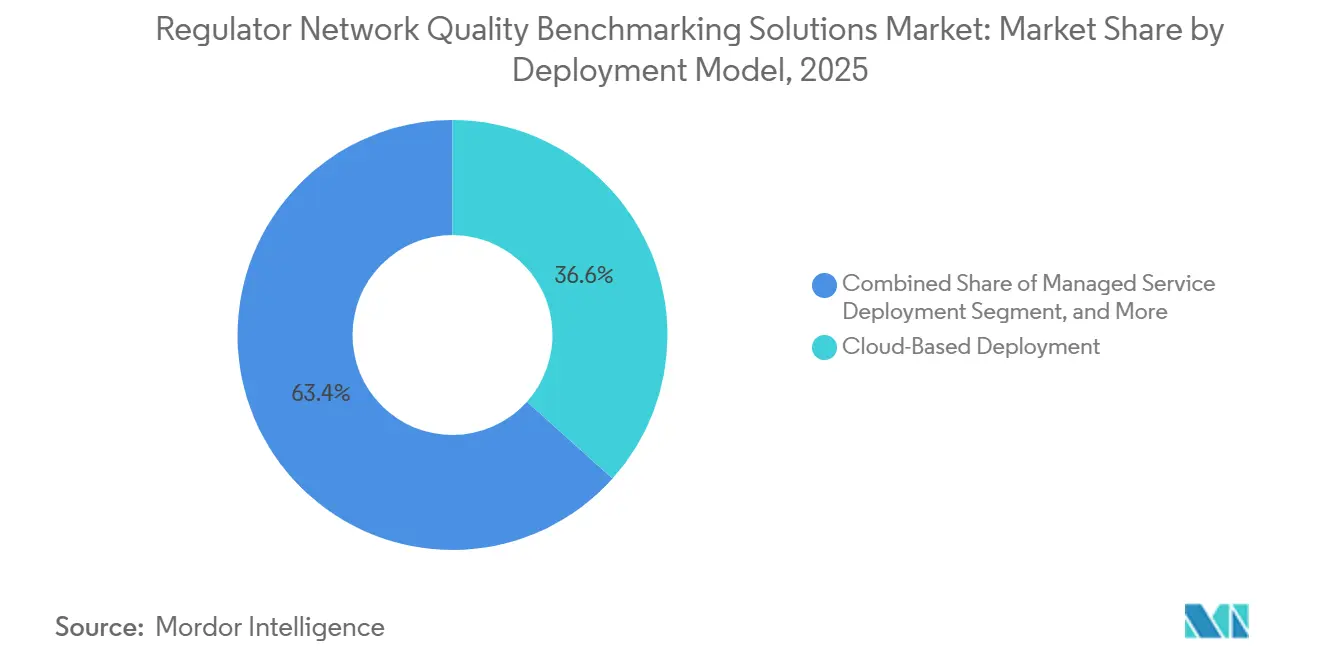
- By deployment model, Cloud-Based Deployment held 36.64% of the market share in 2025, while Sovereign or Private-Cloud Deployment is projected to expand at a 9.82% CAGR through 2031.
- By end user, National Telecommunications Regulators held 32.28% of the market share in 2025, while Regulatory Contractors and Testing Firms are projected to expand at a 9.93% CAGR through 2031.
- By geography, Asia-Pacific held 31.72% of the regulator network quality benchmarking solutions market share in 2025, while the Middle East is projected to expand at a 9.54% CAGR through 2031.
Note: Market size and forecast figures in this report are generated using Mordor Intelligence’s proprietary estimation framework, updated with the latest available data and insights as of January 2026.
Global Regulator Network Quality Benchmarking Solutions Market Trends and Insights
Drivers Impact Table*
| Driver | (~) % Impact on CAGR Forecast | Geographic Relevance | Impact Timeline |
|---|---|---|---|
| Independent QoS Evidence Mandates | +2.8% | Global | Short term (≤ 2 years) |
| 5G and Fixed Wireless Verification | +2.1% | Asia-Pacific, Europe, Middle East | Medium term (2-4 years) |
| Public Funding and Universal Service Accountability | +1.6% | North America, Europe, South America | Medium term (2-4 years) |
| Real-World QoE and Consumer Transparency | +1.2% | Global, led by Asia-Pacific and EU | Short term (≤ 2 years) |
| Multi-Operator Network Comparability | +0.9% | Europe, Asia-Pacific | Medium term (2-4 years) |
| Continuous and Crowdsourced Monitoring | +0.8% | Global, with early gains in Africa and South Asia | Medium term (2-4 years) |
| Source: Mordor Intelligence | |||
Regulatory Mandates for Independent QoS Evidence
Mandatory independent testing is changing procurement in the regulator network quality benchmarking solutions market from a discretionary activity into a legally enforceable requirement. India’s TRAI issued revised Quality of Service regulations on August 2, 2024, requiring access and broadband providers to build or upgrade systems for primary data collection and online Performance Monitoring Report submissions. By April 2025, TRAI had automated Performance Monitoring Report submissions through APIs for mobile operators, with 100% participation for the March 2025 quarter.[1] Germany’s Bundesnetzagentur introduced a uniform mobile coverage measurement method in July 2025 that uses 8 specialist smartphones to test data rates and voice reliability against operator coverage declarations.[2] These requirements support procurement cycles that follow national regulatory review periods, often lasting 3-5 years. BEREC’s revision of QoS parameter guidance is also moving European measurement requirements toward more consistent reporting practices.
5G and Fixed Wireless Rollout Verification Requirements
5G spectrum assignments increasingly include coverage and service-quality conditions that require independent verification. The European Commission published a draft 5G quality mapping methodology in 2025 with national authorities and academic experts from Poland, Italy, Greece, and Croatia.[3] The methodology aims to establish a peak-condition service-quality KPI for Digital Decade connectivity targets. Jordan’s Telecommunications Regulatory Commission uses Ookla data to validate 5G NSA coverage and track progress toward a planned population-coverage target. Egypt’s NTRA has used an incentive-based QoS framework that allows operators to reduce violation penalties by meeting crowdsourced performance targets. South Korea also recently tightened 5G assessment criteria by adding an improvement advisory threshold for locations where a notable share of tests fall below the minimum speed benchmark, creating an additional measurement requirement for operators.
Public-Funding and Universal-Service Accountability
Government broadband programs are making performance testing a condition for receiving and retaining public funding. The U.S. BEAD program requires subgrantees to test last-mile performance against defined speed and latency thresholds every year during the grant period. The FCC’s Universal Service Monitoring Report also documents continuing speed and latency testing for high-cost support recipients. These obligations create recurring demand in the regulator network quality benchmarking solutions market across fixed and mobile connections. Egypt’s NTRA used crowdsourced data to monitor newly deployed mobile stations funded by the Universal Service Fund and operator-funded stations developed through incentive arrangements. Brazil’s Anatel extended its technical cooperation agreements with Ookla and Opensignal, demonstrating that public measurement programs can require recurring platform subscriptions rather than single audits.
Rising Demand for Real-World QoE and Consumer Transparency
Consumer transparency programs are creating demand from communications ministries, consumer authorities, and enforcement-focused regulators. France’s Arcep formalized a data partnership with Ookla and added Speedtest speed and latency results to its Mon Réseau Mobile public mapping tool. The partnership supplements Arcep’s existing data relationships with SpeedChecker and Mi Senti. Malta’s Communications Authority completed a mobile QoS drive-test exercise across Malta and Gozo and announced a further exercise for a future period. Public portals create a visible service that regulators need to maintain after launch. This makes public-facing tools less likely to be replaced than systems used only in internal compliance work.
Restraints Impact Analysis*
| Restraint | (~) % Impact on CAGR Forecast | Geographic Relevance | Impact Timeline |
|---|---|---|---|
| Data Sovereignty and Cross-Border Transfer Constraints | -1.5% | EU, Asia-Pacific, Gulf States | Medium term (2-4 years) |
| Inconsistent KPI Definitions Across Jurisdictions | -1.0% | Global | Long term (≥ 4 years) |
| Procurement Cycles and Limited Regulatory Budgets | -0.7% | Africa, South America, South Asia | Short term (≤ 2 years) |
| Device, App, and Operator Measurement Bias | -0.5% | Global | Medium term (2-4 years) |
| Source: Mordor Intelligence | |||
Data Sovereignty and Cross-Border Transfer Constraints
Probe-level measurement records can contain device identifiers, network session records, and location timestamps. These data elements can trigger requirements that conflict with centralized cloud analytics models. ITU-T Recommendation D.1141, approved in April 2025, sets principles for handling personally identifiable information in big-data telecommunications services but does not prescribe cross-border transfer mechanisms. Deutsche Telekom designed a sovereign platform for network telemetry and call-detail records in 2025, with separate key management to meet GDPR and German telecommunications data-protection requirements. Vendors must either establish processing capacity within each jurisdiction or accept limits on the platform’s functionality. This burden weighs more heavily on smaller cloud-first suppliers than on larger integrators with established legal and technical operations.
Inconsistent KPI Definitions Across Jurisdictions
There is no enforceable global KPI taxonomy for network benchmarking. BEREC is revising QoS parameter guidelines to align reporting across 27 EU member states and incorporate 5G-specific measures, but the guidance does not apply to Asia-Pacific, the Middle East, or South America. ETSI TR 103 559 offers best practices for QoS benchmark testing and scoring, yet it remains voluntary and is based on European practice. Suppliers must therefore maintain separate KPI libraries, reporting templates, and weighting models for different jurisdictions. That work adds support and account-management costs that do not decline as a customer base expands. Locally established suppliers retain an advantage because they already understand each regulator’s reporting expectations.
*Our forecasts treat driver/restraint impacts as directional, not additive. The impact forecasts reflect baseline growth, mix effects, and variable interactions.
Segment Analysis
By Solution Type: Software Platforms Support Persistent Regulatory Monitoring
Regulatory Performance Management Platforms held 26.24% of the regulator network quality benchmarking solutions market share in 2025. Their position reflects the use of persistent software environments rather than episodic measurement campaigns. Regulatory authorities use these environments for multi-operator dashboards, automated compliance scoring, and probe-data ingestion across recurring reporting periods. The integrated workflow reduces the operational burden of maintaining an internal measurement program and consolidating inputs from different sources. Drive-Test and Walk-Test Benchmarking remains important because it provides geographically precise coverage evidence for spectrum disputes and rural funding audits. Passive alternatives cannot fully replace formally controlled tests in license-enforcement proceedings, where the measurement method must be defensible.
Crowdsourced and Passive Measurement Platforms are projected to expand at a 9.48% CAGR through 2031. Their scale comes from the ability to use measurements from many consumer devices across a national footprint. This approach can support wide coverage without the cost of operating a comparable field-testing fleet, which is relevant for authorities with limited field resources. Anatel’s cooperation with Ookla and Opensignal used passive data to complement active measurement programs. Continuous Broadband Monitoring Agents address fixed-broadband grant verification at individual subscriber locations. Test Call Generation, Service Assurance, and Coverage Audit and GIS Intelligence continue to support voice testing, network assessment, spectrum refarming, interference modeling, and coverage mapping in the regulator network quality benchmarking solutions market.

By Network Scope: Mobile Licensing Supports Revenue While Fixed Wireless Expands
Mobile Networks accounted for 55.61% of the regulator network quality benchmarking solutions market size in 2025. The segment is supported by the large number of active 4G and 5G licenses with annual obligations for coverage, availability, and throughput. These conditions require incumbents to demonstrate continuing compliance rather than complete a one-time assessment. The resulting work is less exposed to discretionary budget changes because it is linked to active spectrum rights. Fixed Broadband Networks form a significant secondary segment, especially in Europe and North America. National broadband measurement programs and European roaming benchmarks support contracts linked to defined reporting schedules and formal consumer reporting.
Fixed Wireless Access Networks are projected to expand at a 9.51% CAGR through 2031. Opensignal reported that Saudi Arabian fixed wireless users recorded lower average download speeds than wireline users. This difference is leading authorities in high-adoption markets to establish QoS obligations that are separate from mobile license terms. Lebanon’s spectrum refarming consultation proposed FWA benchmarks covering service availability and latency performance. These requirements establish distinct measurement categories for the regulator network quality benchmarking solutions market. Private fifth-generation networks and satellite constellations remain smaller applications but are receiving early attention where they use shared licensed spectrum.
By KPI Domain: Consumer Experience Measures Gain Priority
Coverage and Signal Quality held 26.17% of the regulator network quality benchmarking solutions market share in 2025. Geographic coverage thresholds remain a basic condition in most spectrum licenses and require evidence of service availability. Authorities require signal and availability checks to verify whether operators meet these coverage conditions. Broadband Speed and Throughput KPIs support annual consumer-transparency reporting and help regulators compare available service. Network Reliability and Availability are becoming more relevant as industrial and autonomous 5G services require documented uptime commitments. These measures complement coverage testing by assessing whether service remains usable after it becomes available.
Voice, Video, and Application QoE is projected to expand at a 9.77% CAGR through 2031. Authorities are moving from infrastructure measures toward indicators of what subscribers receive during actual service use. South Korea introduced a 5G user-experience quality criterion in 2025 and added a measurement tier beyond binary coverage checks. The change also included midterm reviews of prior-year findings to track improvement. QoE platforms combine passive and active measurements with testing for mobile banking, video streaming, and telemedicine. Latency and Jitter KPIs are receiving more procurement attention as real-time 5G use cases become more common in the regulator network quality benchmarking solutions market.
By Deployment Model: Data Residency Supports Private-Cloud Adoption
Cloud-Based Deployment held 36.64% of the regulator network quality benchmarking solutions market share in 2025. Cloud-hosted platforms can scale during peak testing periods and support automated software updates across distributed measurement programs. They can also aggregate data from probes operating across different locations into a common reporting environment. Public cloud models are more common in Southeast Asia and South America, where data-residency rules are still developing. These models can lower initial procurement barriers for hosted software. They are therefore suited to authorities that need a managed platform without establishing their own data-processing environment.
Sovereign or Private-Cloud Deployment is projected to expand strongly through the forecast period. Gulf Cooperation Council states combine national QoS obligations with data-localization requirements. Kuwait’s CITRA conducted a later-phase national campaign with extensive voice and data tests processed in-country. The campaign followed ETSI, ITU, and Network Performance Score standards. Suppliers must make the same measurement logic work in public-cloud, private-cloud, and isolated environments, which adds development work. On-Premises Deployment remains relevant where telecommunications data is classified as critical national infrastructure.
By End User: Contractors Extend Specialist Measurement Capacity
National Telecommunications Regulators held 32.28% of the regulator network quality benchmarking solutions market share in 2025. Their spending is supported by measurement programs that are required by law or license conditions. They are responsible for compliance monitoring, evidence collection, and reporting that can inform enforcement decisions. Telecommunications Ministries are a second government buyer group. They generally procure public-facing transparency tools and interoperability reporting systems. Their projects usually have shorter timelines and smaller contract values than systems used directly for regulatory enforcement.
Regulatory Contractors and Testing Firms are projected to expand at a 9.93% CAGR through 2031. Smaller authorities are outsourcing technical measurement execution while retaining policy interpretation and enforcement responsibilities. Malta’s Communications Authority commissioned Systemics-PAB for its December 2025 drive-test exercise across Malta and Gozo. The work covered 1,500 km and followed ETSI and ITU standards. Contractors are broadening their services from measurement collection to KPI interpretation, report drafting, and operator feedback. Network Operators also buy independent tools to establish internal benchmarks before regulator audits and evaluate performance against competing networks.
Geography Analysis
Asia-Pacific held 31.72% of the regulator network quality benchmarking solutions market share in 2025. The region combines mandatory QoS reporting, large mobile subscriber bases, and simultaneous 4G-to-5G transitions. India’s TRAI reached full mobile operator participation in automated Performance Monitoring Report submission for the latest reported quarter. South Korea expanded its next-generation mobile network assessment process by adding advisory thresholds and midterm compliance reviews. Australia, Japan, and Southeast Asian countries contribute through fixed-broadband quality programs and emerging next-generation network verification obligations.
North America and Europe support a substantial revenue base through established institutional systems and recurring programs. The U.S. BEAD program is supported by substantial infrastructure funding and requires annual subscriber-premises testing through the grant period. The FCC Measuring Broadband America program uses always-on whiteboxes at volunteer homes to maintain fixed-broadband measurement . BEREC’s coordinating role across 27 national authorities can create region-wide platform upgrade cycles when QoS guidance changes. In March 2026, Arcep added Ookla data to its public coverage mapping system alongside existing SpeedChecker data .
The Middle East is projected to expand at a 9.54% CAGR through 2031. Gulf countries combine high 5G adoption with QoS requirements in national digital programs. Kuwait’s CITRA commissioned a national campaign across urban and rural areas, highways, islands, and indoor environments. Jordan’s TRC is tracking next-generation network deployment toward a defined population-coverage target, while Anatel has established formal cooperation arrangements with Ookla, Opensignal, and M2 Catalyst in South America. Africa is at an earlier procurement stage, with Nigeria’s national coverage map initiative signaling wider adoption of data-led regulatory measurement.
Competitive Landscape
The regulator network quality benchmarking solutions market is moderately concentrated among global test and measurement specialists and crowdsourced-data providers. VIAVI Solutions, Keysight Technologies, EXFO, Rohde and Schwarz, and Anritsu compete on hardware depth and multi-technology protocol coverage. Ookla, Opensignal, and SpeedChecker compete through large-scale performance data and regulator-facing analytics. Buyers assess the range of reporting and analytical outputs that a supplier can produce. Integration with an authority’s existing workflows remains an important selection factor.
VIAVI completed its acquisition of Spirent’s high-speed Ethernet, network security, and channel emulation testing business in October 2025 for a substantial transaction value. The business was divested as part of the U.S. Department of Justice conditions for Keysight’s Spirent transaction. Keysight completed its acquisition of Spirent in October 2025 for a significant transaction value, adding automated assurance capabilities for 5G, SD-WAN, cloud, and autonomous-vehicle networks. These transactions show that leading suppliers are broadening adjacent testing capabilities. Larger research and development capacity is becoming more important for next-generation verification requirements.
Crowdsourced data providers are building regulator relationships through data-sharing arrangements and public portal integrations. Ookla’s regulator collaborations in Croatia, Nigeria, the Philippines, Brazil, and France demonstrate this model. Smaller suppliers such as Systemics-PAB, Netradar, and SpeedChecker are aligning methods with ETSI TR 103 559, which authorities increasingly use as a procurement reference. The regulator network quality benchmarking solutions industry favors systems that use open APIs, enabling authorities to place measurement results within their own data systems.
Regulator Network Quality Benchmarking Solutions Industry Leaders
-
Infovista SAS
-
Ookla, LLC
-
Rohde & Schwarz GmbH & Co. KG
-
P3 communications GmbH
-
Planet Network International SAS
- *Disclaimer: Major Players sorted in no particular order
Recent Industry Developments
- July 2026: RADCOM launched the Analytics Designer Module, enabling network data analysts to define, configure, and deploy custom datasets and KPIs in real time without vendor engagement, reducing analytics change cycles from months to the same day. The module is targeted for general availability to RADCOM ACE customers in Q3 2026.
- June 2026: NTT Docomo deployed Nokia's MantaRay AutoPilot on a public cloud, Japan's first AI-driven automated RAN quality optimization deployment and the world's first cloud-hosted implementation. The deployment achieved closed-loop control at 15-minute intervals instead of the prior daily cycle and supports NTT Docomo's target of TM Forum Autonomous Network Level 4.
- June 2026: Nokia unveiled an upgraded Autonomous Networks Agent Library and enhanced agentic AI capabilities at DTW26 in Copenhagen, including WaveSuite, an agentic framework for optical network operations that provides proactive KPI anomaly detection before service performance is affected.
- February 2026: RADCOM launched Neura, an AI agent suite integrating Customer Experience, Service Quality, and Network Optimization agents on the RADCOM ACE platform through Model Context Protocol, designed to transform service assurance into autonomous, intent-driven network operations.
Global Regulator Network Quality Benchmarking Solutions Market Report Scope
Regulator Network Quality Benchmarking Solutions Market refers to platforms and services that help telecom regulators independently measure, compare, and oversee the quality of fixed and mobile network services. These solutions collect QoS and QoE data through drive testing, probes, regulator applications, crowdsourcing, and passive or active measurements from end-user devices.
The Regulator Network Quality Benchmarking Solutions Market Report is Segmented by Solution Type (Regulatory Performance Management Platforms, Drive-Test and Walk-Test Benchmarking, Crowdsourced and Passive Measurement Platforms, Continuous Broadband Monitoring Agents, Test Call Generation and Service Assurance, Coverage Audit and GIS Intelligence, and Other Solution Types), Network Scope (Mobile Networks, Fixed Broadband Networks, Fixed Wireless Access Networks, and Other Network Scopes), KPI Domain (Coverage and Signal Quality, Throughput and Latency, Availability, Accessibility, and Reliability, and Voice, Video, Application QoE, and Other KPI Domains), By Deployment Model (Cloud-Based Deployment, On-Premises Deployment, Sovereign or Private-Cloud Deployment, and Managed Service Deployment), End User (National Telecommunications Regulators, Spectrum and Infrastructure Authorities, Universal-Service and Public-Funding Agencies, Government-Owned Network Operators, and Regulatory Contractors and Testing Firms), and Geography (North America, South America, Europe, Asia-Pacific, Middle East, and Africa). The Market Forecasts are Provided in Terms of Value (USD).
| Regulatory Performance Management Platforms |
| Drive-Test and Walk-Test Benchmarking |
| Crowdsourced and Passive Measurement Platforms |
| Continuous Broadband Monitoring Agents |
| Test Call Generation and Service Assurance |
| Coverage Audit and GIS Intelligence |
| Other Solution Types |
| Mobile Networks |
| Fixed Broadband Networks |
| Fixed Wireless Access Networks |
| Other Network Scopes |
| Coverage and Signal Quality |
| Throughput and Latency |
| Availability, Accessibility, and Reliability |
| Voice, Video, and Application QoE |
| Other KPI Domains |
| Cloud-Based Deployment |
| On-Premises Deployment |
| Sovereign or Private-Cloud Deployment |
| Managed Service Deployment |
| National Telecommunications Regulators |
| Spectrum and Infrastructure Authorities |
| Universal-Service and Public-Funding Agencies |
| Government-Owned Network Operators |
| Regulatory Contractors and Testing Firms |
| North America | United States |
| Canada | |
| Mexico | |
| South America | Brazil |
| Argentina | |
| Colombia | |
| Rest of South America | |
| Europe | United Kingdom |
| Germany | |
| France | |
| Italy | |
| Spain | |
| Russia | |
| Rest of Europe | |
| Asia-Pacific | China |
| Japan | |
| India | |
| South Korea | |
| Australia | |
| Indonesia | |
| Rest of Asia-Pacific | |
| Middle East | Saudi Arabia |
| United Arab Emirates | |
| Turkiye | |
| Qatar | |
| Rest of Middle East | |
| Africa | South Africa |
| Nigeria | |
| Kenya | |
| Egypt | |
| Rest of Africa |
| By Solution Type | Regulatory Performance Management Platforms | |
| Drive-Test and Walk-Test Benchmarking | ||
| Crowdsourced and Passive Measurement Platforms | ||
| Continuous Broadband Monitoring Agents | ||
| Test Call Generation and Service Assurance | ||
| Coverage Audit and GIS Intelligence | ||
| Other Solution Types | ||
| By Network Scope | Mobile Networks | |
| Fixed Broadband Networks | ||
| Fixed Wireless Access Networks | ||
| Other Network Scopes | ||
| By KPI Domain | Coverage and Signal Quality | |
| Throughput and Latency | ||
| Availability, Accessibility, and Reliability | ||
| Voice, Video, and Application QoE | ||
| Other KPI Domains | ||
| By Deployment Model | Cloud-Based Deployment | |
| On-Premises Deployment | ||
| Sovereign or Private-Cloud Deployment | ||
| Managed Service Deployment | ||
| By End User | National Telecommunications Regulators | |
| Spectrum and Infrastructure Authorities | ||
| Universal-Service and Public-Funding Agencies | ||
| Government-Owned Network Operators | ||
| Regulatory Contractors and Testing Firms | ||
| By Geography | North America | United States |
| Canada | ||
| Mexico | ||
| South America | Brazil | |
| Argentina | ||
| Colombia | ||
| Rest of South America | ||
| Europe | United Kingdom | |
| Germany | ||
| France | ||
| Italy | ||
| Spain | ||
| Russia | ||
| Rest of Europe | ||
| Asia-Pacific | China | |
| Japan | ||
| India | ||
| South Korea | ||
| Australia | ||
| Indonesia | ||
| Rest of Asia-Pacific | ||
| Middle East | Saudi Arabia | |
| United Arab Emirates | ||
| Turkiye | ||
| Qatar | ||
| Rest of Middle East | ||
| Africa | South Africa | |
| Nigeria | ||
| Kenya | ||
| Egypt | ||
| Rest of Africa | ||
Key Questions Answered in the Report
What is the regulator network quality benchmarking solutions market size?
The regulator network quality benchmarking solutions market size is USD 0.79 billion in 2026 and is forecast to reach USD 1.23 billion by 2031 at a 9.19% CAGR. The estimate reflects recurring requirements for independent network measurement, compliance reporting, and consumer performance transparency.
What is driving demand for network quality benchmarking solutions?
Demand in the regulator network quality benchmarking solutions market is supported by mandatory independent QoS testing, 5G rollout verification, public broadband funding requirements, and consumer transparency tools. These requirements move testing from periodic field work toward continuing evidence collection and reporting.
Which network scope has the largest share?
Mobile Networks held 55.61% of revenue in 2025 because spectrum licenses require recurring verification of coverage, availability, and throughput. The regulator network quality benchmarking solutions market therefore relies on a large installed base of licenses with continuing compliance responsibilities.
Which deployment model is expanding fastest?
Sovereign or Private-Cloud Deployment is projected to expand at a 9.82% CAGR through 2031 as authorities address data-localization requirements. The regulator network quality benchmarking solutions market needs comparable measurement capabilities across public-cloud, private-cloud, and isolated environments.
Which region leads demand for these solutions?
Asia-Pacific held 31.72% of revenue in 2025, supported by mandatory reporting systems, large subscriber bases, and 4G-to-5G transitions. The regions regulator network quality benchmarking solutions market demand also reflects increasingly detailed consumer-experience and coverage obligations.
Why do regulators use crowdsourced network data?
Crowdsourced data can provide wide geographic coverage, supplement controlled testing, and support public coverage maps and recurring QoE monitoring. It enables a regulator network quality benchmarking solutions market buyer to observe performance across a broader footprint without relying only on scheduled drive tests.