
Refrigerated Trailer Market Size and Share
Market Overview
| Study Period | 2019 - 2031 |
|---|---|
| Market Size (2026) | USD 7.98 Billion |
| Market Size (2031) | USD 10.96 Billion |
| Growth Rate (2026 - 2031) | 6.55 % |
| Fastest Growing Market | Asia-Pacific |
| Largest Market | North America |
| Market Concentration | Medium |
Major Players *Disclaimer: Major Players sorted in no particular order Image © Mordor Intelligence. Reuse requires attribution under CC BY 4.0. | |
Refrigerated Trailer Market Analysis by Mordor Intelligence
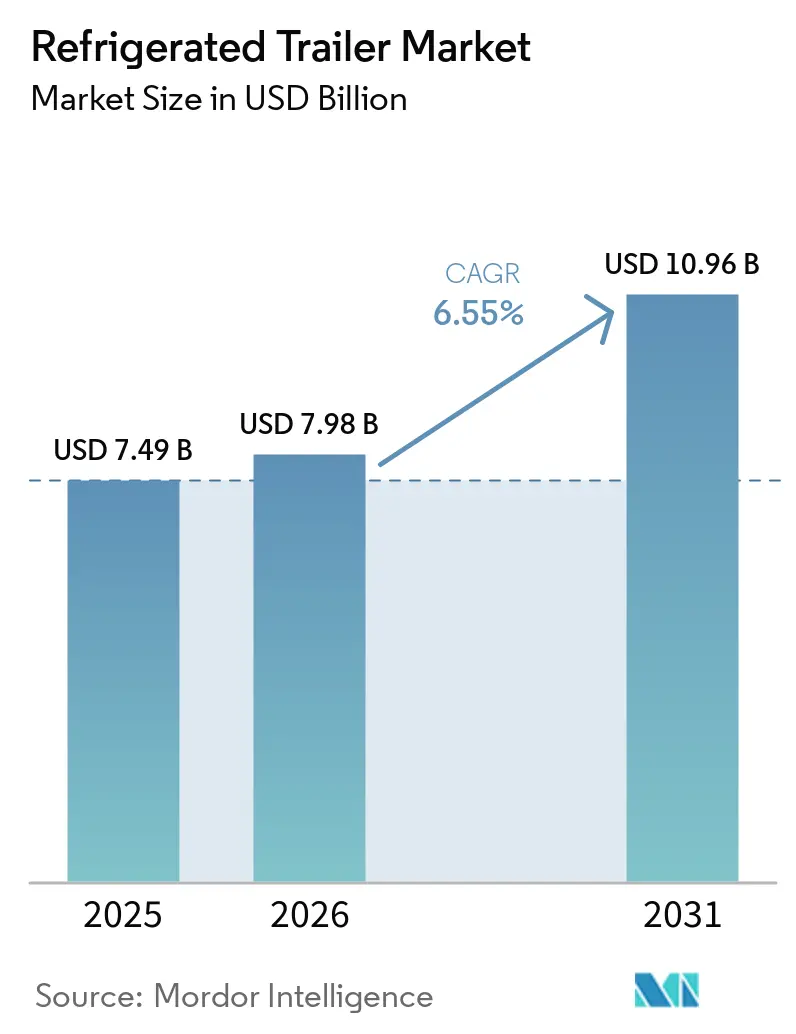
The refrigerated trailer market size was valued at USD 7.49 billion in 2025 and estimated to grow from USD 7.98 billion in 2026 to reach USD 10.96 billion by 2031, at a CAGR of 6.55% during the forecast period (2026-2031). E-commerce grocery fulfillment, rigorous food safety mandates, and a shift toward electric refrigeration platforms fuel growth. The refrigerated trailer market continues to benefit from indispensable infrastructure needs spanning pharmaceuticals, fresh produce, and animal protein distribution, thereby shielding demand during macroeconomic slowdowns. Competitive strategies now revolve around telematics integration, subscription-based asset services, and low-GWP refrigerants that comply with tightening environmental regulations. Simultaneously, large fleet operators accelerate equipment replacement cycles to comply with California Air Resources Board (CARB) and European F-Gas regulations. At the same time, emerging economies are scaling up cold-chain capacity to serve urbanizing populations.
Key Report Takeaways
- By product type, frozen food trailers captured 54.62% of the refrigerated trailer market share in 2025; chilled food trailers are projected to expand at an 8.33% CAGR to 2031.
- By trailer length, units above 49 feet held 52.05% of the refrigerated trailer market share in 2025, while trailers up to 28 feet will record the fastest 8.05% CAGR through 2031.
- By power source, diesel ICE platforms accounted for 64.35% of the refrigerated trailer market size in 2025; full-electric systems are forecast to grow at an 11.22% CAGR between 2026 and 2031.
- By end-user, meat and seafood led with 38.86% of the refrigerated trailer market share in 2025; pharmaceuticals and life sciences represent the fastest-growing application at a 7.05% CAGR.
- By geography, North America commanded 39.15% of the refrigerated trailer market share in 2025, whereas Asia-Pacific is set to climb at an 8.92% CAGR through the forecast horizon.
Note: Market size and forecast figures in this report are generated using Mordor Intelligence’s proprietary estimation framework, updated with the latest available data and insights as of 2026.
Market Trends and Insights
Drivers Impact Analysis of Refrigerated Trailer Market*
| Driver | (~) % Impact on CAGR Forecast | Geographic Relevance | Impact Timeline |
|---|---|---|---|
| E-Commerce-Led Last-Mile Delivery | +1.8% | Global; focus on North America and Europe | Medium term (2-4 years) |
| Hybrid and Electric Refrigeration Shift | +1.5% | North America and core; Asia-Pacific follow-on | Long term (≥ 4 years) |
| Tighter Food Safety Rules | +1.2% | North America and Europe; spreading to Asia-Pacific | Long term (≥ 4 years) |
| Accelerated Cold-Chain Expansion | +1.1% | Asia-Pacific core; MEA and South America spill-over | Medium term (2-4 years) |
| Analytics Driving Predictive Maintenance and Uptime | +0.8% | Global; early adoption in North America and Europe | Short term (≤ 2 years) |
| ESG Speeding Up Fleet Modernization | +0.5% | Global; concentrated in developed markets | Medium term (2-4 years) |
| Source: Mordor Intelligence | |||


Growing Demand for E-Commerce-Driven Last-Mile Cold-Chain Deliveries
Online grocery services reshape delivery frequency and trailer design, prompting fleets to deploy shorter, agile units that navigate dense urban corridors with multi-temperature zones. Performance Food Group deployed more than 30 battery-electric refrigerated trailers in California to support zero-emission fulfillment centers, underscoring the commercial viability of electric systems [1]“Electrifying the Cold Chain,” Performance Food Group, pfgc.com. The versatility of up-to-28-foot units underpins their growth, while precise telematics such as Thermo King’s TracKing platform maintain cargo integrity within ±0.9 °F during stop-and-go routes[2]“TracKing Smart Trailer Brochure,” Thermo King, thermoking.com. Fleets investing in electric trailers also capitalize on municipal noise-reduction rules and on overnight delivery windows that are unattainable for diesel units. As cities roll out congestion pricing and zero-emission zones, operators see electric refrigerated trailers as a hedge against future access restrictions. Therefore, the convergence of e-commerce growth and sustainability policies cements compact, battery-powered equipment as an essential node in next-generation cold chains.
Shift Toward Diesel-Free Hybrid and Fully Electric Transport Refrigeration Units
California's new regulations are hastening the move away from diesel-powered transport refrigeration units (TRUs), pushing fleets to adopt zero-emission alternatives. Hybrid solutions, exemplified by Carrier's advanced units using renewable fuels, are effectively reducing emissions during this transition. While fully electric TRUs boast lower maintenance requirements, they face challenges due to their reliance on charging infrastructure. Innovations like solar-powered reefers, which utilize rooftop and regenerative energy, are not only broadening operational ranges but also slashing fuel costs. With California's standards setting a national precedent, the once-dominant diesel is slowly making way for scalable electric platforms.
Stricter Food-Safety Regulations Mandating Temperature Logging and Traceability
Implementing FSMA 204 in the United States forces shippers to document end-to-end temperature histories for high-risk foods. Non-compliance can trigger recalls and civil penalties that outweigh incremental equipment costs, driving adoption of telematics-enabled trailers capable of automatic data uploads. Great Dane now offers FleetPulse telematics as standard on new refrigerated models, providing real-time alerts to simplify audit readiness[3]“FleetPulse Becomes Standard on Great Dane Trailers,” Transport Topics, transporttopics.com. Regulation (EC) 852/2004 in the EU underpins similar traceability requirements, encouraging fleets to retrofit legacy trailers with Bluetooth probes and cloud dashboards. The regulatory push benefits suppliers that bundle hardware, software, and compliance reporting into subscription packages. Over the long term, temperature-logging mandates will likely harmonize globally, creating a rising baseline specification for every refrigerated trailer market participant.
Fleet Data Analytics Enabling Predictive Maintenance and Uptime Gains
Artificial intelligence (AI) is revolutionizing refrigerated trailer operations. AI can now foresee component failures by merging real-time sensor data with historical maintenance records. This forward-thinking strategy minimizes the need for emergency repairs, safeguarding temperature-sensitive cargo. Machine-learning models enhance inventory accuracy and mitigate spoilage risks in cold storage facilities. Fleet operators leverage telemetry to monitor tire pressure, averting breakdowns that could disrupt refrigeration cycles. Predictive maintenance streamlines technician scheduling, ensures parts availability, boosts trailer uptime, and manages warranty costs. With telematics becoming increasingly affordable, even mid-sized fleets are embracing analytics platforms, positioning data-driven operations as a pivotal competitive advantage in refrigerated transport.
Restraints Impact Analysis of Refrigerated Trailer Market*
| Restraint | (~) % Impact on CAGR Forecast | Geographic Relevance | Impact Timeline |
|---|---|---|---|
| Premium of Electric/Hybrid TRUs | –1.2% | Global; sharpest in emerging markets | Medium term (2-4 years) |
| Charging and Shore-Power Infrastructure | –0.8% | North America and Europe; global expansion | Long term (≥ 4 years) |
| Driver Shortage Constraining Refrigerated Capacity | –0.6% | North America and Europe; nascent in Asia-Pacific | Short term (≤ 2 years) |
| Volatile HFC Phase-Down Legislation | –0.4% | Global; region-specific rules | Medium term (2-4 years) |
| Source: Mordor Intelligence | |||
High Upfront Cost Premium of Electric/Hybrid TRUs Versus Diesel
Battery-electric TRUs can cost two to three times as much as diesel units, extending payback periods beyond five years for fleets without access to subsidies. Smaller carriers reliant on commercial loans face higher interest rates, making cash-flow alignment difficult. Wabash National counters the hurdle via Trailers-as-a-Service subscriptions that bundle hardware, maintenance, and telematics into monthly payments, shifting capex to opex [4]“Trailers-as-a-Service Fact Sheet,” Wabash National Corporation, wabashnational.com. Training technicians to safely maintain high-voltage systems adds indirect costs, while regional electricity prices influence the total cost of ownership. Until battery prices fall or incentives broaden, diesel will persist where fuel taxation and emission penalties remain modest.
Limited Charging and Shore-Power Infrastructure Along Long-Haul Corridors
Nationwide charging networks designed for tractors seldom account for trailer refrigeration loads, forcing fleets to plan detours or idle diesel backups. Performance Food Group installed 15 freeway-adjacent Boost Chargers to mitigate range anxiety for its California fleet. Even brief charging delays risk temperature drift for perishable loads, nudging operators toward hybrid configurations that can switch to diesel mid-route. Distribution centers with shore-power pedestals can slash idling, yet retrofits require electrical upgrades that tenants may resist funding. Broad utility collaboration is needed to align infrastructure timelines with zero-emission fleet mandates.
*Our forecasts treat driver/restraint impacts as directional, not additive. The impact forecasts reflect baseline growth, mix effects, and variable interactions.
Refrigerated Trailer Market Segment Analysis
By Product Type:
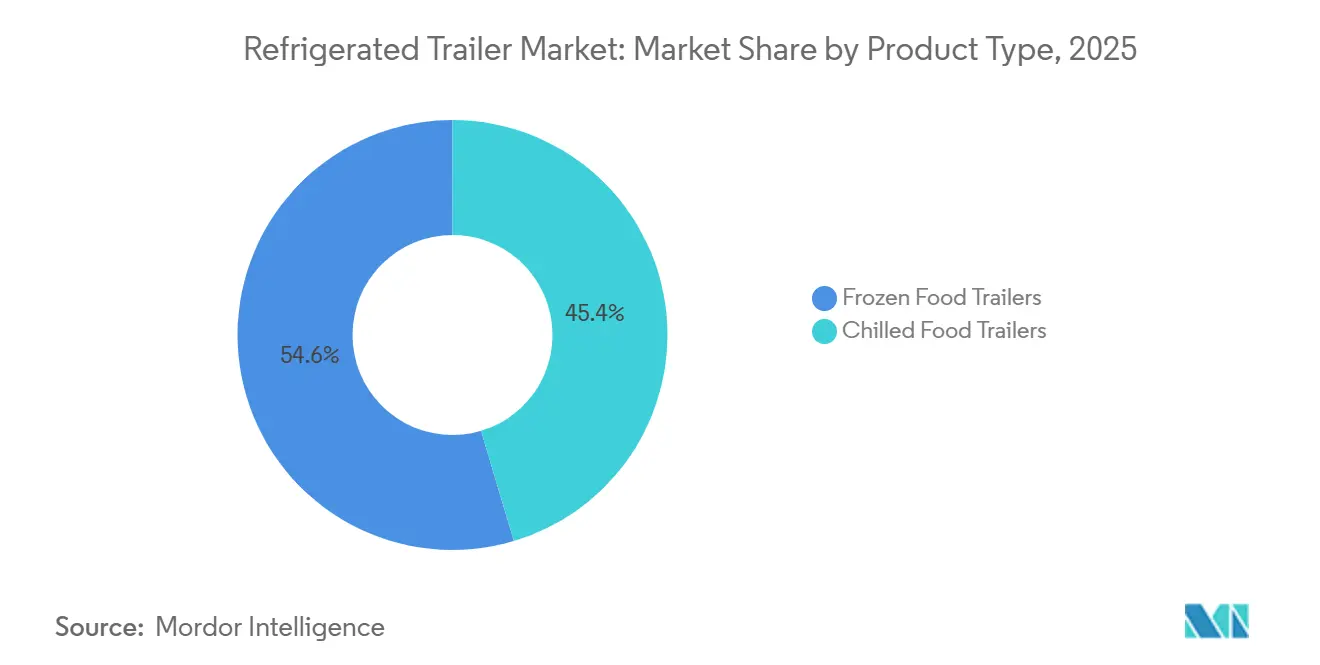
Frozen Dominance Meets Chilled GrowthFrozen trailers accounted for 54.62% of the refrigerated trailer market in 2025, driven by meat, seafood, and ready-meal logistics that demand sub-zero integrity. Operators justify higher insulation and dual-compressor systems because cargo values routinely exceed USD 100,000 per load. Conversely, chilled trailers are forecast to post an 8.33% CAGR through 2031, as online grocery and pharmaceutical biologics require stability at 36-46 °F, prompting fleets to invest in multi-zone liners and rapid-cool evaporators.
Technological convergence blurs boundaries: Great Dane’s Everest platform allows operators to toggle between frozen and chilled modes via variable-speed compressors and movable bulkheads. CARB’s low-GWP mandates favor refrigerants effective across a broad temperature envelope, nudging OEMs to design flexible systems. As fresh produce lead times tighten, carriers increasingly seek trailers that can transport strawberries one day and ice cream the next without risking thermal leakage.

By Trailer Length:
Long-Haul Leadership Versus Urban AgilityTrailers exceeding 49 feet accounted for 52.05% of the refrigerated trailer market share in 2025, reflecting economies of scale on interstate lanes, where dock doors and cross-docks are standardized around 53-foot assets. The segment’s endurance owes much to predictable cube utilization and reduced trips per ton-mile. Meanwhile, trailers up to 28 feet will log the fastest 8.05% CAGR as city logistics mount congestion rules that penalize oversized rigs.
Municipal delivery windows favor vehicles capable of tight-radius turns and curbside docking; therefore, smaller refrigerated bodies capture e-grocery and meal-kit traffic in Chicago, Paris, and Singapore. Hybrid fleets mix 48-foot linehaul units feeding urban depots served by 28-foot satellites, echoing hub-and-spoke air-cargo logic. OEMs answer with modular refrigeration packages adaptable across chassis lengths, allowing fleet managers to consolidate parts inventories.
By Refrigeration Power Source:
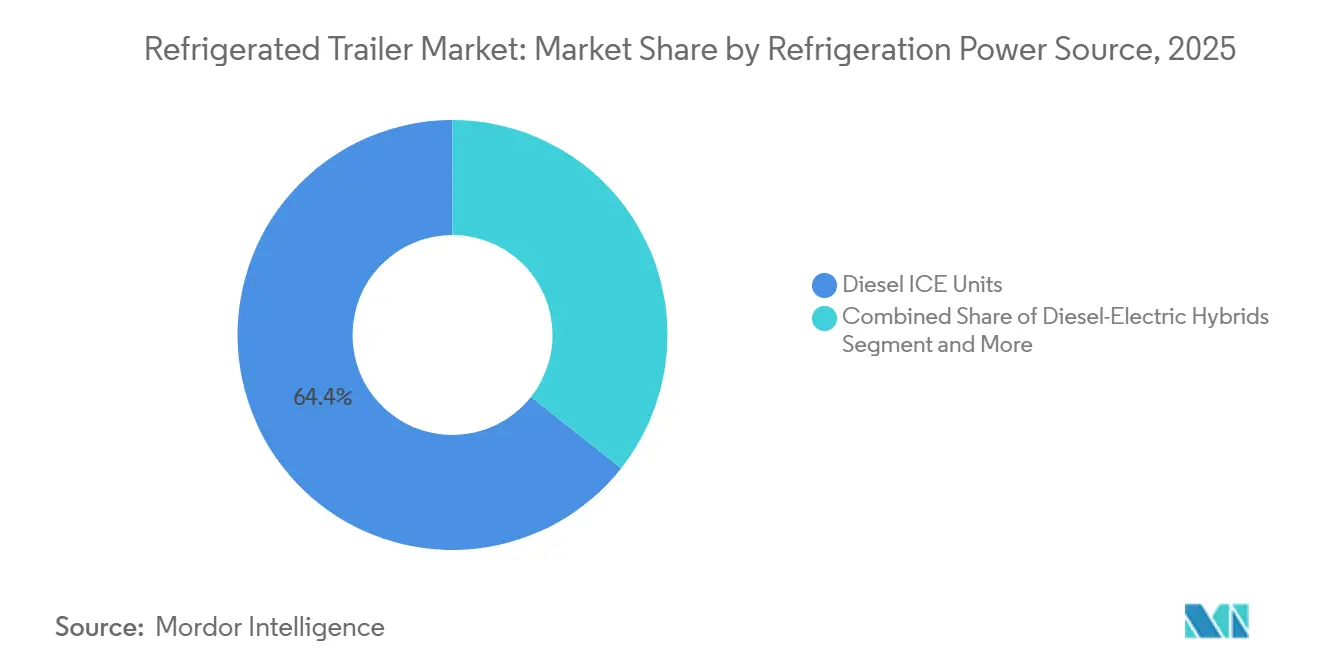
Diesel Incumbency Faces Electric DisruptionDiesel ICE solutions represented 64.35% of the refrigerated trailer market share in 2025, underpinned by mature fueling infrastructure and technician familiarity. Operating cost predictability and rapid refueling keep diesel appealing on 2,500-mile cross-country legs. Yet full-electric systems are projected to grow 11.22% annually as CARB and EU emission ceilings tighten. Incentives like California’s HVIP shave upfront costs, while battery density has climbed above 260 Wh/kg, enabling 12-hour cold-soak endurance.
Hybrid and cryogenic variants serve bridge markets; for example, liquid-nitrogen systems reduce noise for overnight urban deliveries but face scarcity of refilling stations. Thermo King’s Advancer electrifies the compressor but retains a Tier 4 generator, offering carriers a compliance hedge until charging networks mature. As lithium prices normalize and renewable shares rise in grid mixes, total-life emissions recalculations favor electric TRUs.

By End User:
Protein Dominance Meets Pharma GrowthMeat and seafood accounted for 38.86% of the refrigerated trailer market share in 2025, riding global protein demand and stringent pathogen-control norms that necessitate −4 °F setpoints. Consolidation among processors yields high-volume contracts that underpin fleet asset utilization. Pharmaceuticals and life sciences are projected to grow at a 7.05% CAGR, galvanizing demand for ±2 °F precision plus 24/7 telematics with audit trails, creating pricing latitude for premium features.
Dairy and fresh produce maintain mid-single-digit growth underpinned by health-conscious diets, while bakery and confectionery require seasonal surge capacity for holiday shipping. FDA GDP guidelines push pharma shippers to specify redundant power modules and door-opening analytics. These features trickle down to food segments over time, lifting the refrigerated trailer market’s overall technology baseline.
Geography Analysis
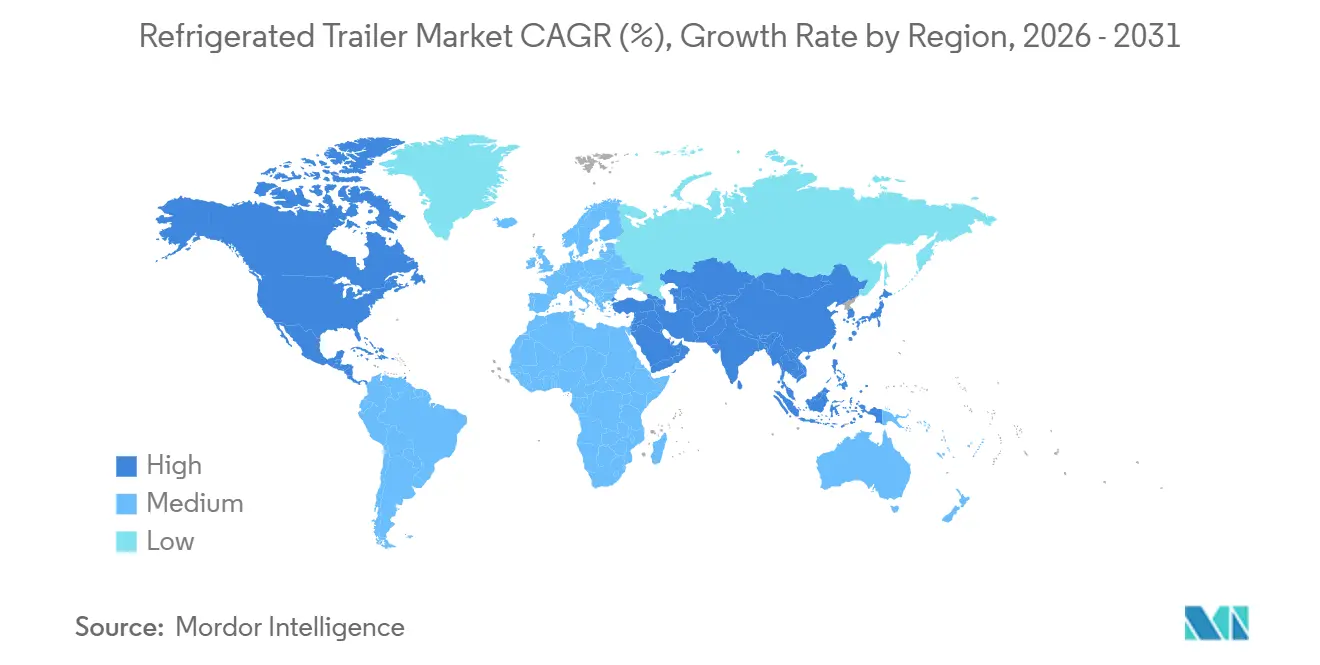
North America led the refrigerated trailer market with a 39.15% revenue share in 2025, anchored by robust interstate highways, warehouse automation, and FSMA rules that obligate digital temperature logs. Core demand averages 44,000 units per year, with 2025 orders rebounding after a brief dip in 2024 due to chassis delays. Fleets adopt subscription models and electric TRUs to satisfy retailer ESG scorecards, while telematics penetration surpasses 70%, enabling predictive maintenance and route optimization.
Asia-Pacific will record the fastest regional growth at an 8.92% CAGR, propelled by investments such as JBS’s USD 100 million Vietnamese meat hub and rapid urbanization that elevates per-capita cold-chain spending. Local assembly lines reduce import duties, making compliant trailers more affordable for regional fleets. Government subsidies in China and India for agricultural cold storage indirectly stimulate demand for trailers, and ride-hailing platforms are experimenting with shared-capacity cold vans, signaling potential modal convergence.
Europe continues to expand as the revised F-Gas Regulation spurs the replacement of high-GWP R404A systems with natural refrigerants such as CO₂ and propane, especially in Germany, France, and the Nordics. Total cost-of-ownership calculations favor fully electric trailers on dense distribution routes with ample shore power. Emerging markets in Latin America and Africa follow, with infrastructure projects funded by development banks, though currency volatility tempers the pace of fleet investment.
Mordor Intelligence provides coverage of the refrigerated trailer market across other key regional markets. Detailed country-level analysis extends to Indonesia, Saudi Arabia, and Malaysia incorporating local coverage and market participation, as required.

Regulatory Landscape
Regulation is increasingly shaping refrigerated trailer specifications through parallel requirements on TRU engine emissions, refrigerant management, and digital traceability. In the United States, the California Air Resources Board (CARB) continues to implement the TRU Airborne Toxic Control Measure (ATCM). The US EPA granted partial authorization in January 2025 for CARB's 2022 TRU amendments (covering particulate matter standards, refrigerant GWP limits, and reporting elements), thereby reinforcing compliance-driven replacement activity in California fleets.
Environmental rules are also converging with broader heavy-duty decarbonization frameworks. In May 2026, the US EPA issued a proposed rule that would affect leak repair requirements under the AIM Act for road and intermodal container TRUs, effective January 1, 2026. At the same time, in May 2026, the Council of the European Union discussed an amended approach to accounting for trailer-related CO2 performance, explicitly recognizing electrified TRUs as a pathway to lower greenhouse gas emissions in freight operations. In Australia, the government-backed Clean Energy Finance Corporation (CEFC) committed up to AUD 10 million in May 2026 to support the deployment of more than 100 Sunswap Endurance electric transport refrigeration units, reflecting how public finance is being used to accelerate the uptake of compliant equipment alongside tightening emissions policies.
Value Chain Analysis
The value chain spans steel and aluminum inputs, insulated panel and composite body manufacturing, chassis and axle suppliers, TRU OEMs (diesel, hybrid, and battery-electric), and electronics providers for sensors and telematics. Trailer OEMs (including Great Dane, Utility Trailer, Wabash, Schmitz Cargobull, and Krone) typically integrate bodies and running gear, then coordinate TRU fitment either at the factory, through dedicated final-assembly operations, or via dealer networks. The aftermarket layer includes refrigerant service, parts distribution, and mobile maintenance contracts. Industry associations such as the Truck Trailer Manufacturers Association (TTMA) and CLCCR support standard-setting, technical guidance, and advocacy across manufacturers and suppliers.
Compliance and trade policy are becoming more visible constraints within the chain. In the European Union, Commission Implementing Regulation (EU) 2024/2215 (effective September 2024) sets minimum certification requirements for personnel handling refrigeration systems that contain fluorinated greenhouse gases, thereby increasing the importance of qualified service networks for fleets and dealers. In the United States, a coalition including Great Dane, Stoughton Trailers, Strick Trailers, and Wabash requested the Department of Commerce to include refrigerated trailers under Section 232 tariffs on steel and aluminum, signaling how material costs and sourcing strategies can influence trailer pricing and build schedules. On the demand-enablement side, cold-chain infrastructure gaps in emerging corridors (including limited port-based refrigerated storage cited in Paraguay assessments) can shift trailer utilization patterns and raise demand for reliable long-haul reefer assets that bridge sparse node networks.
Competitive Landscape
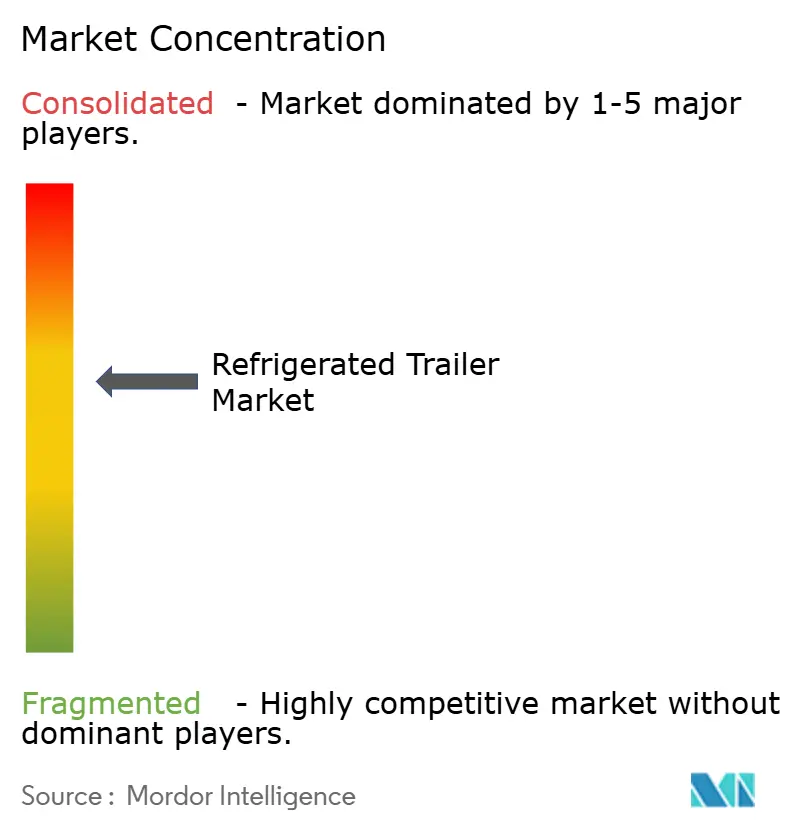
Established OEMs such as Wabash National, Great Dane, and Utility command brand recognition and deep dealer footprints. However, the market remains moderately fragmented. Strategic differentiation centers on telematics, with Great Dane bundling FleetPulse sensors that deliver real-time tire, brake, and temperature data. Wabash National extends the value proposition through Trailers-as-a-Service, converting capital expense into a managed subscription that includes preventative maintenance.
Electrification intensifies rivalry as diversified industrials like Carrier and Trane Technologies cross-pollinate HVAC R&D into transport applications. Partnerships between trailer builders and e-power specialists are multiplying; TIP Group’s three-party alliance with SolarEdge and Mitsubishi Heavy Industries pioneers solar-assisted battery charging, signaling opportunities for vertical integration. Midsize challengers carve cryogenic or hydrogen fuel-cell refrigeration niches, whereas Asian entrants leverage cost advantages to gain share in price-sensitive markets.
Service ecosystems grow in importance: OEMs expand parts depots and mobile repair coverage to guarantee uptime, while predictive analytics platforms monetize data through performance-based contracts. Regulatory compliance capability becomes a moat; manufacturers can certify equipment to CARB, EPA, and EU F-Gas standards and lock in multi-region fleet deals. Intellectual-property development skews toward battery management, thermal insulation composites, and low-GWP refrigerant circuits, reinforcing the knowledge barrier for new entrants.
Refrigerated Trailer Industry Leaders
Wabash National Corporation
Great Dane LLC
Utility Trailer Manufacturing Company
Schmitz Cargobull AG
Fahrzeugwerk Bernard Krone GmbH
- *Disclaimer: Major Players sorted in no particular order
Refrigerated Trailer Market Companies Covered in this Report
- Wabash National Corporation
- Great Dane LLC
- Utility Trailer Manufacturing Company
- Schmitz Cargobull AG
- Kogel Trailer GmbH
- Lamberet SAS
- Fahrzeugwerk Bernard Krone GmbH
- Montracon Ltd
- Randon Implementos
- Gray & Adams Ltd
- Hyundai Translead
- CIMC Vehicles Group
- Chereau (The Reefer Group)
- Polar King International Inc.
- Stoughton Trailers LLC
- Vanguard National Trailer Corp.
- SOR Iberica

Market Opportunities and Future Outlook
Electrification and low-GWP compliance packages are creating a clear opportunity for OEMs and TRU suppliers to bundle equipment, software, and service into an audit-ready offering. California's CARB TRU program and the EU's F-gas directive are pushing fleets to evaluate hybrid and full-electric TRU architectures, which in turn elevates demand for validated thermal-efficiency upgrades (insulation, liner systems, and energy-recovery features) and for telematics that support temperature logging and compliance reporting. Public finance is also supporting deployment at scale, including the CEFC commitment (up to AUD 10 million) in May 2026 to support more than 100 Sunswap Endurance electric TRUs in Australia, which can help catalyze local service ecosystems and parts availability for electric refrigeration platforms.
Cold-chain facility build-outs are tightening the linkage between warehousing nodes and refrigerated trailer utilization, particularly for pharma, protein exports, and import-export flows. In June 2026, Americold opened an integrated cold-chain facility at Port Saint John in New Brunswick. In July 2026, UPS announced a USD 48 million investment to open 27 temperature-controlled cross-dock facilities for pharmaceutical and biotech logistics, expanding the network of temperature-controlled handoffs that depend on consistent trailer performance and data capture. Emerging-market automation projects add another set of opportunities for compatible trailer and TRU designs, such as Ally Logistic Property's RM500 million OMEGA 2 Shah Alam multi-story cold chain development in Malaysia (announced May 2026), where high-throughput dock operations increase the value of rapid pull-down performance, durable insulation, and remote diagnostics. In China, the implementation of GB 29753-2023 from January 2024 reinforces equipment test and safety requirements for refrigerated vehicles, supporting a clearer baseline for compliant designs in a large-volume market.
Recent Industry Developments in Refrigerated Trailer Market
- September 2026: Circle Logistics, a freight brokerage and third-party logistics provider specializing in temperature-controlled and dry van transportation, expanded its refrigerated less-than-truckload (LTL) services for food and beverage shippers. Refrigerated LTL consolidates multiple pallet shipments into a single temperature-controlled trailer, allowing smaller producers to transport partial loads without paying for a full truckload.
- May 2026: Big Chill Distribution, in partnership with TR Group, announced the trial of a fully electric refrigerated trailer from Schmitz Cargobull in New Zealand. Fruehauf NZ, Schmitz Cargobull’s exclusive partner and distributor in New Zealand, stated that the S.KOe Cool trailer represented “a major step forward in sustainable freight technology” by eliminating the need for a conventional diesel-powered refrigeration unit.
- March 2026: Utility Trailer Manufacturing Company launched next-generation Cargobull 625+ Mono-Temp Hybrid and 655MT+ Multi-Temp Hybrid transport refrigeration units. The release expanded hybrid TRU availability for fleets navigating zero-emission rules and shore-power constraints, while retaining multi-temperature capability for mixed-load operations.


Refrigerated Trailer Market Report Scope and Research Methodology
Market Definition and Coverage
This market covers revenue earned from refrigerated trailers used to move temperature sensitive goods, where a trailer body is paired with an active refrigeration system and sold or supplied into commercial transport use.
Scope exclusions: We exclude refrigerated trucking services, tractor units, and passive insulated boxes without an active refrigeration system.
Segments Covered in This Report
- By Product Type (Temperature Class)
- Frozen Food Trailers
- Chilled Food Trailers
- By Trailer Length / Capacity
- Up to 28 ft (Pup and City)
- 29 - 49 ft (Standard)
- Above 49 ft (Long-haul/53 ft)
- By Refrigeration Power Source
- Diesel ICE Units
- Diesel-Electric Hybrids
- Full-Electric/Battery-Powered Units
- Cryogenic and Alt-Fuel Units
- By End User
- Dairy Products
- Fruits and Vegetables
- Meat and Seafood
- Pharmaceuticals and Life Sciences
- Bakery and Confectionery
- Other End Users
- By Geography
- North America
- United States
- Canada
- Rest of North America
- South America
- Brazil
- Argentina
- Rest of South America
- Europe
- Germany
- United Kingdom
- France
- Italy
- Spain
- Russia
- Rest of Europe
- Asia-Pacific
- China
- India
- Japan
- South Korea
- Australia and New Zealand
- Rest of Asia-Pacific
- Middle East and Africa
- United Arab Emirates
- Saudi Arabia
- Turkey
- South Africa
- Egypt
- Rest of Middle East and Africa
- North America
Data Sources, Market Sizing, and Validation
Desk Research
Desk work started with building the demand context for cold chain freight and the supply context for trailers, and then narrowing it to refrigerated units. We leaned on public datasets that help explain where refrigerated transport demand is rising, such as US Department of Transportation and Bureau of Transportation Statistics releases, Eurostat transport and trade tables, UN Comtrade, and World Bank macro indicators.
To keep assumptions realistic, we also reviewed standards and compliance direction that can change replacement cycles and equipment choices, such as EPA refrigerant and emissions references and EU policy notes around refrigerants. These were combined with company annual reports, investor presentations, and reputable logistics and food cold chain association publications, plus a paid subscription for company financials and news to cross-check revenue splits and timing of large fleet orders. The sources listed here are illustrative, and many other public and secondary references were used to fill gaps and validate assumptions.
Primary Interviews and Surveys
Primary discussions were used to pressure test what we saw in public data, especially around average selling price ranges, replacement behavior, and the mix shift between diesel, hybrid, and electric refrigeration power. We spoke with a mix of trailer OEM and component ecosystem participants, fleet and leasing decision makers, and cold chain users across food and pharma, with coverage spread across major buying regions so regional regulation and operating conditions were not averaged away.
Distribution of primary research fieldwork respondents
| Company type | Respondent position | Region |
|---|---|---|
| Top tier: 37% | CXOs: 17% | APAC: 46% |
| Mid tier: 45% | Functional/Unit leaders: 36% | EMEA: 31% |
| Smaller Players: 18% | Managers: 47% | Americas: 23% |
Market-Sizing & Forecasting
Sizing begins with a top-down build that reconstructs the refrigerated trailer demand pool by linking cold chain freight expansion and fleet replacement needs to new trailer registrations and trailer production signals, and then converting that into value using price bands. Once that core total is formed, we corroborate it with selective bottom-up approximations, such as sampled OEM and supplier revenue roll ups by region, and channel checks on delivered units and typical trailer ASP ranges, which then helps adjust outliers.
Inputs that matter in this market include reefer trailer unit deliveries (where visible through registrations and manufacturer commentary), average trailer price progression, refrigeration unit technology mix (diesel versus hybrid versus electric), cold chain capacity additions like warehouse footprint and throughput signals, and regulatory pressure points that shift adoption of low-GWP refrigerants and electrified systems. Where bottom-up signals are incomplete, gaps are handled through conservative share based allocation anchored to visible regional production and fleet size indicators, and then re-tested with interview feedback.
For forecasting, we mainly use scenario analysis supported by multivariate regression checks, because demand can swing with food inflation, cross-border trade volumes, and fleet utilization, and those drivers do not move in a straight line. The final forecast path is kept consistent with what interviewees expect for replacement cycles, technology adoption speed, and the timing of regulatory driven upgrades.
Data Validation & Update Cycle
Model outputs are validated through triangulation across independent signals, such as shipment and trade trends, announced fleet additions, and observed price movements for trailers and refrigeration systems. When a region shows an unusual jump, the assumptions are reviewed, the math is rechecked by another analyst, and follow-up calls are triggered to confirm whether the change is structural or timing related.
We refresh the report annually, and interim updates are made when material events occur, such as major regulation changes, sharp currency moves, or demand shocks in food and pharma logistics. Before delivery, a fresh review pass is completed so clients receive a current view rather than an older snapshot.
Mordor Intelligence's Refrigerated Trailer Market Size Versus Other Published Estimates
Published market sizes for refrigerated trailers can look far apart, even when they talk about similar growth drivers, because the scope and the way pricing is applied is not always consistent. Differences also come from the year used as the base, how inflation and currency conversion are handled, and whether the total is validated against unit and replacement signals.
In our work, the biggest gap drivers usually come from whether the count is limited to trailer revenue only, how power source mix changes are translated into ASP (diesel versus hybrid versus electric), and whether the model is refreshed when refrigerant and emissions rules shift buying behavior across regions.
Benchmark comparison
| Source | Market Size | Gaps in Research Methodology |
|---|---|---|
| Mordor Intelligence | USD 7.98 B (2026) | |
| Trade Journal A | USD 6.52 B (2024) | Uses an earlier base year and tends to hold pricing and technology mix more static, which can understate the value lift from electric and hybrid refrigeration adoption in newer orders. |
| Global Consultancy B | USD 8.90 B (2026) | Leans more heavily on broad end-use expansion assumptions and can blend adjacent temperature-controlled equipment definitions, which can push totals upward when trailer-only revenue is not cleanly separated. |
The table shows that most variance is explained by timing and by what gets counted into trailer value, not by disagreement on demand direction. By keeping the total tied to trailer-only revenue and rechecking ASP and technology mix with replacement cycle signals, the estimate stays repeatable, which is the approach applied by Mordor Intelligence.


Key Questions Answered in the Report
How large is the refrigerated trailer market in 2026?
The refrigerated trailer market is estimated at USD 7.98 billion in 2026, driven by the expansion of e-commerce grocery services and stricter food safety regulations.
What is the projected growth rate for refrigerated trailers?
Global demand is anticipated to rise at a 6.55% CAGR, taking revenue to USD 10.96 billion by 2031.
Which product segment leads current sales?
Frozen food trailers accounted for 54.62% of 2025 sales due to the dominance of meat and seafood logistics.
How are regulations influencing trailer technology?
CARB’s zero-emission TRU requirements and the EU F-Gas phase-down are accelerating the shift to electric refrigeration and low-GWP refrigerants.
What financing models help fleets afford electric trailers?
Subscription models such as Wabash National’s Trailers-as-a-Service convert upfront capex into monthly opex, easing the adoption of higher-cost electric units.
Page last updated on:


 Your data is secure and never sold or shared.


