
Recycled Carbon Fiber Market Size and Share
Market Overview
| Study Period | 2021 - 2031 |
|---|---|
| Market Size (2026) | USD 224.62 Million |
| Market Size (2031) | USD 427 Million |
| Growth Rate (2026 - 2031) | 13.71 % |
| Fastest Growing Market | Europe |
| Largest Market | North America |
| Market Concentration | Medium |
Major Players *Disclaimer: Major Players sorted in no particular order Image © Mordor Intelligence. Reuse requires attribution under CC BY 4.0. | |
Recycled Carbon Fiber Market Analysis by Mordor Intelligence
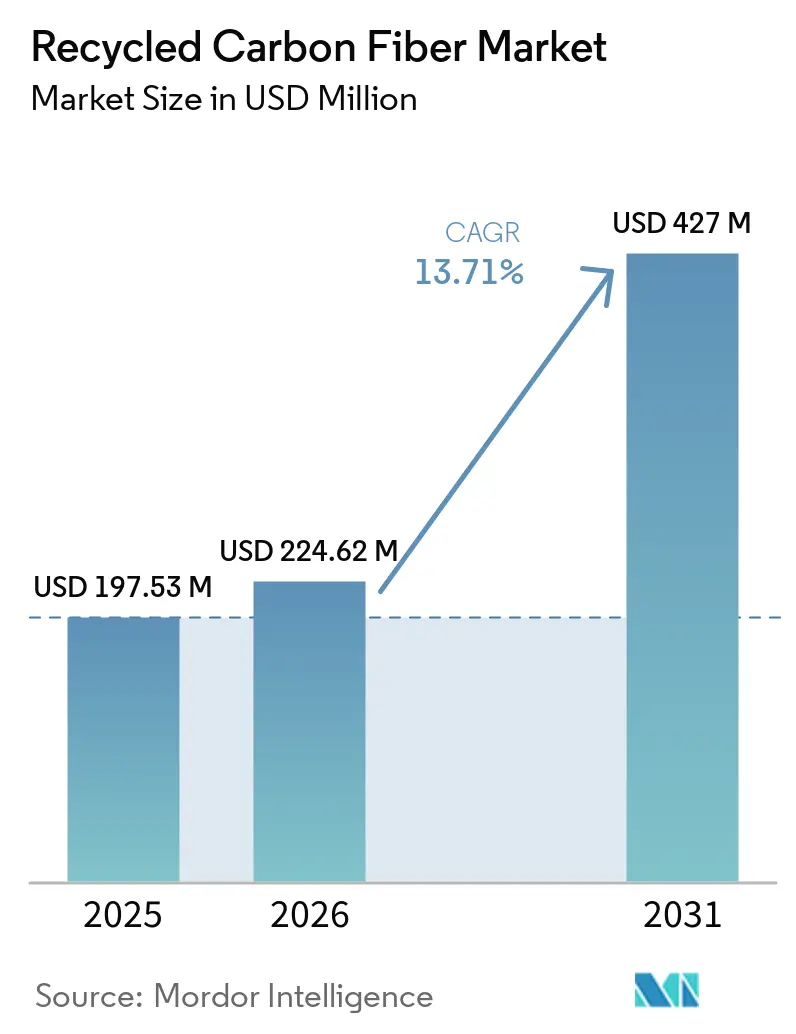
The Recycled Carbon Fiber Market size was valued at USD 197.53 million in 2025 and is estimated to grow from USD 224.62 million in 2026 to reach USD 427 million by 2031, at a CAGR of 13.71% during the forecast period (2026-2031). Demand is rising as aerospace and automotive manufacturers race to cut embodied carbon while safeguarding the stiffness-to-weight ratio that virgin fiber provides. Chopped grades dominate because they drop straight into injection and compression molding lines already qualified for glass fiber. At the same time, energy-positive pyrolysis plants are driving processing costs below USD 8 per kilogram and pushing recycled carbon fiber market adoption into high-volume platforms. Net-zero commitments, Extended Producer Responsibility rules, and decommissioned wind-turbine blades are converging to secure a predictable scrap supply that tempers price volatility and underpins multi-year offtake contracts with OEMs.
Key Report Takeaways
- By product type, chopped recycled carbon fiber led with 61.65% revenue share in 2025 and is forecast to expand at a 13.91% CAGR through 2031.
- By source, aerospace scrap captured 45.82% of the recycled carbon fiber market share in 2025, and the same segment is projected to grow at a 14.44% CAGR through 2031.
- By the recycling process, pyrolysis controlled 70.45% of the market in 2025, while solvolysis records the highest projected CAGR at 15.66% to 2031.
- By matrix, thermoset composites accounted for 67.29% of the recycled carbon fiber market size in 2025; thermoplastic composites are advancing at a 15.08% CAGR through 2031.
- By end-user industry, recycled carbon fiber market share was dominated by aerospace and defense dominated with at a 37.01% share in 2025; automotive is expected to post the fastest 14.82% CAGR to 2031.
- By region, the recycled carbon fiber market in North America held a 38.15% share in 2025; Europe is poised to expand at a 14.99% CAGR through 2031.
Note: Market size and forecast figures in this report are generated using Mordor Intelligence’s proprietary estimation framework, updated with the latest available data and insights as of January 2026.
Market Trends and Insights
Drivers Impact Analysis of Recycled Carbon Fiber Market*
| Driver | (~) % Impact on CAGR Forecast | Geographic Relevance | Impact Timeline |
|---|---|---|---|
| Circular-economy mandates in Europe and America | +2.8% | Europe (Germany, France, UK), North America (US, Canada) | Medium term (2-4 years) |
| OEM net-zero targets boosting rCF content in EVs | +3.2% | Global, with concentration in Europe and North America | Long term (≥ 4 years) |
| End-of-life wind-turbine blades creating high-grade scrap | +2.1% | Europe (Nordic countries, Germany, Spain), North America | Medium term (2-4 years) |
| Accelerating aircraft retirements in Asia-Pacific unlocking aerospace scrap | +2.5% | Asia-Pacific (China, Japan, South Korea), spill-over to North America | Short term (≤ 2 years) |
| Break-even cost parity as energy-positive pyrolysis plants scale | +3.1% | Global, early adoption in North America and Europe | Long term (≥ 4 years) |
| Source: Mordor Intelligence | |||
Circular-Economy Mandates in Europe and America
Extended Producer Responsibility directives are forcing composite producers to finance take-back schemes,. influencing the recycled carbon fiber market. The EU Waste Framework Directive, revised in 2024, requires a 30% recycling rate for carbon-fiber composites by 2030, and Germany’s VerpackG collects a EUR 120 per-ton levy on non-compliant products. In the United States, California Senate Bill 54 compels manufacturers to close the loop on 25% of carbon-fiber content by 2028. These measures raise landfill tipping fees to EUR 95 per ton in Western Europe, tilting the cost equation in favor of certified recyclers. As a result, processors report a 40% jump in long-term scrap-supply contracts since Q4 2025[1].
OEM Net-Zero Targets Boosting rCF Content in EVs
Automakers are embedding recycled carbon fiber into battery enclosures and body-in-white parts to hit Scope 3 goals., supporting the growth of the recycled carbon fiber market. BMW’s iX uses 15% recycled carbon fiber, trimming embodied carbon by 2.3 kg CO₂-eq per vehicle, while Mercedes-Benz plans 40% recycled composite across EQ models by 2030. Tesla’s Berlin plant started underbody shield trials with chopped recycled carbon fiber sourced from a local pyrolysis operator that processes aerospace scrap. Recycled grades command USD 18 per kilogram, a 35% discount to virgin tow, making them cost-competitive with aluminum extrusions when tooling consolidation is factored in[2].
End-of-Life Wind-Turbine Blades Creating High-Grade Scrap
Europe’s first-generation onshore turbines are entering decommissioning, yielding 45,000 t of blade waste annually through 2026. Vestas and Siemens Gamesa teamed with ReFiber to open a 12,000 t solvolysis plant in Denmark, achieving 90% fiber yield and lengths suited to automotive compression molding. Germany earmarked EUR 50 million in 2025 for regional dismantling hubs, lowering transport costs for remote turbines., supporting the recycled carbon fiber market. Blade skins use unidirectional carbon plies, so post-pyrolysis fiber retains more than 85% of virgin tensile strength, attracting compounders that supply structural brackets to European EV platforms.
Accelerating Aircraft Retirements in Asia-Pacific Unlocking Aerospace Scrap
Asia-Pacific airlines retired over 320 wide-body jets in 2025, releasing high-modulus scrap into the recycling chain for the recycled carbon fiber market. China’s aviation regulator now requires that 50% of composite waste flow to certified recyclers by 2027, guaranteeing feedstock volumes. Mitsubishi Chemical raised capacity at Toyohashi to process 1,800 t of fuselage scrap annually, supplying sporting goods and auto customers that prize 250 GPa modulus fibers. South Korea’s Korean Air joint venture dismantles 777 airframes and exports chopped fiber to US compounders, capturing a USD 12 per-kg margin over landfill.
Restraints Impact Analysis of Recycled Carbon Fiber Market*
| Restraint | (~) % Impact on CAGR Forecast | Geographic Relevance | Impact Timeline |
|---|---|---|---|
| Availability of substitute lightweight materials (Al, Mg, GF) | -1.9% | Global, with higher impact in cost-sensitive automotive segments | Medium term (2-4 years) |
| Fragmented scrap-collection logistics | -1.4% | North America, Europe, emerging in Asia-Pacific | Short term (≤ 2 years) |
| Variable fiber-length distribution impacting quality control | -1.2% | Global, particularly affecting automotive and sporting goods | Long term (≥ 4 years) |
| Source: Mordor Intelligence | |||
Availability of Substitute Lightweight Materials
Aluminum, magnesium, and glass fiber still undercut recycled carbon fiber on price in cost-sensitive automotive programs. Aluminum 6000-series extrusions stood at USD 4.20 per kilogram in 2025, roughly one-fifth of recycled carbon fiber. Magnesium die-castings grew 18% in North America last year, filling EV battery-enclosure orders once earmarked for composites. Glass-fiber sheet-molding compounds at USD 2.80 per kilogram satisfy crash-energy needs in non-structural panels, limiting recycled carbon fiber market penetration to parts where its 40% density advantage offsets the premium. The substitution threat is magnified in Asia, where lifecycle-carbon metrics carry less weight in sourcing decisions.
Fragmented Scrap-Collection Logistics
Lack of standardized collection networks inflates transport costs and introduces contamination that devalues scrap. A 2025 industry survey found 60% of European carbon-fiber off-cuts still enter municipal waste streams, with average haul distances topping 450 km. North American aerospace scrap often travels over 1,200 km to reach Midwest pyrolysis plants, adding USD 50 per ton in freight and eroding recycled carbon fiber market economics. Small sporting goods makers generate sub-50 t volumes that are too costly to consolidate, steering material to landfills. Asia-Pacific faces similar issues as airframe teardowns outpace collection infrastructure, driving 25% rejection rates at recyclers.
*Our forecasts treat driver/restraint impacts as directional, not additive. The impact forecasts reflect baseline growth, mix effects, and variable interactions.
Recycled Carbon Fiber Market Segment Analysis
By Product Type:
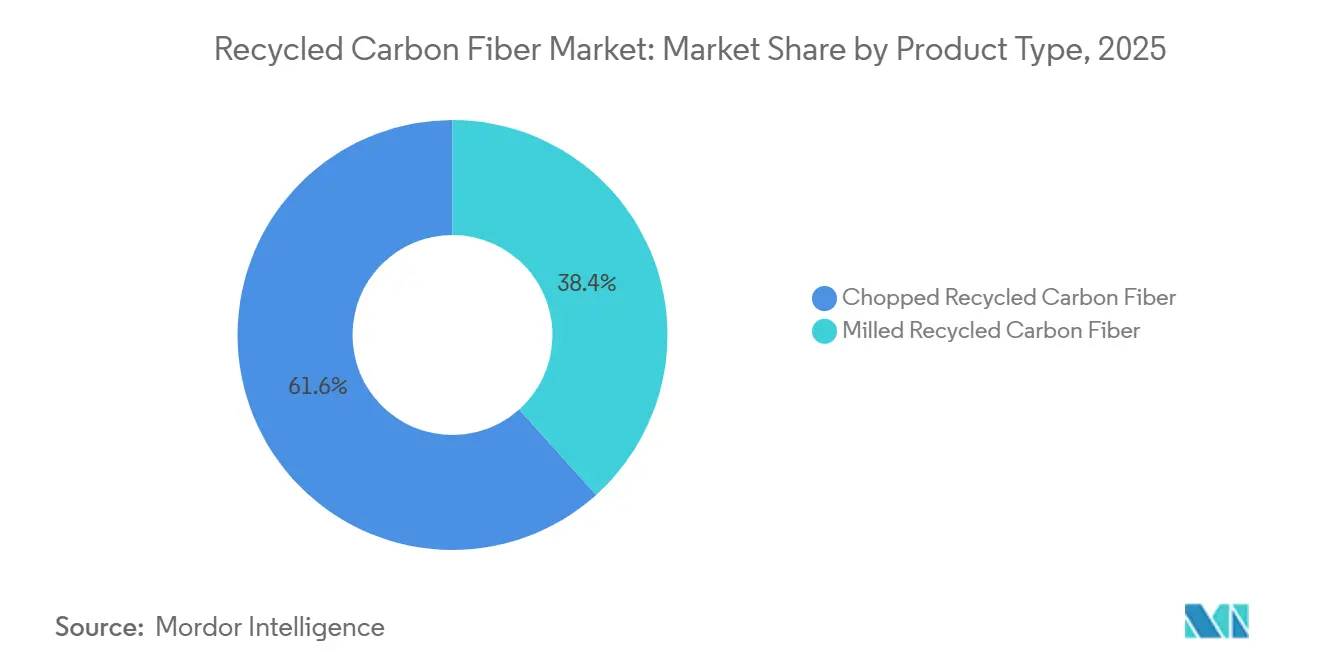
Chopped Grades Sustain Lead While Milled Grades Nudge UpChopped fiber commanded 61.65% of the recycled carbon fiber market share in 2025 and is projected to climb at a 13.91% CAGR, reinforcing its status as the go-to reinforcement for injection and compression molding. Most pyrolysis lines naturally produce 3–12 mm fibers that flow easily in thermoplastic compounds, allowing automotive tier-ones such as Magna to cut 15–20% weight versus glass fiber parts without retooling.
Milled fiber remains a niche, feeding coatings, adhesives, and 3D-printing filaments that value uniform dispersion over tensile performance. Growth depends on additive-manufacturing demand and on solvolysis breakthroughs that can deliver longer fibers suitable for semi-structural parts. If 15–25 mm retention scales, chopped fiber may face stiffer competition, particularly in battery-enclosure ribs where designers seek higher modulus without continuous-fiber lay-up.
By Source:
Aerospace Scrap Maintains Quality PremiumAerospace scrap delivered 45.82% of feedstock and will grow at a 14.44% CAGR through 2031, buoyed by Asia-Pacific fleet retirements and steady trimming waste from Boeing’s 787 and Airbus A350 lines. Aerospace prepregs carry resin contents below 35%, which raises fiber yield above 92% after pyrolysis and justifies a 25–30% price premium.
Automotive and wind-energy scrap offer higher tonnage but lower purity, saddling recyclers with pre-processing to strip contaminants. Blade waste will rise sharply as European turbines reach end-of-life, creating volume but challenging small operators that lack high-temperature pyrolysis or solvolysis lines. Sporting goods scrap is dispersed and small-batch, though brand take-back programs initiated in 2025 could improve aggregation for the recycled carbon fiber market over the forecast period.
By Recycling Process:
Pyrolysis Dominates, Solvolysis Gains MomentumPyrolysis held a 70.45% share in 2025, thanks to its versatility with thermoset scrap and its maturing cost profile. Gen 2 Carbon’s Lake City plant runs at 14.2 MWh per ton, recovering 90% fiber yield and supplying automotive customers at USD 7.20 per kilogram.
Solvolysis, though smaller, will outpace with a 15.66% CAGR as operators like Mitsubishi Chemical prove 50 mm fiber-length retention and 95% tensile-strength preservation using lower-temperature solvent systems. Mechanical shredding keeps a foothold in conductive fillers and bulk-molding compounds but will cede share as customers demand higher structural performance at marginally higher price points.
By Matrix Compatibility:
Thermoset Share Mirrors Installed BaseThermoset composites accounted for 67.29% of the recycled carbon fiber market size in 2025, reflecting the epoxy dominance in aerospace and wind applications. Pyrolysis easily strips cured resin, yet re-impregnation adds a compounding step that raises total part cost, limiting uptake in price-sensitive brackets.
Thermoplastic demand will rise at a 15.08% CAGR as EV makers exploit the re-melt capability that enables genuine closed-loop recycling. BMW demonstrated that polyamide-6 battery enclosures granulated at end-of-life can be injection-molded into new parts without property loss, smoothing the path to mass-volume adoption and broadening recycled carbon fiber market appeal beyond niche programs.
By End-User Industry:
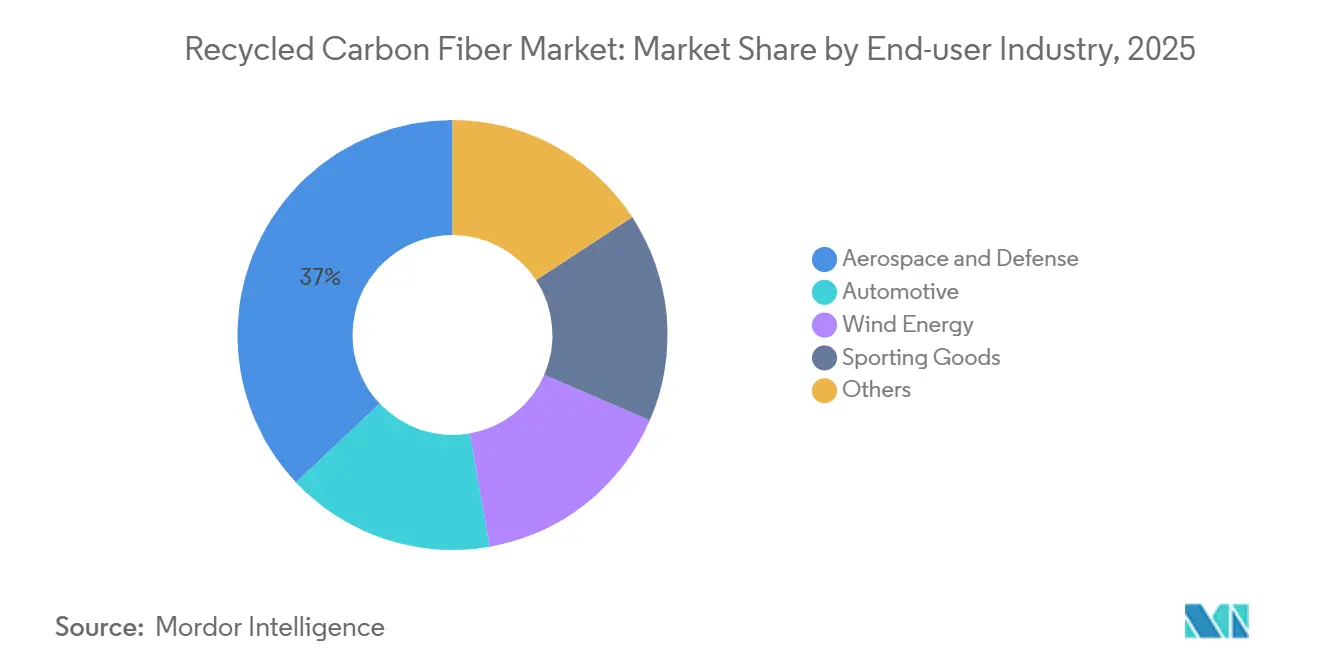
Automotive Emerges as Growth EngineAerospace and defense retained 37.01% of 2025 revenue by leveraging recycled carbon fiber in cabin interiors, cargo liners, and non-primary structures cleared by regulators in 2024. , supporting the recycled carbon fiber market. Certification cycles and long aircraft lifespans temper rapid volume shifts, but maintenance, repair, and overhaul scrap keeps supply predictable.
Automotive will grow at a 14.82% CAGR through 2031 as EV platforms chase every kilogram saved to extend range. Mercedes-Benz’s EQS sedan integrates recycled carbon fiber in its front-end carrier, cutting 8 kg and 18 kg CO₂-eq per unit. Sporting goods and consumer electronics remain small but steady, tapping recycled fiber for environmental branding and modest weight reduction.

Geography Analysis
North America Recycled Carbon Fiber Market
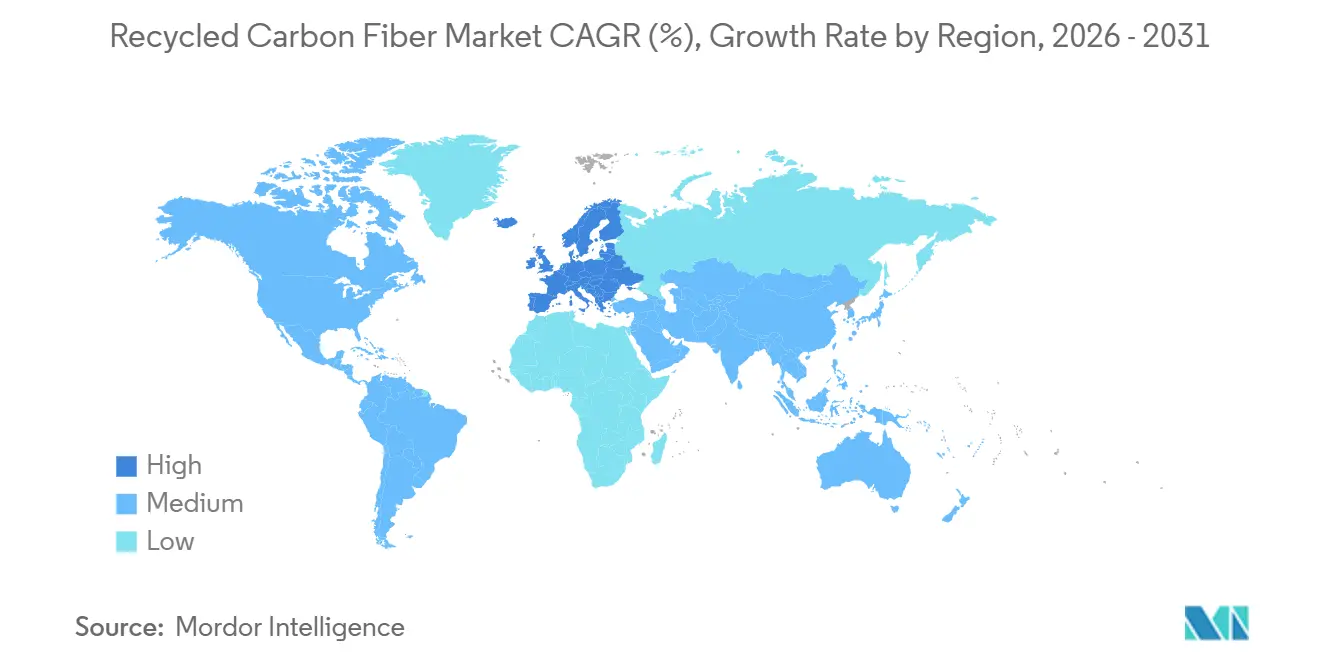
North America led the recycled carbon fiber market with 38.15% revenue in 2025, underpinned by aerospace hubs that feed high-grade scrap and federal tax credits that subsidize new recycling capacity. Boeing diverted 68% of its composite waste to recyclers, and the US Department of Energy granted USD 85 million to co-fund pyrolysis and solvolysis projects, accelerating the transition away from mechanical shredding. Canada’s tier-one suppliers started molding recycled carbon fiber battery trays, while Mexico’s aerospace cluster funnels production off-cuts into US furnaces.
Europe Recycled Carbon Fiber Market
Europe is on track for a 14.99% CAGR as Extended Producer Responsibility rules bite and blade decommissioning accelerates. Germany expanded pyrolysis capacity to 18,000 t per year, France forged closed-loop supply chains for EV parts, and the UK demonstrated solvolysis fiber suitable for Airbus cabin partitions. Nordic nations monetize blade waste by exporting chopped fiber to Italian and German compounders, while Spain scales sporting-goods recycling around bicycle hubs.
APAC Recycled Carbon Fiber Market
Asia-Pacific sits at the nexus of scrap generation and demand. China’s draft standards for recycled carbon fiber in rail and auto parts, Japan’s 35% capacity hike, and South Korea’s qualification of recycled grades for the Ioniq 6 underpin regional momentum in the recycled carbon fiber market. However, fragmented collection and limited processing capacity in Southeast Asia and India delay full-scale deployment, creating white-space for new entrants that can aggregate scrap across borders.
Value Chain Analysis
The recycled carbon fiber (rCF) value chain begins with feedstock generation and capture from aerospace manufacturing and MRO, automotive composite trimming scrap, and wind-energy blade and spar waste, then moves through sorting, decontamination, and logistics consolidation. Recyclers process CFRP via thermal routes (pyrolysis, the dominant industrial pathway) or chemical routes (solvolysis), followed by fiber cleaning, sizing and surface treatment, and conversion into saleable intermediates such as chopped fiber, nonwovens and mats, pellets, and engineered bundles for compounding.
Downstream, compounders and resin suppliers blend rCF into thermoplastic and thermoset formulations, and tier suppliers and OEMs convert these materials through injection molding, compression molding, and sheet molding for automotive, aerospace interiors and secondary structures, sporting goods, and other applications. Closed-loop programs increasingly link material suppliers and recyclers with waste owners, including Syensqo collaborations with Vartega (North America) and its recycling contract with Fairmat (UK) to convert prepreg waste into engineered materials. Italy-based Herambiente and Angeloni Group have also pursued closed-loop approaches using Imola infrastructure, though key constraints still include property variability, soot and interfacial-bonding impacts from thermal processing, and the cost and availability of standardized qualification for higher-criticality parts.
Competitive Landscape
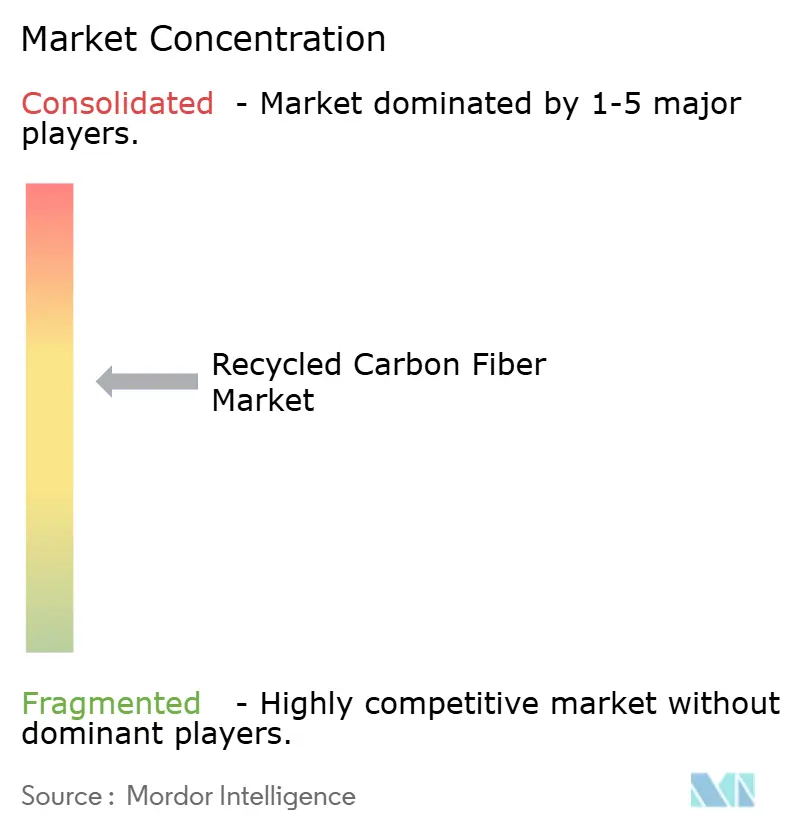
The Recycled Carbon Fiber market shows moderate concentration. Technology leadership is tightening competitive gaps. Vartega’s energy-positive plant sells 1.8 MWh surplus electricity per ton into Colorado’s grid, while Carbon Fiber Remanufacturing filed a two-stage pyrolysis patent that restores surface energy via plasma treatment, chasing tensile properties near virgin T700. White-space persists in thermoplastic-composite recycling and additive manufacturing. Start-ups are developing bio-based resins that simplify end-of-life separation, and digital platforms are emerging to coordinate scrap pickups, lowering rejection rates.
Recycled Carbon Fiber Industry Leaders
-
Carbon Conversions
-
Gen 2 Carbon Limited
-
TORAY INDUSTRIES, INC.
-
Mitsubishi Chemical Group Corporation
-
SGL Carbon
- *Disclaimer: Major Players sorted in no particular order
Recycled Carbon Fiber Market Companies Covered in this Report
- Alpha Recyclage Composites
- Carbon Conversions
- Carbon Fiber Recycling
- Carbon Fiber Remanufacturing
- Carbon Nexus
- ELG Carbon Fibre Ltd.
- Gen 2 Carbon Limited
- Hexcel Corporation
- Mitsubishi Chemical Group Corporation
- Procotex
- RECARBON
- ReFiber ApS
- SGL Carbon
- Shockercomposites
- Sigmatex
- TEIJIN LIMITED
- TORAY INDUSTRIES, INC.
- Vartega Inc.
Market Opportunities and Future Outlook
Near-term whitespace centers on scaling regionally balanced collection and processing, so that aerospace-grade and industrial prepreg waste can be converted into consistent, qualified intermediate forms (bundles, pellets, nonwovens) that compounders can run on established molding lines. Recent announcements point to where supply is building, including Apply Carbon’s mass recycled carbon fiber production in Plouay, France, and Nandina REM’s commercially scaled carbon fiber production facility in Singapore in February 2026, which strengthens Southeast Asia’s role in carbon fiber production.
The technology-led opportunity is to move rCF beyond discontinuous chopped formats into higher-value reinforcements and more closed-loop aerospace pathways. Japan NEDO launched a May 2026 R&D initiative focused on a closed-loop CFRP recycling supply chain from retired aircraft to new aircraft by 2030, bringing recyclers, dismantlers, and materials qualification stakeholders together around flight-relevant scrap streams. Product and alliance activity is also extending addressable end markets, with Teijin Carbon expanding its Tenax Next product line in March 2026 using circular carbon fibers from manufacturing residues for industrial uses, and a March 2026 MoU between Catack-H and Posco International indicating broader commercialization interest in exportable rCF technologies.
Recent Industry Developments in Recycled Carbon Fiber Market
- March 2026: Carbon Fiber Conversions announced a strategic partnership with Barnet to expand the global market for recycled carbon fiber in plastics, promoting the CarboFlow product line. This collaboration addresses fragmented buying channels and can speed adoption among compounders and plastics converters that require reliable supply and technical support.
- February 2026: Nandina REM opened a commercially scaled carbon fiber production facility in Singapore, strengthening Southeast Asia as a hub for carbon fiber production. The move accelerates local processing options for regional aircraft and composite waste streams and reduces dependence on long-haul shipment to North America or Europe for reclamation and remanufacturing.
- May 2025: Gen 2 Carbon placed an order for a full-scale carbon fiber recovery furnace for its UK factory designed to process at least 1,600 tonnes of CFRP waste annually and yield around 1,000 tonnes of recycled carbon fiber. This investment signals industrial scale-up of recovery capacity and supports longer-term supply commitments for automotive and other high-volume applications.
Recycled Carbon Fiber Market Report Scope and Research Methodology
Market Definition and Coverage
We define the recycled carbon fiber market as the value of carbon fiber recovered from waste streams, processed into usable fiber forms, and sold for making new parts and products across industries.
Scope exclusions: This sizing excludes carbon black style additives, fibers only recovered as furnace residue, and simple reuse of uncured prepreg scrap without a recycling conversion step.
Segments Covered in This Report
- By Product Type
- Chopped Recycled Carbon Fiber
- Milled Recycled Carbon Fiber
- By Source
- Aerospace Scrap
- Automotive Scrap
- Other Sources
- By Recycling Process
- Pyrolysis
- Solvolysis / Chemical Recycling
- Mechanical Shredding and Milling
- By Matrix Compatibility
- Thermoset Composites
- Thermoplastic Composites
- By End-user Industry
- Automotive
- Aerospace and Defense
- Wind Energy
- Sporting Goods
- Others
- By Geography
- Asia
- China
- Japan
- India
- South Korea
- Southeast Asia
- Rest of Asia
- North America
- United States
- Canada
- Mexico
- Europe
- Germany
- United Kingdom
- France
- Italy
- Spain
- Nordic Countries
- Rest of Europe
- South America
- Brazil
- Argentina
- Rest of South America
- Middle-East and Africa
- Saudi Arabia
- United Arab Emirates
- South Africa
- Rest of Middle-East and Africa
- Asia
Data Sources, Market Sizing, and Validation
Desk Research
Desk work was used to set practical boundaries and build the first input sheet for supply, demand, and price assumptions. We referred to public and official sources such as the USGS for materials context, the US International Trade Commission data portal for trade codes that touch carbon and composite goods, the European Commission publications on waste and circular economy rules, and ISO and ASTM pages for terminology and test standards that influence what can be sold as recycled fiber.
To turn that foundation into a usable market model, we also reviewed annual reports and investor presentations of carbon fiber and composites participants, along with association sites and reputable technical press that tracks recycling capacity additions and new qualification wins. In parallel, paid subscriptions for company financials and news intelligence were used to cross-check revenue exposure, plant announcements, and timing of expansions, and a patent database was used to identify where process intensity is shifting. These desk research sources are illustrative and not exhaustive, and many additional sources were used for data collection, validation, and clarification.
Primary Interviews and Surveys
Primary interviews and surveys were run with recyclers, compounders, converters, and procurement and engineering stakeholders in end-use sectors, so the demand pool could be matched to what is actually qualified and purchased. We also spoke with logistics and channel participants to understand yield loss, typical pricing by fiber form, and the time lag between a trial and full-scale buying, which are then used to adjust desk assumptions across regions.
Distribution of primary research fieldwork respondents
| Company type | Respondent position | Region |
|---|---|---|
| Top tier: 34% | CXOs: 18% | APAC: 49% |
| Mid tier: 48% | Functional/Unit leaders: 25% | EMEA: 31% |
| Smaller Players: 18% | Managers: 57% | Americas: 20% |
Market-Sizing & Forecasting
The market was sized using a top-down approach once, where recycled fiber volumes are rebuilt from recycling capacity, typical operating rates, and process yield, and then translated into value using fiber form mix and average selling price assumptions. To keep the totals grounded, selective bottom-up approximations were used as a check, including sampled supplier revenues, channel checks for major application groups, and spot calculations of (tons consumed) x (typical $/kg) for a few high-use end markets.
Inputs that matter for this market were kept simple and traceable. Key examples include available recycling capacity by process route, average recovery yield from aerospace and industrial scrap, the split between chopped, milled, and mat formats, qualification and adoption cycles in automotive and aerospace, and the spread between recycled and virgin carbon fiber pricing (which affects substitution). Where a gap exists in company disclosures, missing points were handled through range-based assumptions that were narrowed using primary feedback, before being applied consistently across regions.
For forecasting, we relied on scenario analysis anchored to capacity additions and demand adoption timing, then stress-tested the path using trend smoothing on historical growth signals. Final year-by-year outputs were adjusted only when the implied utilization or price curve became inconsistent with what interviewees described as feasible in typical contracting cycles.
Data Validation & Update Cycle
Model outputs were checked against independent signals such as announced plant capacities, composite production cues, and trade and regulatory developments that can shift scrap availability. When a variance was found, the driver was isolated (volume, utilization, mix, or price), then reviewed through an internal analyst pass before sign-off.
Reports are refreshed annually, with interim updates triggered when material events occur, such as a major capacity start-up, a process shutdown, or a sudden change in demand from a key end-use segment. Before delivery, we run a final data pass so the published view reflects the most recent public updates and validated interview learnings.
Mordor Intelligence's Recycled Carbon Fiber Market Size Versus Other Published Estimates
Published numbers for recycled carbon fiber often do not align because the product boundary is easy to stretch, and not everyone treats scrap reuse, recycled intermediates, and end-use conversion value in the same way. Differences also show up in how pricing is built (spot quotes versus contract ranges), plus the year used as the starting point for growth.
The table points to a spread that is mainly explained by what is counted as recycled fiber sales and what is left out, and then by how quickly price and utilization are allowed to move in early years. In Mordor Intelligence's model, the 2025 value focuses on recycled carbon fiber that is processed into saleable forms and sold into end-use supply chains, while excluding carbon black style additives and simple reuse of uncured prepreg scrap, which some publications appear to fold into a broader circular composites number.
Benchmark comparison
| Source | Market Size | Gaps in Research Methodology |
|---|---|---|
| Mordor Intelligence | USD 197.53 M (2025) | |
| Global Consultancy A | USD 177.60 M (2025) | Uses a narrower demand capture that leans more on disclosed consumption and may undercount smaller recycling routes and non-aerospace scrap streams, which can reduce the implied 2025 total. |
| Industry Publication B | USD 202.16 M (2025) | Applies a wider product framing that can include adjacent recycled composite intermediates and more aggressive early-year ASP progression, which can lift the 2025 value even if physical fiber volumes are similar. |
Across the three figures, the direction of the gap tracks back to scope and price logic more than to any single data point. By keeping the market tied to identifiable recycled fiber sales, and then checking utilization and pricing against real operating feedback, the estimate stays easier to reproduce and update as new capacity and qualification milestones occur.
Key Questions Answered in the Report
What is current market size of Recycled Carbon Fiber Market?
The Recycled Carbon Fiber Market size was valued at USD 197.53 million in 2025 and is estimated to grow from USD 224.62 million in 2026 to reach USD 427 million by 2031, at a CAGR of 13.71% during the forecast period (2026-2031).
Which region led the recycled carbon fiber market in 2025?
North America led the recycled carbon fiber market in 2025, accounting for 38.15% of total revenue.
How is the aerospace industry contributing to the global recycled carbon fiber market?
Aerospace manufacturing generates significant volumes of high-grade carbon fiber scrap and production off-cuts, providing an important feedstock for recycling and supporting the expansion of the global recycled carbon fiber market.
What role do advanced recycling technologies play in the global market?
Advanced technologies such as pyrolysis and solvolysis are accelerating the transition from conventional mechanical shredding by enabling the recovery of higher-quality recycled carbon fibers.