
Recovered Carbon Black Market Size and Share
Market Overview
| Study Period | 2021 - 2031 |
|---|---|
| Market Volume (2026) | 138.21 kilotons |
| Market Volume (2031) | 363.70 kilotons |
| Growth Rate (2026 - 2031) | 21.35 % |
| Fastest Growing Market | North America |
| Largest Market | Europe |
| Market Concentration | Medium |
Major Players *Disclaimer: Major Players sorted in no particular order Image © Mordor Intelligence. Reuse requires attribution under CC BY 4.0. | |
Recovered Carbon Black Market Analysis by Mordor Intelligence
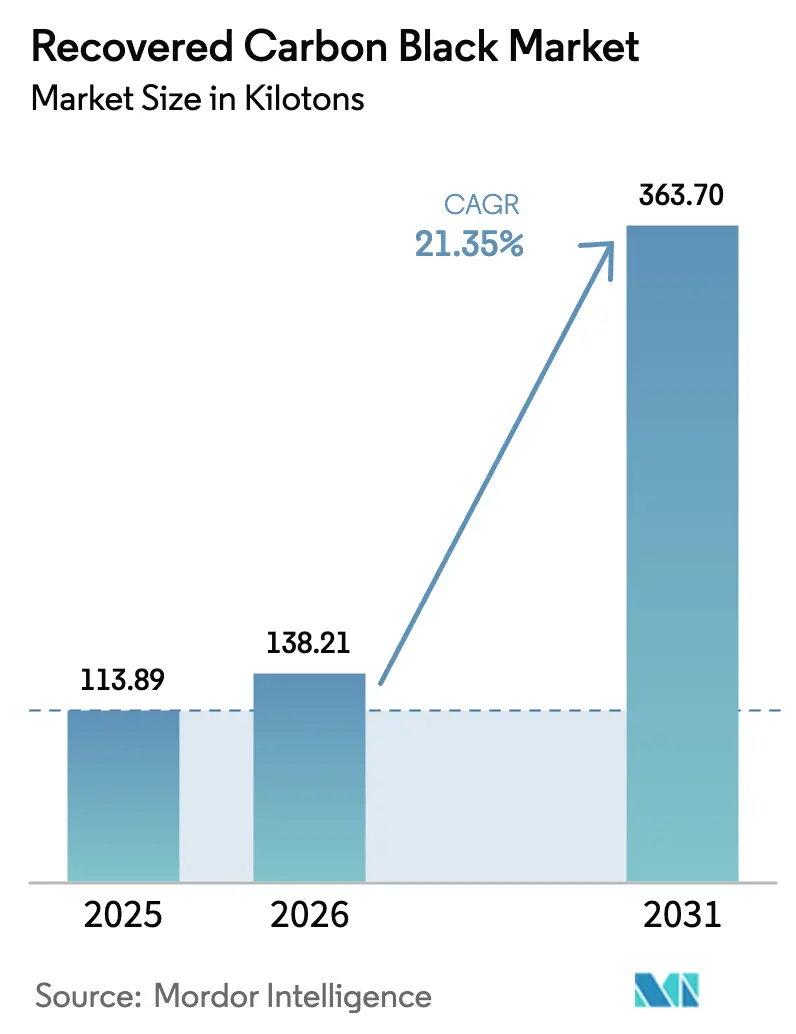
The Recovered Carbon Black Market size is expected to grow from 113.89 kilotons in 2025 to 138.21 kilotons in 2026 and is forecast to reach 363.70 kilotons by 2031 at 21.35% CAGR over 2026-2031. Strong regulatory pressure, OEM sustainability targets, and widening cost differentials with virgin carbon black are accelerating capacity commitments across Europe, North America, and Asia-Pacific. Pyrolysis technology—now the dominant pathway—remains supply-constrained even as new joint-venture plants come online, while specialty grades aimed at 5G and electric-vehicle applications open margin-rich opportunities for operators with advanced post-treatment. Europe retains the largest production and consumption base, yet North America is on track to log the fastest volumetric expansion once its 2026–2027 projects reach steady state. Competitive intensity is sharpening as traditional carbon-black producers take equity stakes in pyrolysis firms to hedge virgin feedstock risk and secure secondary-material streams.
Key Report Takeaways
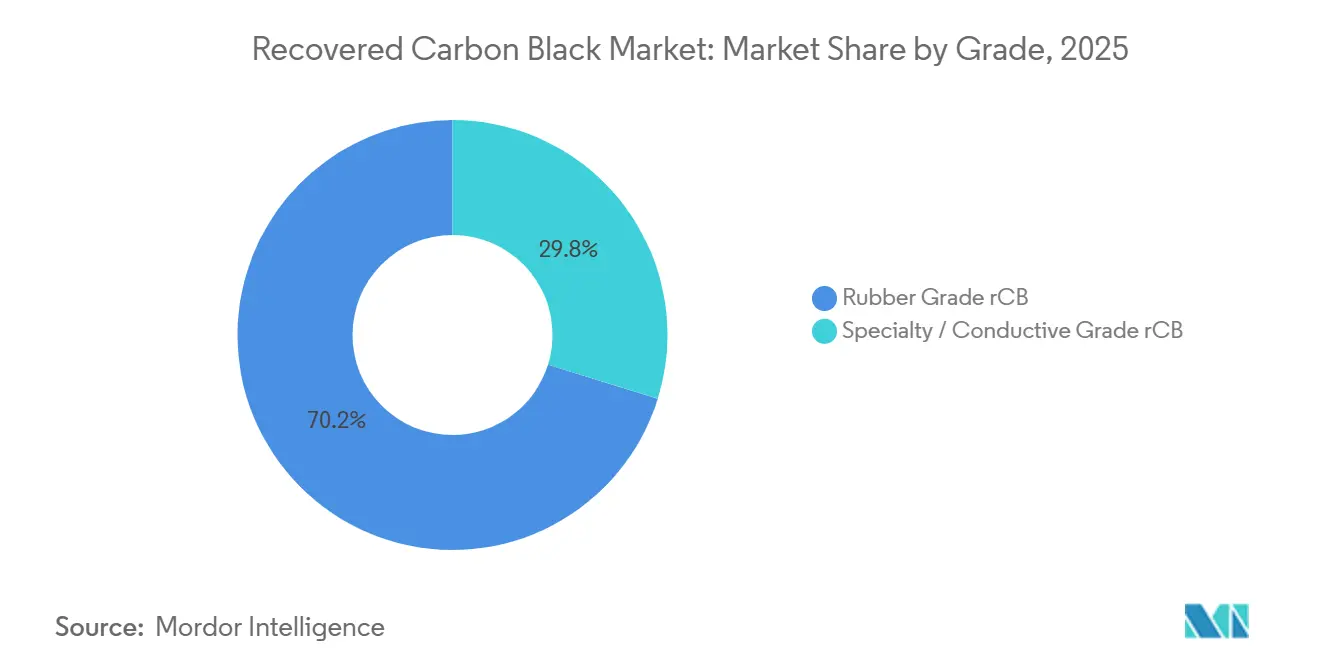
- By grade, rubber-grade rCB captured 70.21% volume in 2025, while specialty/conductive rCB is forecast to expand at 22.89% CAGR through 2031.
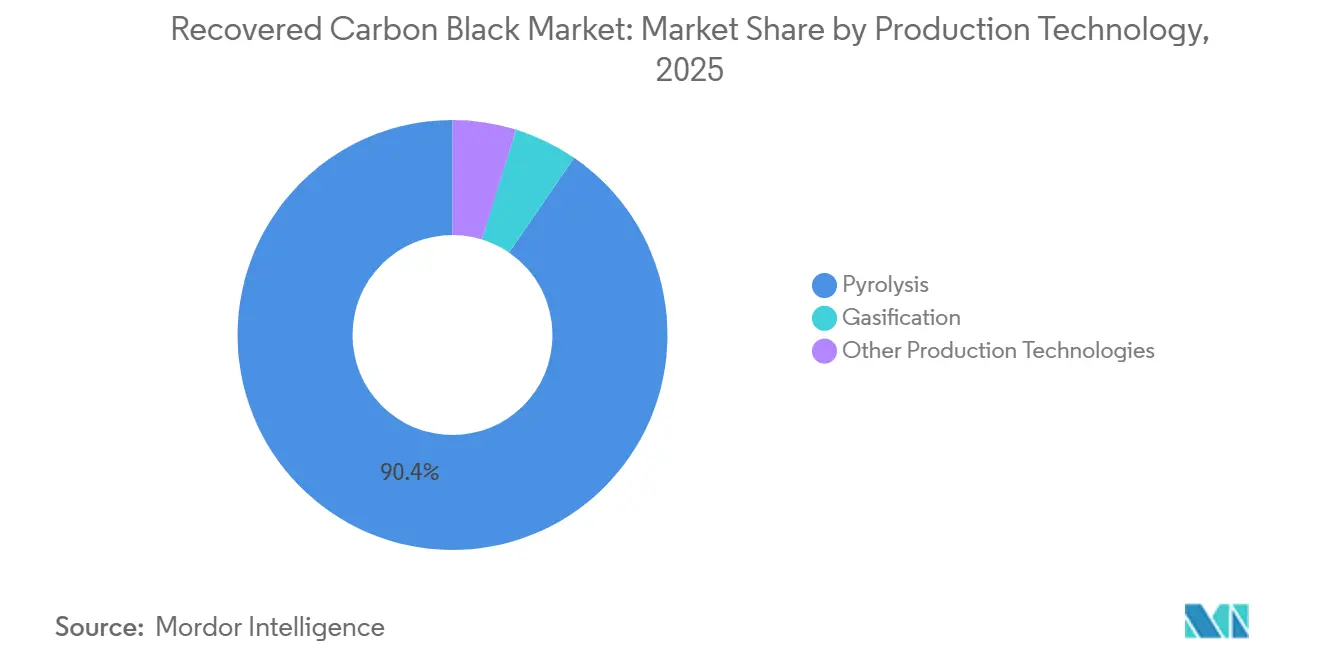
- By production technology, pyrolysis controlled 90.45% output in 2025 and is set to grow at 22.93% CAGR, underscoring that capacity rather than demand remains the binding constraint.
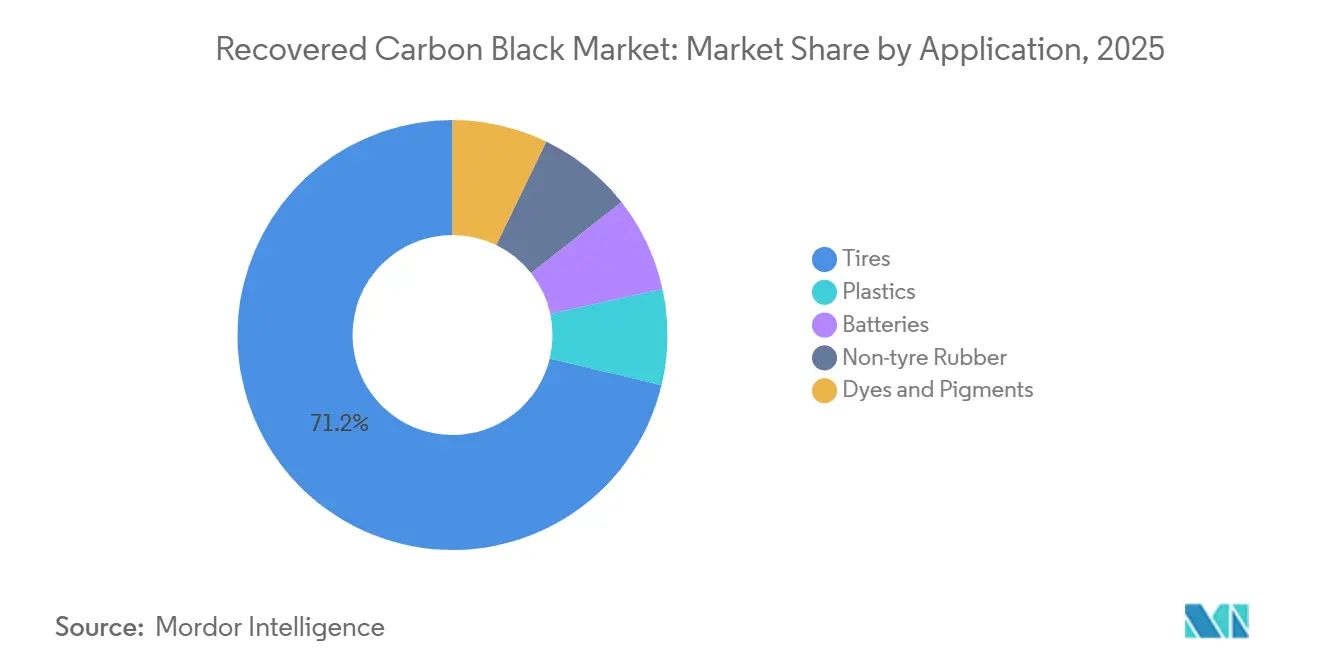
- By application, tires held 71.23% share in 2025 and is forecast to expand at 21.97% CAGR through 2031.
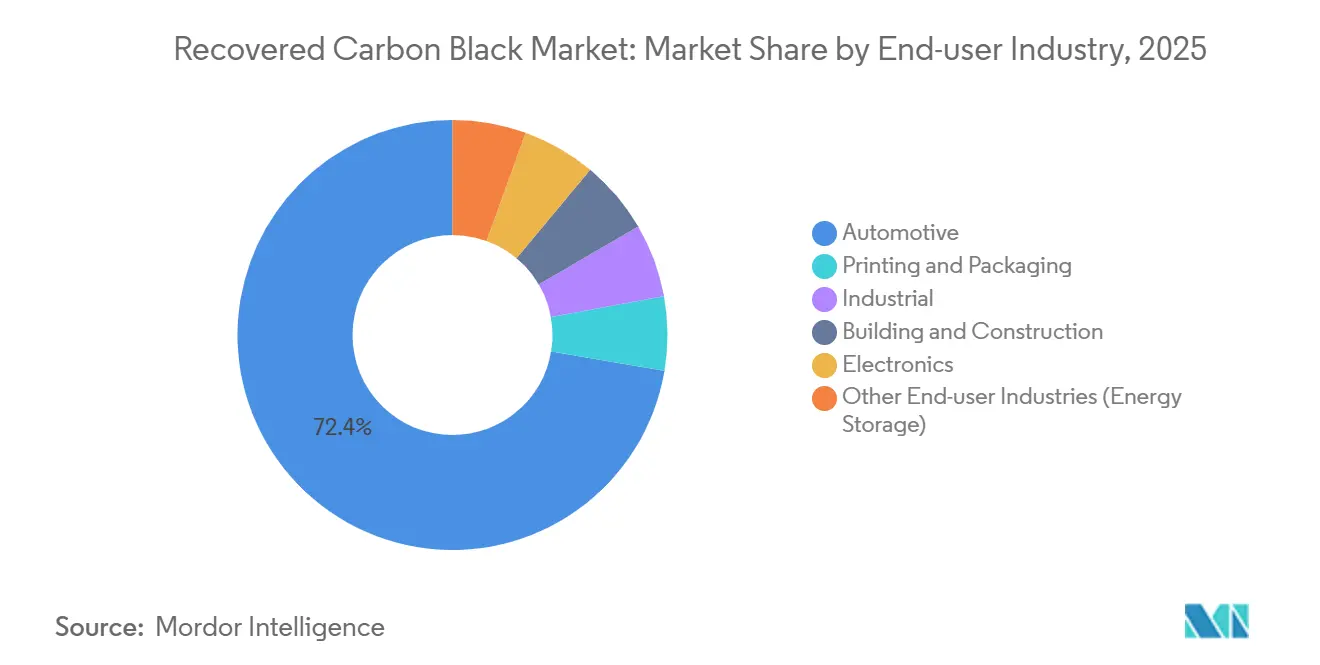
- By end-user industry, automotive commanded 72.35% share in 2025, whereas industrial is projected to climb at 22.07% CAGR to 2031.
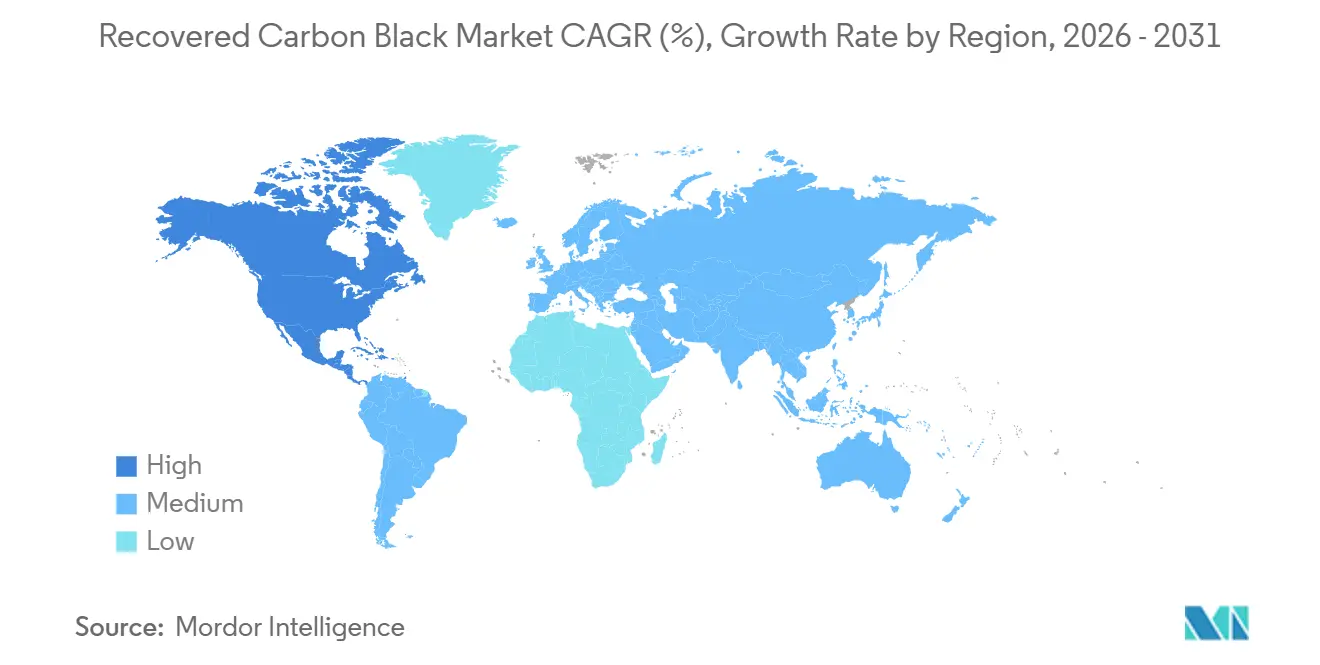
- By geography, Europe accounted for 51.24% in 2025, while North America is expected to pace the field at 21.89% CAGR through 2031.
Note: Market size and forecast figures in this report are generated using Mordor Intelligence’s proprietary estimation framework, updated with the latest available data and insights as of January 2026.
Market Trends and Insights
Drivers Impact Analysis of Recovered Carbon Black Market*
| Driver | (~) % Impact on CAGR Forecast | Geographic Relevance | Impact Timeline |
|---|---|---|---|
| Environmental Sustainability and Circular-Economy Mandates | +5.2% | Global, with EU and India leading implementation | Medium term (2-4 years) |
| OEM Target of ≥40% Sustainable Materials in Tires By 2030 | +6.8% | Global, concentrated in Europe and North America | Short term (≤ 2 years) |
| Cost Advantage Versus Virgin Carbon Black | +4.1% | Asia-Pacific, Middle East, price-sensitive markets | Short term (≤ 2 years) |
| EU Carbon Border Adjustment Mechanism (CBAM) Incentives | +3.7% | Europe, spillover to North America and ASEAN | Medium term (2-4 years) |
| rCB Use in Conductive Polymer Composites for 5G and EV EMI Shielding | +2.9% | North America, Europe, East Asia (China, Japan, South Korea) | Long term (≥ 4 years) |
| Source: Mordor Intelligence | |||
Environmental Sustainability and Circular-Economy Mandates
Mandatory tire-collection rules and carbon-pricing schemes are moving from voluntary to enforceable. India raised its Extended Producer Responsibility (EPR) target to 100% collection from FY 2024-25 and recognized recovered carbon black for tire manufacturing, establishing a closed-loop incentive. The EU’s product carbon-storage regulation (Regulation 2024/3012) obliges ≥35-year monitoring, rewarding pyrolysis operators with ISO 59014 traceability over virgin suppliers. China’s national carbon market, effective May 2024, penalizes high-emission feedstocks, pushing local compounders toward low-carbon fillers. These measures enable tread formulations to replace up to 60% of virgin carbon black without breaching ASTM D8474 benchmarks. The convergence of EPR, carbon fees, and product-level certification gives the recovered carbon black market a structural compliance advantage.
OEM Target of ≥40% Sustainable Materials in Tires by 2030
Tier-one tire makers are locking in multi-year offtake to de-risk pyrolysis financing. Michelin’s 40% sustainable-materials goal underpins its co-investment in Scandinavian Enviro’s Uddevalla plant, pre-selling 10 kt of annual output before commissioning. Nokian and Pirelli have adopted similar agreements, while Bridgestone and Tokai Carbon formed a dedicated venture in January 2025. These binding contracts absorb merchant-market liquidity and convert the recovered carbon black market into a strategic supply chain, not a spot commodity.
Cost Advantage Versus Virgin Carbon Black
When crude oil prices exceed USD 80 per barrel, a notable price gap emerges between virgin and recycled carbon black, with the former commanding a significant premium. In May 2025, in the U.S., virgin carbon black was priced higher, while regional recycled carbon black (rCB) was comparatively lower. Battery-grade rCB traded at a fraction of the cost of top-tier virgin additives. Furthermore, purified rCB, containing less than 5% ash, commands a premium in coatings and inks, underscoring that it's the quality control, rather than the feedstock, that dictates value capture.
EU Carbon Border Adjustment Mechanism (CBAM) Incentives
CBAM reporting began in 2023 and tariff collection starts 2026, effectively raising the landed cost of virgin carbon black by 10%–15% for exporters without an equivalent carbon price[1]. India is racing to operationalize a domestic carbon-credit scheme to protect a trade line that grew 20% CAGR between 2017 and 2024. ISCC-certified rCB from plants such as Enviro’s Uddevalla qualifies for exemption, providing an embedded cost edge for European tire makers.
Restraints Impact Analysis of Recovered Carbon Black Market*
| Restraint | (~) % Impact on CAGR Forecast | Geographic Relevance | Impact Timeline |
|---|---|---|---|
| Limited Infrastructure and Immature Pyrolysis Technologies | -2.8% | Global, acute in South America and Middle-East and Africa | Medium term (2-4 years) |
| Feed-Stock Quality Variability from Fragmented Collectors | -1.9% | Asia-Pacific, South America, emerging markets | Short term (≤ 2 years) |
| Potential REACH Reclassification of Pyrolysis Oils | -1.4% | Europe, spillover regulatory risk to North America | Long term (≥ 4 years) |
| Source: Mordor Intelligence | |||
Limited Infrastructure and Immature Pyrolysis Technologies
Capital intensity and co-product monetization hurdles delay green-field plants in regions lacking tire-collection grids. Black Bear Carbon’s Chemelot project illustrates the need for multi-stream offtake—bio-fuel, steel, electricity—to reach hurdle rates. Higher-temperature gasification offers theoretical efficiency but demands even larger ticket sizes, explaining why pyrolysis captured more than 90% of 2025 output. Module-based reactors lower the entry bar but still require robust front-end sorting, a weak spot in South America and parts of Africa.
Potential REACH Reclassification of Pyrolysis Oils
An EU debate on Annex XVII could tag pyrolysis oils as hazardous, triggering more stringent handling and elevating compliance costs. Although no final decision emerged in 2025, the prospect slows financing for plants banking on oil revenue, especially in Germany and France[2]. North American investors monitor Brussels closely, aware that a negative ruling could echo in U.S. state regulations.
*Our forecasts treat driver/restraint impacts as directional, not additive. The impact forecasts reflect baseline growth, mix effects, and variable interactions.
Recovered Carbon Black Market Segment Analysis
By Grade:
Specialty Grades Capture Premium ApplicationsIn 2025, rubber-grade rCB held 70.21% volume, driven by Michelin, Nokian, and Pirelli offtakes that pre-sold all Uddevalla capacity. The recovered carbon black market share for rubber-grade is poised to erode modestly as conductive and specialty grades grow 22.89% CAGR through 2031, buoyed by 5G and EV shielding. Purified grades with less than 5% ash already command 15%-25% premiums in automotive coatings and inks. Cabot’s EVOLVE and Orion’s specialty portfolios validate that quality can outrank cost in decisive use cases. Over the forecast horizon, specialty tonnage could increase substantially, keeping utilization high at post-treatment units.
By Production Technology:
Pyrolysis Dominance Masks Gasification’s NichePyrolysis supplied 90.45% of global output in 2025 and is on track for 22.93% CAGR, making it the engine behind most recovered carbon black market additions. Scandinavian Enviro’s five-reactor Uddevalla design and Bolder Industries’ Terre Haute plant exemplify scaled, reactor-train architectures that monetize oil and steel alongside rCB. Gasification remains a niche, constrained to energy-recovery models rather than product-grade rCB. Modular auger reactors are emerging in small European installations, but bankability still hinges on proven offtake agreements.

By Application:
Tire Dominance Coexists with Plastics DiversificationTires consumed 71.23% of 2025 volume and will continue growing at 21.97% CAGR as OEMs target ≥40% sustainable content. Michelin’s Le Mans tire showcased 63% sustainable materials, including rCB, without compromising performance. Meanwhile, plastics, batteries, and coatings provide a hedge against any tapering in tire demand. Polyolefin masterbatch containing 20%-40% rCB delivers UV stability and conductivity at a substantial discount, supporting faster traction in consumer electronics and building products.
By End-user Industry:
Automotive Lock-In Drives Industrial Catch-UpAutomotive captured 72.35% of 2025 volume, reflecting the lock-step integration between pyrolysis operators and global tire majors. The industrial is forecast to expand at 22.07% CAGR on the back of Scope 3 emissions targets for conveyor belts, hoses, and seals. Printing and packaging inks are adopting purified grades, especially when crude prices exceed USD 80 bbl-1, making rCB a compelling hedge against petrochemical volatility.
Geography Analysis
Europe Recovered Carbon Black Market
Europe remains the nucleus of policy-driven demand. CBAM tariffs, effective 2026, push local OEMs toward certified rCB that avoids surcharges, while Regulation 2024/3012 awards long-term carbon-storage credits to pyrolysis operators with traceable supply chains. Uddevalla, Dole, and Dillingen plants now anchor regional output, and pre-sold capacity suggests chronic under-supply through 2028.
North America Recovered Carbon Black Market
North America follows a capacity-build narrative. Joint ventures involving Continental Carbon, Eco-Infinic, and CSRC materially de-risk financing, while Bolder Industries brings an 18 kt unit to Indiana in 2026 and plans a 30 kt module near Antwerp, Indiana, by 2027. Regional pricing remains the world’s highest, reflecting both freight economics and evolving tire-take-back infrastructure.
APAC Recovered Carbon Black Market
Asia-Pacific balances feedstock abundance with policy complexity. India’s 100% EPR target and South Korea’s Woven Capital-backed LD Carbon project illustrate clear momentum, yet inconsistent collection quality and capital constraints in Southeast Asia drag on utilization rates. China’s national ETS, effective 2024, introduces carbon costs that are likely to sharpen the competitive edge of domestically produced rCB over imported virgin fillers.
Value Chain Analysis
The recovered carbon black (rCB) value chain starts with end-of-life tire (ELT) generation, collection, and pre-processing (sorting and shredding), followed by pyrolysis, which supplied 90.45% of global output in 2025. Pyrolysis operators then perform upgrading steps (milling, classification, and pelletizing). For higher-value grades, they also run ash reduction and surface modification to meet performance requirements for tires, non-tire rubber, plastics, coatings, and conductive compounds.
Downstream adoption increasingly depends on standardized quality definitions. ASTM International's February 2026 classification standard D8632 for rCB helps buyers qualify material using parameters such as toluene transmittance and inorganic content. Key bottlenecks sit upstream and midstream, including feedstock quality variability from fragmented collectors and the need for bankable offtake across multiple output streams (rCB plus coproducts such as oils, steel, and energy) to support plant economics. Long-term agreements and OEM-linked channels reduce volatility, illustrated by NEXEN TIRE's May 2025 long-term supply agreement with LD Carbon and Infiniteria's June 2025 multi-year offtake covering full capacity from its Uddevalla project. Regulatory and compliance pathways also shape cross-border flows, as the EU's April 2026 End-of-Waste criteria for tyre pyrolysis-derived materials reduces administrative friction by enabling certain outputs to be treated as products rather than waste in cross-border logistics.
Competitive Landscape
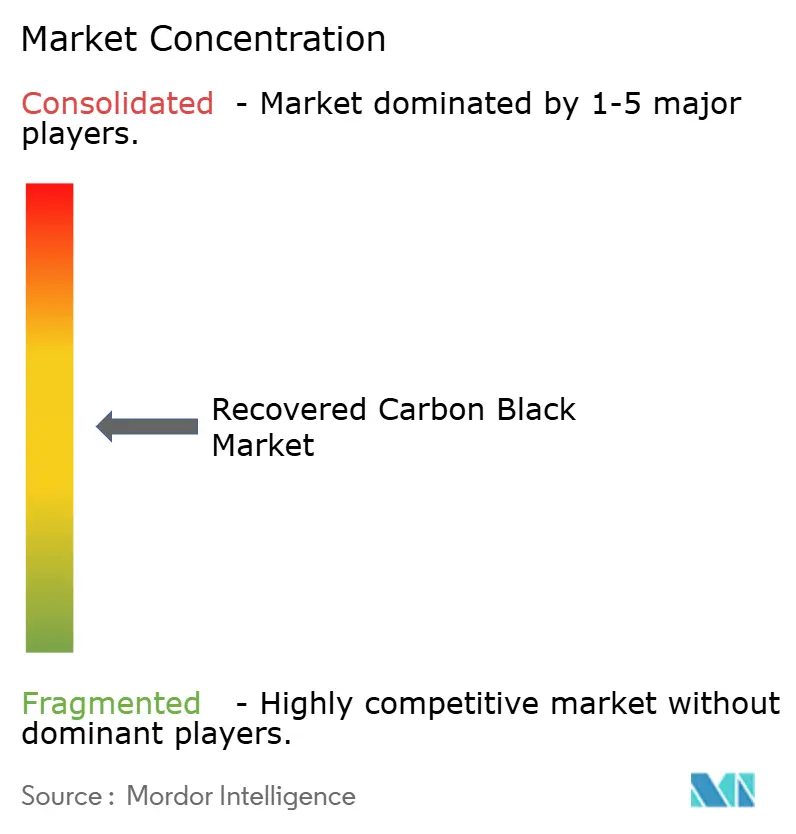
The recovered carbon black market presents moderate concentration. First movers - Scandinavian Enviro, Pyrum, Bolder Industries - control the bulk of contracted volume, while legacy carbon-black makers such as Cabot and Orion hedge with equity stakes or offtake agreements. Vertical integration stands out: Michelin’s stake in Enviro guarantees rCB for its European plants, and Bridgestone co-develops production with Tokai Carbon to buffer virgin supply risk. Technology competition pivots on post-treatment that yields less than 5% ash and tight particle-size distributions, enabling penetration into coatings and inks that demand high jetness.
Regulatory alignment is becoming a barrier to entry. Plants bearing ISCC, ISO 59014, and REACH-compliant certifications gain tariff exemptions under CBAM, putting uncertified operators at a cost disadvantage. Intellectual-property filings center on maximizing value from oil and gas coproducts to buttress project returns. New entrants push modular designs, but bankability still depends on long-term, credit-worthy offtake—an advantage held by European and North American incumbents.
Recovered Carbon Black Industry Leaders
-
Black Bear Carbon B.V.
-
Bolder Industries
-
Scandinavian Enviro Systems AB
-
Pyrum Innovations Ltd.
-
Cabot Corporation
- *Disclaimer: Major Players sorted in no particular order
Recovered Carbon Black Market Companies Covered in this Report
- Alpha Carbone
- Black Bear Carbon B.V.
- Bolder Industries
- Cabot Corporation
- Carbon Recovery GmbH
- Continental AG
- ENRESTEC
- Klean Industries Inc.
- LD Carbon Co., Ltd.
- Orion Engineered Carbons GmbH
- Orion S.A.
- Pyrolyx AG
- Pyrum Innovations Ltd.
- Reoil Sp. z o.o.
- Scandinavian Enviro Systems AB
- SR2O Holdings LLC
- Strebl Green Carbon Pte Ltd.
Market Opportunities and Future Outlook
A primary whitespace centers on scaling supply of consistently specified rubber-grade and specialty/conductive rCB. Capacity, rather than demand, remains the binding constraint, while tires accounted for 71.23% of 2025 consumption. Near-term opportunities therefore cluster around post-treatment and qualification pathways that unlock higher-value use cases. In May 2026, Pyrum Innovations received unlimited delivery approval from Continental for ThermoTireBlack produced at its new milling and pelletizing plant in Dillingen/Saar, reinforcing that OEM approvals and repeatable finishing operations increasingly determine access to premium tire formulations.
Geographic expansion and modular build-outs also create room for operators with permitting, port access, and certified traceability. In April 2026, Circtec opened a chemical recycling plant in Delfzijl, Netherlands, with 50,000 tonnes per year waste-tire capacity and a stated modular expansion track, while in June 2026 Bolder Industries secured final permitting for its Port of Antwerp-Bruges facility (86,000-metric-ton capacity), supporting a larger European hub for rCB supply. On the demand side, circular product portfolios from legacy carbon black producers continue to widen commercialization channels. Orion started producing ISCC PLUS-certified circular carbon black grades (ECORAX) at its Qingdao, China facility in June 2026, which helps standardize certified circular carbon materials in downstream procurement and specification practices.
Recent Industry Developments in Recovered Carbon Black Market
- June 2026: Bolder Industries received final permits for a commercial-scale recovered carbon black facility in the NextGen District at the Port of Antwerp-Bruges, Belgium, designed for an 86,000-metric-ton capacity. The project strengthens Europe-focused supply by anchoring production near a major logistics hub and shortening delivery lanes to regional tire and rubber customers.
- May 2025: NEXEN TIRE signed a long-term supply agreement with LD Carbon Co., Ltd. for recovered carbon black. The deal supports multi-plant manufacturing needs across geographies and shows how long-duration offtake is used to secure feedstock for sustainability-linked material targets.
- January 2025: Tokai Carbon, Bridgestone, Kyushu University, and Okayama University launched a NEDO-selected technology development project focused on secondary processing of recovered carbon black extracted from polymer products, including end-of-life tires. The program targets performance parity with virgin carbon black, underscoring the growing importance of post-processing know-how in reinforcement-critical applications.
Recovered Carbon Black Market Report Scope and Research Methodology
Market Definition and Coverage
For this study, the recovered carbon black market is defined as commercially sold rCB produced from end-of-life tires (and similar rubber streams) through pyrolysis, followed by upgrading steps so it can be used as a substitute filler and pigment in industrial formulations.
Scope exclusions: We exclude virgin carbon black, unrefined char, ground rubber powder, and other pyrolysis by-products such as oil and gas.
Segments Covered in This Report
- By Grade
- Rubber Grade rCB
- Specialty/Conductive Grade rCB
- By Production Technology
- Pyrolysis
- Gasification
- Other Production Technologies
- By Application
- Tires
- Plastics
- Batteries
- Non-tyre Rubber
- Dyes and Pigments
- By End-user Industry
- Automotive
- Printing and Packaging
- Industrial
- Building and Construction
- Electronics
- Other End-user Industries (Energy Storage)
- By Geography
- Asia-Pacific
- China
- India
- Japan
- South Korea
- ASEAN Countries
- Rest of Asia-Pacific
- North America
- United States
- Canada
- Mexico
- Europe
- Germany
- United Kingdom
- France
- Italy
- Spain
- NORDIC Countries
- Rest of Europe
- South America
- Brazil
- Argentina
- Rest of South America
- Middle-East and Africa
- Saudi Arabia
- United Arab Emirates
- South Africa
- Egypt
- Nigeria
- Rest of Middle-East and Africa
- Asia-Pacific
Data Sources, Market Sizing, and Validation
Desk Research
Desk research was used to build the starting fact base on feedstock availability, regulatory pull, and where rCB can practically substitute virgin material. Public sources, such as US EPA resources on waste and recycling, Eurostat waste statistics, ECHA and EU circular economy updates, and trade bodies like the European Tyre and Rubber Manufacturers Association, helped frame the end-of-life tire pool and the direction of policy support. We also reviewed technical and application signals from peer-reviewed journals (for example, rubber compounding and materials science publications) to understand common quality constraints such as ash and tint, which affect addressable demand.
On the commercial side, we referred to company filings, investor presentations, sustainability reports, and credible press coverage to map capacity announcements, offtake plans, and application wins. Where needed, we used paid subscriptions for company financials and intelligence, a patent database to track process and upgrading innovation, and an import-export shipment-level database to sanity check trade-linked movements of rCB and adjacent materials. The desk research sources mentioned are illustrative only, and we also referred to other public documents and datasets for data collection, validation, and research clarification.
Primary Interviews and Surveys
Primary work focused on validating what gets sold as rCB in practice, how upgrading changes usability, and what price and volume movements look like across key applications. We spoke with a mix of rCB producers, tire and rubber compounders, plastics and coatings users, and downstream distributors, then used follow-up questions to close gaps around qualification timelines and typical substitution rates. Because this is a global market, coverage was balanced across APAC, EMEA, and the Americas, so regional policy effects and new supply additions were reflected in the final assumptions.
Distribution of primary research fieldwork respondents
| Company type | Respondent position | Region |
|---|---|---|
| Top tier: 30% | CXOs: 19% | APAC: 41% |
| Mid tier: 51% | Functional/Unit leaders: 27% | EMEA: 35% |
| Smaller Players: 19% | Managers: 54% | Americas: 24% |
Market-Sizing & Forecasting
Market sizing was built using a top-down and bottom-up combination, centered on a demand pool constrained by qualified supply. The top-down side starts from the available end-of-life tire and rubber feedstock pool by region, then applies realistic collection rates, pyrolysis yield factors, and the share of output that is upgraded into saleable rCB, which is allocated into end-use applications based on qualification status and typical substitution ranges.
To keep the model grounded, we corroborated results with selective bottom-up checks, such as rolling up announced and operating capacity at key plants, applying utilization bands, and validating output-to-sales conversion through channel checks. Inputs that mattered most included installed and announced rCB capacity, typical plant ramp-up time, upgrading intensity (which shifts usable grades), average realized selling price trends by application, and the mix split between tire compounds and non-tire uses. Where company-level data was incomplete, gaps were handled using peer benchmarks for utilization and yield, then adjusted using primary feedback so the totals stayed realistic.
For forecasting, scenario analysis was used because adoption is strongly shaped by policy changes and qualification cycles, not just linear demand growth. Base, upside, and downside cases were set around variables like recycled content requirements, tire-maker approvals, and regional capacity additions, and then the final forecast path was selected based on what most experts described as achievable over the next five years.
Data Validation & Update Cycle
Outputs were checked through several layers to catch unusual jumps early. We compared modeled volumes and implied revenues against independent signals such as announced plant capacities, observed ramp-up patterns, and the pace of approvals in major tire and rubber applications, and then investigated any variances that did not fit how the market typically operates. Where mismatches were found, we re-tested assumptions through follow-up outreach and re-reading of source documents, before passing results through an internal analyst review.
This report is refreshed on an annual cycle, and interim updates are made when material events occur, such as major capacity starts, regulatory changes, or large offtake announcements. Before delivery, the model is re-opened for a final pass so clients receive an updated view that reflects the latest developments and any corrected assumptions.
Mordor Intelligence's Recovered Carbon Black Market Size Compared Against Other Published Estimates
Published market sizes for recovered carbon black often differ because each publisher uses a different mix of what counts as rCB, which applications are included, and whether the figure is built from volumes or from price-based assumptions. Differences also come from ramp-up timing assumptions, how substitution is treated after qualification, and whether inflation and currency timing are handled consistently.
Some external estimates expand scope to include unrefined char or other pyrolysis outputs that move alongside rCB in projects, which mechanically lifts the reported value. For Mordor Intelligence, only upgraded, commercially sold recovered carbon black is counted, and adjacent by-products like oil, gas, and raw char sit outside scope, which keeps the number tied to qualification-led demand.
Benchmark comparison
| Source | Market Size | Gaps in Research Methodology |
|---|---|---|
| Mordor Intelligence | USD 0.49 B (2026) | |
| Global Consultancy A | USD 0.49 B (2023) | Uses an earlier base year and blends regions with uneven commercialization, and the uplift in average selling prices is often applied before qualification and substitution limits are validated. |
| Data Specialist B | USD 2.35 B (2024) | Often includes char and other pyrolysis by-products, and can value the basket using broader circular materials price points rather than rCB-only commercial grades. |
Looking across the table, the biggest spread is explained by scope and the unit of measurement, then by how quickly ramp-ups and pricing are assumed to occur. By keeping the model anchored to saleable rCB output, realistic utilization, and application-level adoption timing, the resulting figure stays easier to audit and reuse in planning discussions.
Key Questions Answered in the Report
How large will the recovered carbon black market be by 2031?
Volume is projected to reach 363.70 kilotons by 2031, reflecting a 21.35% CAGR from the 2026 baseline of 138.21 kilotons.
Which region grows fastest after 2026?
North America leads with a forecast 21.89% CAGR, fueled by joint-venture plants that come online between 2026 and 2027.
Why are tire makers locking in long-term rCB contracts?
OEM sustainability targets of ≥40% recycled content and CBAM-related cost pressures drive manufacturers to secure future supply at predictable prices.
What share does pyrolysis hold among production technologies?
Pyrolysis accounts for 90.45% of global output in 2025 and is expected to retain leadership as its capacity expands at 22.93% CAGR.