
Ready-to-Drink Protein Beverages Market Size and Share
Market Overview
| Study Period | 2021 - 2031 |
|---|---|
| Market Size (2026) | USD 2.11 Billion |
| Market Size (2031) | USD 3.06 Billion |
| Growth Rate (2026 - 2031) | 7.70 % |
| Fastest Growing Market | Asia Pacific |
| Largest Market | North America |
| Market Concentration | Medium |
Major Players *Disclaimer: Major Players sorted in no particular order Image © Mordor Intelligence. Reuse requires attribution under CC BY 4.0. | |
Ready-to-Drink Protein Beverages Market Analysis by Mordor Intelligence
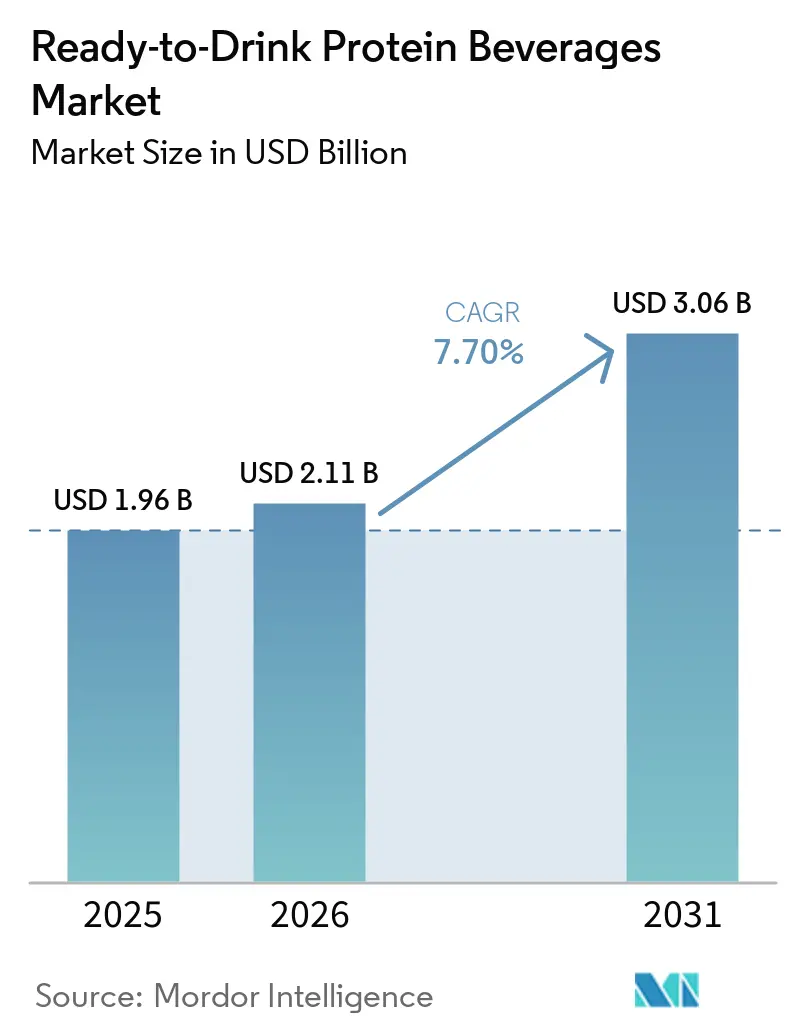
The Ready-to-Drink (RTD) protein beverages market size was valued at USD 1.96 billion in 2025 and estimated to grow from USD 2.11 billion in 2026 to reach USD 3.06 billion by 2031, at a CAGR of 7.70% during the forecast period (2026-2031). This growth stems from changing consumer preferences, combining health awareness with the need for convenient nutrition options in modern lifestyles. Consumers increasingly prefer portable nutrition solutions that support fitness, muscle recovery, and wellness while maintaining taste and quality. Market growth factors include the expanding global fitness culture, urbanization, and rising demand for plant-based and allergen-free proteins. Animal-based proteins, particularly whey, remain dominant due to established dairy infrastructure and consumer trust. However, plant-based alternatives like pea and soy proteins are gaining market share, driven by environmental consciousness and sustainable diet preferences. North America dominates the market through its robust retail infrastructure, acceptance of premium products, and established fitness culture. The Asia-Pacific region shows the highest growth rate, supported by economic development, increasing health awareness among middle-class consumers, and favorable regulations.
Key Report Takeaways
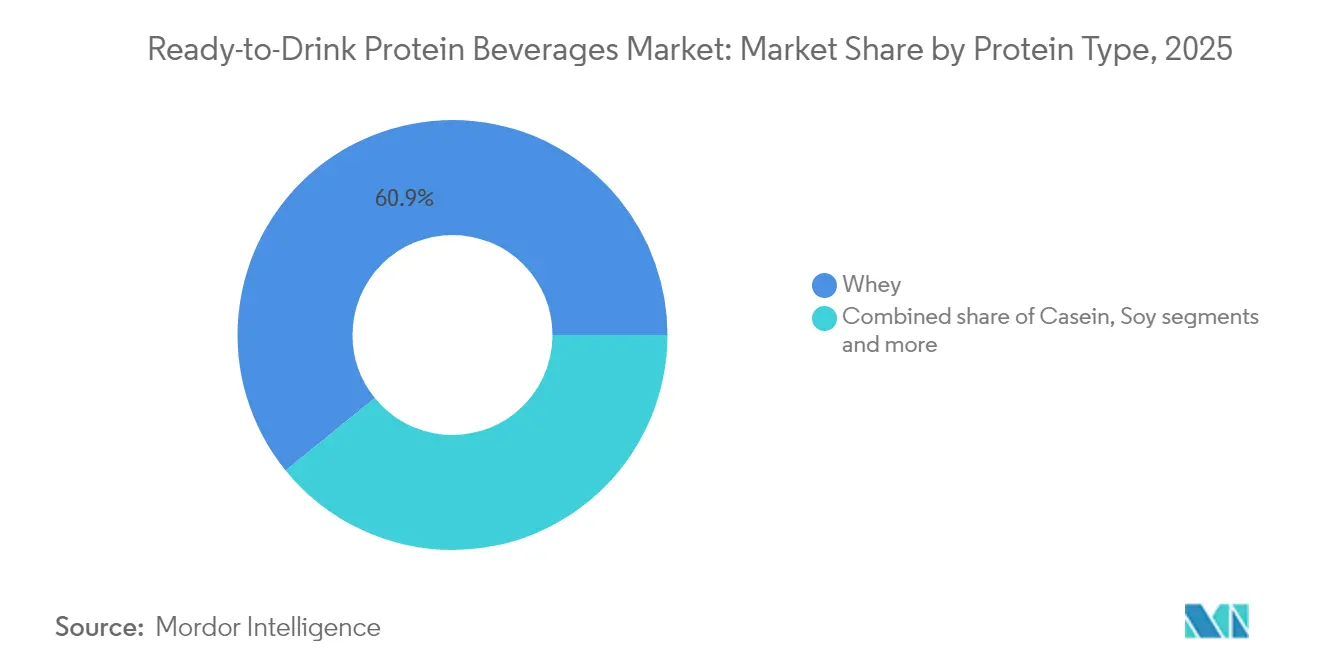
- By protein type, whey protein held 60.85% of the Ready to Drink Protein Beverages market share in 2025; pea protein is projected to expand at a 8.74% CAGR through 2031.
- By protein source, animal proteins accounted for 70.55% share of the Ready to Drink Protein Beverages market size in 2025, while plant-based proteins are advancing at an 8.33% CAGR to 2031.
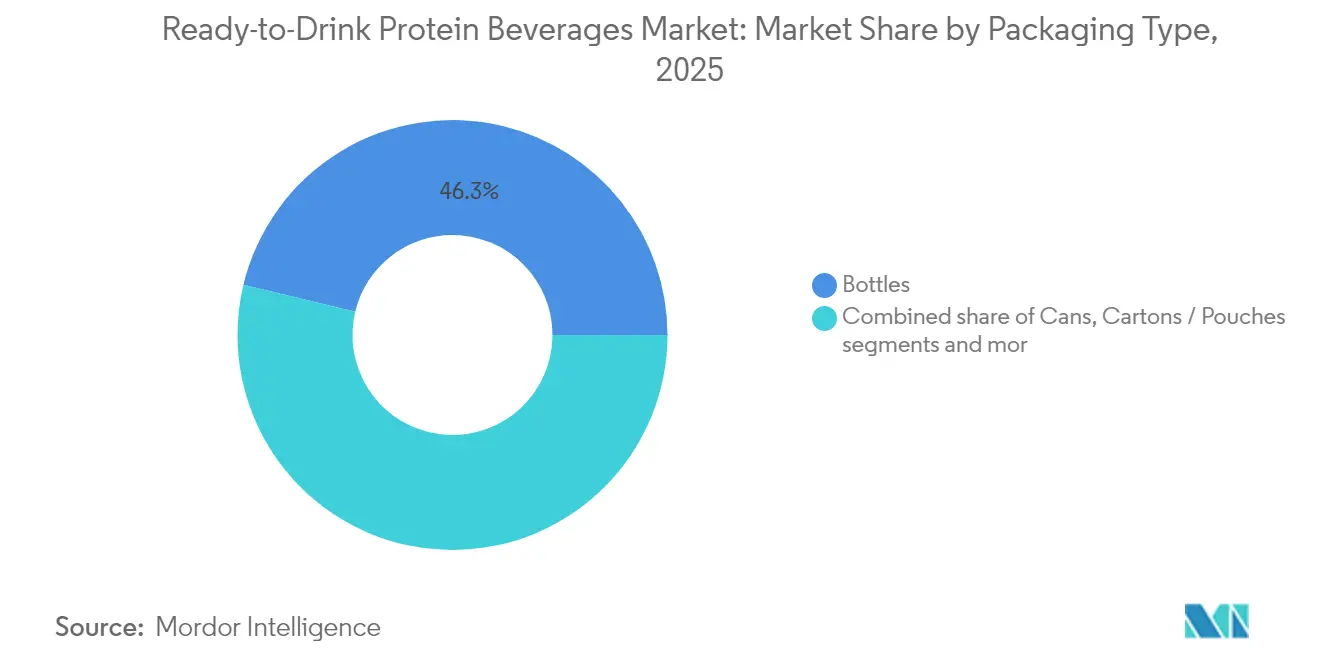
- By packaging type, bottles captured 46.25% revenue share in 2025; cartons and pouches are forecast to grow at a 7.75% CAGR between 2026-2031.
- By distribution channel, supermarkets and hypermarkets commanded 53.10% share of the Ready to Drink Protein Beverages market size in 2025; online retail records the highest projected CAGR at 9.85% through 2031.
- By geography, North America led with 38.40% revenue share in 2025, whereas Asia-Pacific is set to register the quickest regional pace at a 8.89% CAGR to 2031.
Note: Market size and forecast figures in this report are generated using Mordor Intelligence’s proprietary estimation framework, updated with the latest available data and insights as of 2026.
Market Trends and Insights
Drivers Impact Analysis of Ready-to-Drink Protein Beverages Market*
| Driver | (~) % Impact on CAGR Forecast | Geographic Relevance | Impact Timeline |
|---|---|---|---|
| Rising health consciousness and wellness awareness among consumers | +1.8% | Global, with strongest impact in North America and Europe | Medium term (2-4 years) |
| Increasing adoption of fitness and active lifestyles | +1.5% | North America and Asia-Pacific core, spill-over to Europe | Long term (≥ 4 years) |
| Growing demand for convenient and on-the-go nutritional solutions | +1.2% | Global, particularly urban centers | Short term (≤ 2 years) |
| Expanding consumer base for plant-based and vegan diets | +0.9% | North America and the European Union, emerging in the Asia-Pacific | Medium term (2-4 years) |
| Continuous product innovation in the market | +0.8% | Global, with strongest impact in North America | Long term (≥ 4 years) |
| Rising demand for meal replacement and weight management products | +1.0% | Global, concentrated in developed markets | Medium term (2-4 years) |
| Source: Mordor Intelligence | |||
Rising Health Consciousness and Wellness Awareness Among Consumers
Health consciousness and wellness awareness among consumers drive the ready-to-drink (RTD) protein beverages market growth. Consumers are increasingly informed about their health due to concerns over lifestyle-related conditions such as obesity, diabetes, and cardiovascular diseases. This awareness leads to healthier eating habits and increased consumption of functional foods and beverages that support weight management, muscle health, and overall well-being. According to the United States Centers for Disease Control and Prevention (CDC), the prevalence of obesity in adults was 40.3% from August 2021 to August 2023 [1]. This high obesity rate, particularly in adults aged 40-59, demonstrates the need for wellness-oriented products and increases consumer interest in ready-to-drink protein beverages. The consistent obesity rates, despite public health initiatives, indicate continued demand for convenient nutrition products that support weight management, muscle health, and overall wellness.
Increasing Adoption of Fitness and Active Lifestyles
The increasing adoption of fitness and active lifestyles drives the ready-to-drink (RTD) protein beverages market growth. Higher participation in structured exercise and gym memberships creates demand for convenient nutrition products that support muscle recovery, energy replenishment, and physical performance. Ready-to-drink (RTD)protein beverages offer an accessible source of high-quality protein, meeting the needs of fitness enthusiasts who require efficient nutrition around workouts. According to the Health & Fitness Association (HFA), in 2024, approximately 77 million Americans aged six and above—representing 25% of the United States population- held memberships in gyms, studios, or fitness facilities. The growth of fitness studios, gyms, and multipurpose clubs, combined with increased attendance rates, generates higher demand for protein supplements that support muscle building, weight management, and recovery. Ready-to-drink (RTD) protein beverages appeal particularly to active consumers who need nutrition solutions compatible with their busy schedules.
Growing demand for convenient and on-the-go nutritional solutions
The increasing consumer demand for convenient and on-the-go nutritional solutions serves as a primary growth factor in the ready-to-drink (RTD) protein beverages market. The contemporary workforce, characterized by intensive schedules, extended commuting periods, and time constraints, necessitates nutritious food alternatives requiring minimal preparation time. Ready-to-drink (RTD) protein beverages fulfill this market requirement by offering portable, pre-packaged protein sources appropriate for consumption across various settings, including workplace environments, post-exercise recovery periods, and during transit. In May 2023, Danone strategically expanded its market presence beyond traditional dairy products through the introduction of Oikos Protein Shakes in the RTD shelf-stable beverage segment. The product specifications include 30 grams of protein, 5 grams of prebiotic fiber to enhance digestive function, 1 gram of sugar without additional sweeteners, and essential vitamins A and D for immunological support per 12-ounce serving. This strategic product introduction addresses the market demand for functional, clean-label ready-to-drink shakes that accommodate rigorous daily schedules while delivering sustained energy and satiety benefits.
Expanding Consumer Base for Plant-Based and Vegan Diets
The growing consumer preference for plant-based and vegan diets drives the ready-to-drink (RTD) protein beverages market. This growth stems from increased awareness of environmental sustainability, animal welfare concerns, and the health benefits of plant-based nutrition. Consumers seek alternatives to animal-derived proteins due to concerns about climate change, resource scarcity, and ethical food production. The prevalence of dietary restrictions, including lactose intolerance and allergies to dairy and soy, increases demand for plant-based protein sources such as pea, rice, and hemp. Manufacturers are responding by introducing high-protein plant-based beverages. For instance, in January 2024, Suja Organic launched Suja Organic Protein Shakes, containing 16 grams of plant-based protein from pea, rice, and hemp sources. The product line features flavors including Vanilla Cinnamon, Chocolate, and Coffee Bean, addressing consumer demand for nutritious plant-based options. This product launch demonstrates the market's response to consumer requirements for plant-based protein products with organic certification and transparent ingredient labeling.
Restraints Impact Analysis of Ready-to-Drink Protein Beverages Market*
| Restraint | (~) % Impact on CAGR Forecast | Geographic Relevance | Impact Timeline |
|---|---|---|---|
| Price volatility and high raw material costs | -1.2% | Global, particularly impacting emerging markets | Short term (≤ 2 years) |
| Availability of substitutes and intense market competition | -0.8% | Global, most intense in mature markets | Medium term (2-4 years) |
| Stringent regulatory requirements and compliance standards | -0.5% | North America and the European Union primarily | Long term (≥ 4 years) |
| Product development challenges in taste and texture optimization | -0.3% | Global, affecting plant-based segments more | Medium term (2-4 years) |
| Source: Mordor Intelligence | |||
Price Volatility and High Raw Material Costs
Raw material price volatility and high costs constrain the global Ready-to-Drink (RTD) protein beverages market growth. The industry depends on essential ingredients like whey, soy, and dairy derivatives, whose prices fluctuate due to climate conditions, supply chain disruptions, and changing trade policies. These price variations increase production costs, making it difficult for manufacturers to maintain competitive pricing while ensuring product quality. According to the United States Department of Agriculture (USDA), the all-milk price is projected at USD 22.00 per hundredweight in 2025 and USD 21.65 per hundredweight in 2026. These high milk prices directly affect the cost structure of protein beverage manufacturers who use dairy-based ingredients. The price instability impacts market growth by reducing profit margins, forcing manufacturers to either increase retail prices, potentially limiting consumer access, or absorb the higher costs, affecting their financial performance. Additionally, manufacturers face challenges in supply planning and strategic operations due to difficulties in accurate cost forecasting.
Availability of substitutes and intense market competition
The global Ready-to-Drink (RTD) protein beverages market encounters substantial limitations attributed to product substitution and market competition. The segment experiences direct competition from alternative protein delivery formats, including protein bars, powders, and conventional dairy products such as milk and yogurt. These substitutes compete across multiple parameters, encompassing price points, accessibility, organoleptic properties, and nutritional composition, subsequently impacting the profit margins of Ready-to-Drink (RTD) beverage manufacturers. The proliferation of protein source fragments affects consumer expenditure and market distribution, creating barriers for individual brands to establish market dominance. Traditional dairy products maintain significant consumer allegiance as fundamental protein sources, particularly in regions with established dairy consumption patterns. This competitive landscape necessitates continuous product development initiatives and strategic marketing investments to sustain consumer engagement and market positioning.
*Our forecasts treat driver/restraint impacts as directional, not additive. The impact forecasts reflect baseline growth, mix effects, and variable interactions.
Ready-to-Drink Protein Beverages Market Segment Analysis
By Protein Type:
Whey Dominance Drives Market MaturityWhey protein maintains its market leadership in 2025 with a 60.85% share, supported by established dairy industry infrastructure and consumer familiarity with milk-derived proteins. The United States Department of Agriculture reports that dairy production in the United States reached 227.2 billion pounds, ensuring consistent whey protein availability through higher fat and skim-solids content in milk . This dairy production foundation enables manufacturers to meet demand reliably. Whey protein's market position stems from its nutritional profile, high bioavailability, and muscle recovery benefits, which appeal to fitness enthusiasts and health-conscious consumers.
Pea protein shows the highest growth potential with a projected CAGR of 8.74% from 2026 to 2031. This growth results from increased adoption of plant-based diets and its allergen-free characteristics, which attract consumers with dairy sensitivities and lactose intolerance. Derived from yellow field peas, this protein offers essential amino acids in a hypoallergenic form, providing an alternative to common allergens like dairy and soy. The expansion of vegan, vegetarian, and flexitarian diets, combined with environmental and ethical considerations, increases demand for pea protein as a sustainable option. Consumers choose pea protein for its cardiovascular health benefits, weight management properties, and muscle preservation capabilities.

By Protein Source:
Animal Proteins Lead Despite Plant-Based MomentumAnimal-based proteins hold 70.55% of the market share in 2025, primarily due to established supply chains and consumer acceptance of dairy-derived ingredients. The dairy industry infrastructure provides a consistent supply of high-quality proteins such as whey and casein. These proteins offer complete amino acid profiles, high bioavailability, and demonstrated benefits for muscle building and recovery. Consumer preference for these traditional protein sources stems from their familiarity, scientifically validated health benefits, and availability across various formats, including powders, ready-to-drink beverages, and nutritional supplements. The market position strengthens further through innovations in clean-label, grass-fed, and organic options.
Plant-based proteins are experiencing rapid growth at an 8.33% CAGR from 2026 to 2031, driven by evolving dietary preferences and environmental awareness. Proteins derived from pea, soy, lentil, and rice are increasing in popularity due to their allergen-free properties and compatibility with vegan, vegetarian, and flexitarian diets. Consumer concerns about the environmental impact of animal agriculture, including greenhouse gas emissions, land use, and water consumption, support the expansion of plant-based alternatives. Moreover, according to Agriculture and Agri-Food Canada, India's soy milk production used 19.5 metric tons of plant-based protein ingredients in 2023, highlighting the importance of soy protein in the plant-based dairy alternatives market .
By Packaging Type:
Sustainability Drives Format InnovationBottles constitute 46.25% of the packaging market share in 2025, attributed to established consumer recognition and retail merchandising advantages that enhance product visibility. The conventional bottle format delivers precise portion control and accessibility, specifically advantageous in fitness facilities and professional environments where single-serve packaging is essential. Glass bottles cater to premium market segments, while plastic alternatives provide cost-effectiveness and durability for consumers with active lifestyles. Manufacturers leverage the established bottle production and filling infrastructure to optimize production volume management.
Cartons and pouches demonstrate a projected growth rate of 7.75% CAGR from 2026-2031, primarily attributed to environmental sustainability advantages and technological packaging advancements. Environmental consciousness among consumers and organizational sustainability objectives influence purchasing behaviors across demographic segments. These flexible packaging configurations minimize transportation expenses and maximize storage efficiency, generating operational advantages that translate to enhanced consumer value propositions. The implementation of aseptic processing technologies in cartons and pouches facilitates ambient temperature storage, expanding distribution capabilities and reducing cold chain infrastructure requirements across various geographical regions.
By Distribution Channel:
Digital Transformation Reshapes Retail AccessSupermarkets and hypermarkets hold a 53.10% share of distribution in 2025. These traditional retail formats benefit from established consumer shopping habits and create cross-merchandising opportunities that encourage impulse purchases and brand discovery. These channels offer product visibility and sampling opportunities essential for brand development, especially for new product launches and educating consumers about protein beverage benefits. The addition of health and wellness sections in traditional retail stores provides dedicated space for protein beverages, enhancing category visibility and consumer consideration. Distribution reach expands through retail partnerships with fitness centers and health-focused retailers, connecting with key consumer segments.
Online retail is projected to grow at a 9.85% CAGR from 2026-2031, making it the fastest-growing distribution channel. This growth reflects increased e-commerce adoption in food and beverages, supported by subscription models that generate repeat purchases. Digital channels enable direct-to-consumer relationships, providing manufacturers with consumer data and feedback for product development and marketing improvements. Online ordering and home delivery meet the needs of busy consumers while supporting bulk purchases that improve economics for both buyers and manufacturers. E-commerce platforms support purchase decisions through detailed nutritional information and customer reviews, particularly important for functional beverages where benefits require explanation.
Geography Analysis
North America Ready-to-Drink Protein Beverages Market
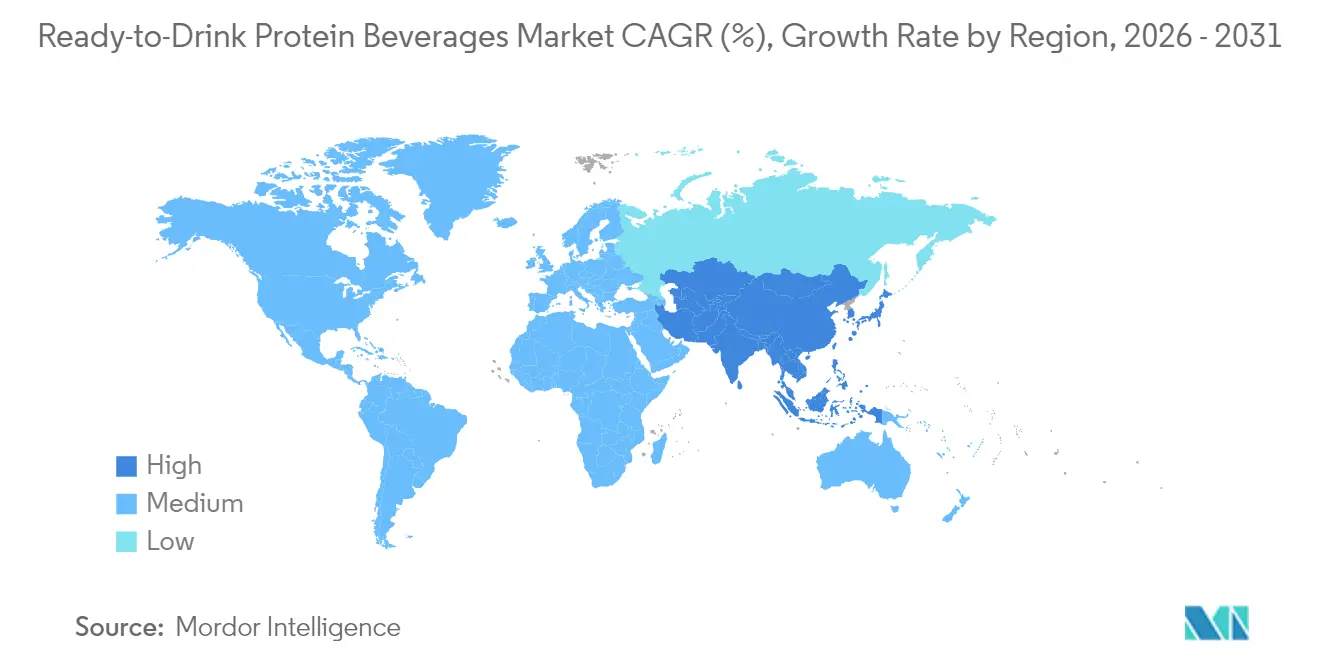
North America leads the global protein beverage market in 2025, holding a substantial 38.40% share. This leadership stems from its established fitness culture and consumer acceptance of premium functional beverages that drive higher per-capita consumption rates. The region's advanced retail infrastructure supports diverse distribution channels, while consumers demonstrate willingness to pay premium prices for health-oriented products. This market environment supports continuous brand development and product innovation, particularly in clean-label, plant-based, and reduced-sugar formulations. The United States and Canada dominate the North American market, with growing fitness trends, health consciousness, and high health club membership rates driving protein beverage adoption.
APAC Ready-to-Drink Protein Beverages Market
Asia-Pacific emerges as the fastest-growing region with a projected CAGR of 8.89% from 2026 to 2031. Economic development and expanding middle-class populations drive this growth. Increased health consciousness, adoption of fitness and protein-rich diets, and urbanization in China, India, Japan, and Australia support market expansion. Manufacturers respond to regional preferences by developing protein beverages with local flavors, including plant-based and clean-label options. Government wellness programs, increasing gym memberships, and consumer interest in sustainable lifestyles further accelerate market growth.
EMEA and South America Ready-to-Drink Protein Beverages Market
Europe maintains a mature and stable market with established regulatory frameworks and high consumer awareness of functional beverages and their health benefits. South America and the Middle East & Africa demonstrate emerging growth potential driven by urbanization, rising disposable incomes, and increasing health awareness. The growing demand for protein-rich foods and expanding food and beverage industries support market development, alongside rising interest in sports nutrition and supplements.
Regulatory Landscape
Ready-to-drink (RTD) protein beverages generally fall under mainstream food rules in major markets, which keeps labeling requirements, ingredient permissions, and claims substantiation at the center of compliance. In the United States, the FDA provides labeling and nutrition guidance documents for conventional foods and dietary supplements, influencing how protein content and related nutrition statements appear on packs and online. The FDA also set January 1, 2028 as a uniform compliance date for food labeling regulations published between January 1, 2025 and December 31, 2026, creating a defined transition window for label updates across multiple rulemakings.
In Europe, access for novel protein sources and certain functional ingredients is managed under Regulation (EU) 2015/2283 (Novel Foods) and related implementing acts that add authorized items to the Union list. This affects ingredient selection for both animal-based and plant-based RTD formulations. A relevant example is the EU authorization under Regulation 2026/386, where NapiFeryn BioTech Sp. z o.o. received a five-year exclusive market access period in the EU for its defatted rapeseed powder novel food ingredient starting 15 March 2026. Cross-border commercialization also requires handling regional differences in additive permissions and post-Brexit labeling requirements, which can limit SKU uniformity across the EU, the UK, and other export markets.
Value Chain Analysis
The RTD protein beverages value chain begins with sourcing protein inputs, including whey and other dairy proteins, pea/soy and other plant proteins, and stabilizers and sweeteners, followed by formulation and processing steps that depend on protein functionality. Typical manufacturing flows include high-speed hydration and dispersion of powders or premixes, pH adjustment, homogenization, and thermal processing (pasteurization, sterilization, or aseptic processing) before filling into bottles, cans, or cartons/pouches. Scale-up from pilot batches (about 50-500 L) to full production (10,000 L and above) is a key execution step, because changes in heat transfer and shear can raise risks of protein denaturation, sedimentation, and texture defects, especially for higher-protein and clear or acidified concepts.
Downstream participants include co-manufacturers (CMOs/OEMs) and bottlers, packaging suppliers, and 3PL/4PL logistics providers, alongside multi-channel retailers spanning supermarkets and hypermarkets, club and mass, specialty nutrition, drug, and e-commerce. Distribution performance is influenced by OTIF requirements and narrow delivery windows that can drive accessorial charges and service penalties, while cold-chain availability varies by region and can affect product format choices (refrigerated versus shelf-stable aseptic). Cost exposure also runs through packaging and manufacturing. BellRing Brands noted in its FY2025 reporting that while inflationary pressures on protein costs eased, packaging and manufacturing remained exposed to inflationary pressures and global trade policy volatility, reinforcing the need for procurement discipline and packaging-format optimization.
Competitive Landscape
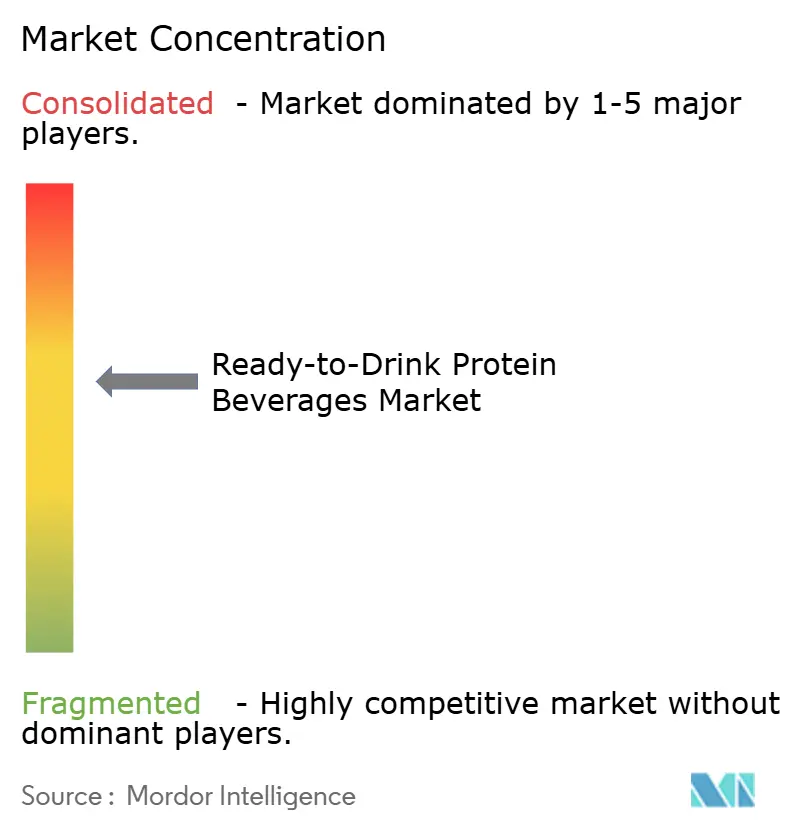
The ready-to-drink protein beverages market shows moderate fragmentation, with competition among established beverage companies, specialized nutrition firms, and emerging plant-based manufacturers. Market concentration reflects the substantial capital requirements for manufacturing operations and distribution networks. Regulatory compliance requirements create entry barriers that benefit companies with established quality systems and compliance expertise. Major players in the market include Glanbia PLC, PepsiCo Inc., The Coca-Cola Company, Danone SA, and Nestlé S.A.
Companies focus on ingredient differentiation, sustainability credentials, and omnichannel distribution capabilities to gain competitive advantages. Innovation in protein sources and functional ingredients drives product differentiation. The acquisition of OWYN by The Simply Good Foods Company in June 2024 represents strategic consolidation in the plant-based ready-to-drink protein segment, aiming to leverage distribution networks and expand consumer reach.
Technology adoption improves supply chain efficiency and consumer engagement, with digital platforms enabling direct-to-consumer relationships and subscription models that increase customer retention. Companies with robust quality management systems and regulatory compliance capabilities gain advantages through enhanced food safety and preventive controls.
Ready-to-Drink Protein Beverages Industry Leaders
-
Glanbia PLC
-
PepsiCo Inc.
-
The Coca-Cola Company
-
Danone SA
-
Nestlé S.A.
- *Disclaimer: Major Players sorted in no particular order
Ready-to-Drink Protein Beverages Market Companies Covered in this Report
- Abbott Nutrition
- Glanbia PLC
- PepsiCo Inc.
- The Coca-Cola Company
- Post Holdings Inc. (Premier Nutrition)
- Danone SA
- Nestle S.A.
- Halen Brands Inc.
- Koia Inc.
- Labrada Nutrition
- Simply Good Foods Company (Atkins)
- Aloha
- AltCo
- The Hut Ltd (My Protein)
- Soylent Nutrition Inc.
- Ripple Foods PBC
- MusclePharm Corp.
- Optimum Nutrition (ON)
- Transparent Labs
- Unjury Protein
Market Opportunities and Future Outlook
Product architecture is moving beyond classic milk-based shakes toward higher-protein formulations and new consumption moments, which creates room for brands to compete on taste, texture, and clean-label positioning. In 2026, Premier Protein introduced Premier Protein Ultimate in a 14 oz format with 42 g of protein, and PepsiCo reformulated Muscle Milk RTD shakes around ultra-filtered milk while removing artificial sweeteners, flavors, and added colors, pointing to demand for premium, high-protein propositions anchored in simpler ingredient statements. Danone also expanded its shelf-stable Oikos RTD protein shakes with new flavors, including a caffeinated Mocha Latte built around the profee (protein coffee) trend, illustrating how protein can be positioned for incremental daypart occasions alongside RTD coffee and functional energy beverages.
Plant-based and other alternative protein formats continue to open additional lanes, supported by retail expansion and ingredient authorization pathways. Elmhurst 1925 launched a plant-based Clean Protein RTD line with national distribution at Sprouts Farmers Market in 2026, which supports the case for plant-protein brands that can match mainstream retail velocity. Separately, EU novel food authorizations, including defatted rapeseed powder authorized with exclusivity starting 15 March 2026 under Regulation 2026/386, show a pathway for differentiated protein sources in European formulations, subject to specific market-access conditions. Manufacturing capability remains another differentiator: the completion of a clean-label RTD prototype production run at Tetra Pak's New Product Development Center (announced by Edible Garden in 2026) highlights how brands can accelerate commercialization by leveraging established beverage process and packaging platforms, particularly for shelf-stable cartons and formats that reduce dependence on cold-chain logistics.
Recent Industry Developments in Ready-to-Drink Protein Beverages Market
- May 2026: PepsiCo announced a completed reformulation of its Muscle Milk ready-to-drink protein shake lineup, shifting to ultra-filtered milk as the primary protein source and removing artificial sweeteners, flavors, and added colors. The change aligns a major incumbent brand with clean-label purchasing behavior while supporting premium positioning through higher-protein dairy processing cues. It also raises the bar for claims compliance and ingredient transparency across mainstream retail channels.
- May 2026: Danone expanded its shelf-stable Oikos ready-to-drink protein shakes with two new flavors, Strawberry and a caffeinated Mocha Latte aimed at the profee (protein coffee) consumption occasion. The update extends usage beyond post-workout into morning and daytime routines where RTD coffee competes for share. Shelf-stable distribution also supports broader presence in supermarkets/hypermarkets and convenience-oriented points of sale.
- January 2024: Suja Organic launched Suja Organic Protein Shakes featuring 16 grams of plant-based protein sourced from pea, rice, and hemp, offered in flavors including Vanilla Cinnamon, Chocolate, and Coffee Bean. The launch reinforced the plant-based RTD protein segment with an organic-led positioning and transparent protein-source communication. It also increased competitive pressure on dairy-based incumbents by expanding allergen-aware options in ready-to-drink formats.
Ready-to-Drink Protein Beverages Market Report Scope and Research Methodology
Market Definition and Coverage
This market covers ready-to-drink beverages that are consumed as packaged liquids and positioned around added protein for nutrition, fitness, or meal support, regardless of protein source or flavor.
Scope exclusions: Powdered protein mixes, protein bars, and plain dairy or plant beverages without an added-protein proposition are excluded.
Segments Covered in This Report
- By Protein Type
- Whey
- Casein
- Soy
- Pea
- Other Sources
- By Protein Source
- Animal-based
- Plant-based
- By Packaging Type
- Bottles
- Cans
- Cartons / Pouches
- Others
- By Distribution Channel
- Supermarkets / Hypermarkets
- Pharmacies / Drugstores
- Specialist Retailers
- Online Retail
- Other Channels
- By Geography
- North America
- United States
- Canada
- Mexico
- Rest of North America
- Europe
- Germany
- United Kingdom
- Italy
- France
- Spain
- Netherlands
- Poland
- Belgium
- Sweden
- Rest of Europe
- Asia-Pacific
- China
- India
- Japan
- Australia
- Indonesia
- South Korea
- Thailand
- Singapore
- Rest of Asia-Pacific
- South America
- Brazil
- Argentina
- Colombia
- Chile
- Peru
- Rest of South America
- Middle East and Africa
- South Africa
- Saudi Arabia
- United Arab Emirates
- Nigeria
- Egypt
- Morocco
- Turkey
- Rest of Middle East and Africa
- North America
Data Sources, Market Sizing, and Validation
Desk Research
Desk research is used to set the model structure and to anchor basic demand and supply signals that can be checked repeatedly. We rely on public sources such as USDA food and dairy references, US CDC and NIH publications on nutrition and dietary patterns, the European Commission food labeling rules and guidance, and FAOStat for related dairy and crops indicators. We also review customs and trade releases from sources such as UN Comtrade to understand cross-border flows for relevant beverage and dairy categories.
To keep assumptions realistic, we scan company annual reports, investor presentations, product labeling disclosures, and retailer and association websites for pack sizes, protein claims, and pricing direction. Limited paid database access is used for company financials and news intelligence, import and export shipment-level signals, and patent databases to track formulation activity. The examples above are not exhaustive, and many other public and paid sources were used for data collection, validation, and research clarification.
Primary Interviews and Surveys
Primary work is used to pressure-test the desk model and fill gaps where public data does not explain well, including channel margins, private label pricing behavior, and how often brands reset pack sizes and protein grams per serving. We spoke with a mix of brand-side executives, distributors, ingredient and packaging contacts, and retail category managers across APAC, EMEA, and the Americas to compare assumptions with real buying and selling patterns.
Distribution of primary research fieldwork respondents
| Company type | Respondent position | Region |
|---|---|---|
| Top tier: 30% | CXOs: 12% | APAC: 45% |
| Mid tier: 51% | Functional/Unit leaders: 35% | EMEA: 30% |
| Smaller Players: 19% | Managers: 53% | Americas: 25% |
Market-Sizing & Forecasting
Market sizing is built using a mix of top-down and bottom-up checks, so the final number stays practical and explainable. On the top-down side, we reconstruct the demand pool by combining beverage consumption and nutrition behavior signals, and then apply RTD protein penetration and price ladders by region, followed by packaging and channel splits. Once the first total is formed, it is corroborated with selective bottom-up approximations such as sampled brand and private label price points, observed pack size ranges, and supplier and channel checks on volumes moving through modern trade and online.
A few inputs that matter in this market include average pack size and multipack mix, protein grams per serving trends (which influence pricing), share of shelf-stable versus chilled formats, e-commerce share growth for functional beverages, and region-level fitness and active lifestyle participation as a demand indicator. Where a clean volume signal is missing for smaller channels, we apply conservative proxy ratios tied to nearby channels and validate those ratios in follow-up calls. For forecasting, scenario analysis is used around pricing and mix shifts, and it is supported by simple regression checks using variables like real income direction, health and fitness participation, and category premiumization discussed by experts, before the final outlook is locked.
Data Validation & Update Cycle
Validation is done in steps so errors do not get carried into the final dataset. We compare outputs against independent signals such as pricing ranges seen in retail, channel mix expectations shared by distributors, and whether regional growth lines up with observed product launches and packaging shifts. If a variance looks large, the assumptions are reopened, and the relevant interview notes are rechecked. When needed, respondents are re-contacted.
Before sign-off, a second analyst reviews the model logic, inputs, and year-over-year movements to ensure they make sense for the category. The report is refreshed annually, and interim updates are added when major events change costs, pricing, or demand behavior. Right before delivery, a fresh review pass is completed so clients receive the latest updated view.
Mordor Intelligence's Ready to Drink Protein Beverages Market Size Measured Against Other Published Estimates
Published market sizes for ready-to-drink protein beverages can look different even when the topic name sounds the same, since the counted products, the price basis, and the years used for comparison do not always match. Differences also come from how firms treat private label, whether they use retail value or manufacturer value, and how often pricing and mix assumptions are refreshed.
By tracking pack-size normalization, channel-level price ladders, and regional penetration rates, Mordor Intelligence keeps the total tied to RTD protein drinks only, while some estimates appear to widen the scope to adjacent nutrition beverages or apply broader functional beverage pricing without confirming protein-specific mix changes.
Benchmark comparison
| Source | Market Size | Gaps in Research Methodology |
|---|---|---|
| Mordor Intelligence | USD 2.11 B (2026) | |
| Global Consultancy A | USD 2.13 B (2025) | Uses a different base year and may rely on retail value reporting, which can lift totals when retailer margins and promo intensity are included rather than manufacturer-level value. |
| Industry Publisher B | USD 1.73 B (2024) | Earlier base year and a narrower counted set in some regions, with limited visibility on how chilled versus shelf-stable formats and online pricing are treated, which can reduce the stated value. |
Looking at the table, most of the spread is explained by timing and which layer of the value chain is being counted, followed by how scope boundaries are drawn around protein-first RTD drinks. When the same year and value basis are aligned and the mix assumptions are checked through channel data, the market total becomes easier to reproduce and compare across regions.
Key Questions Answered in the Report
How large is the Ready to Drink Protein Beverages market in 2026 and what growth is expected by 2031?
Value reached USD 2.11 billion in 2026 and is projected to hit USD 3.06 billion by 2031, reflecting a 7.70% CAGR driven by health and convenience trends.
Which region buys the most ready-to-drink protein beverages today?
North America leads with 38.40% of global revenue thanks to entrenched fitness culture and premium acceptance.
Which protein source is expanding fastest?
Plant-based beverages, especially those using pea protein, are forecast to grow at an 8.33% CAGR between 2026-2031.
How are online platforms influencing category sales?
Online retail shows a 9.85% CAGR as subscriptions and direct-to-consumer models boost repeat purchases and data-driven personalization.