
Rare Disease Treatment Market Size and Share
Market Overview
| Study Period | 2020 - 2031 |
|---|---|
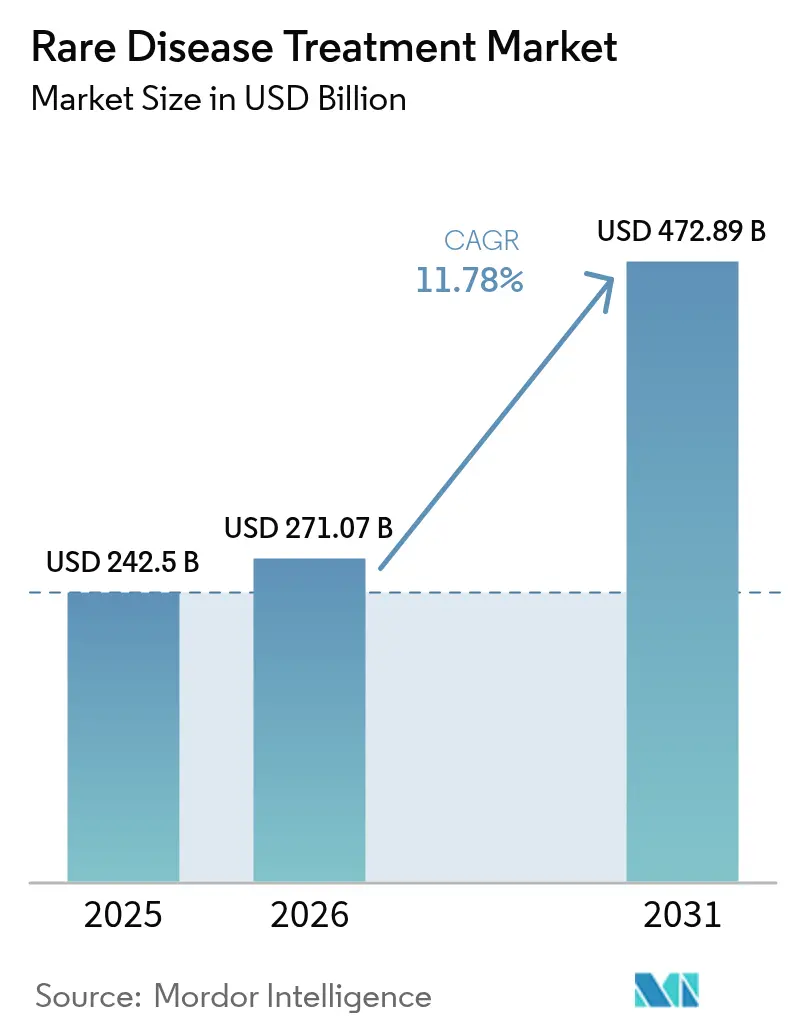
| Market Size (2026) | USD 271.07 Billion |
| Market Size (2031) | USD 472.89 Billion |
| Growth Rate (2026 - 2031) | 11.78 % |
| Fastest Growing Market | Asia-Pacific |
| Largest Market | North America |
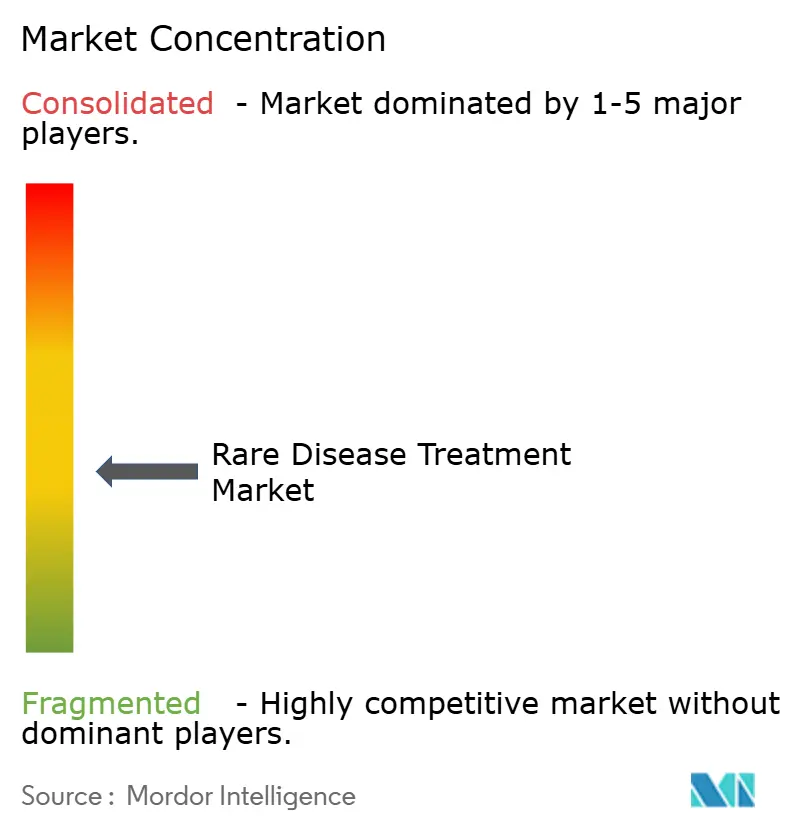
| Market Concentration | Medium |
Major Players *Disclaimer: Major Players sorted in no particular order Image © Mordor Intelligence. Reuse requires attribution under CC BY 4.0. | |
Rare Disease Treatment Market Analysis by Mordor Intelligence
The Rare Disease Treatment market size is expected to grow from USD 242.5 billion in 2025 to USD 271.07 billion in 2026 and is forecast to reach USD 472.89 billion by 2031 at 11.8% CAGR over 2026-2031.
Sustained global incentives, rapid maturation of gene therapy, and payer acceptance of high-value breakthroughs underpin this rise, even though patient pools remain small. Mergers between multinational pharmaceutical groups and specialist innovators intensify competitive positioning, while distributed manufacturing pilots begin easing viral-vector supply constraints. Asia-Pacific’s expanded rare-disease lists and accelerated review pathways complement North American leadership, broadening geographic reach. Neurological gene-therapy launches highlight the shift toward curative modalities, and oral biologic delivery technologies extend convenience for chronic orphan indications. The combined force of regulatory confidence and technological progress secures long-term market momentum.
Key Report Takeaways
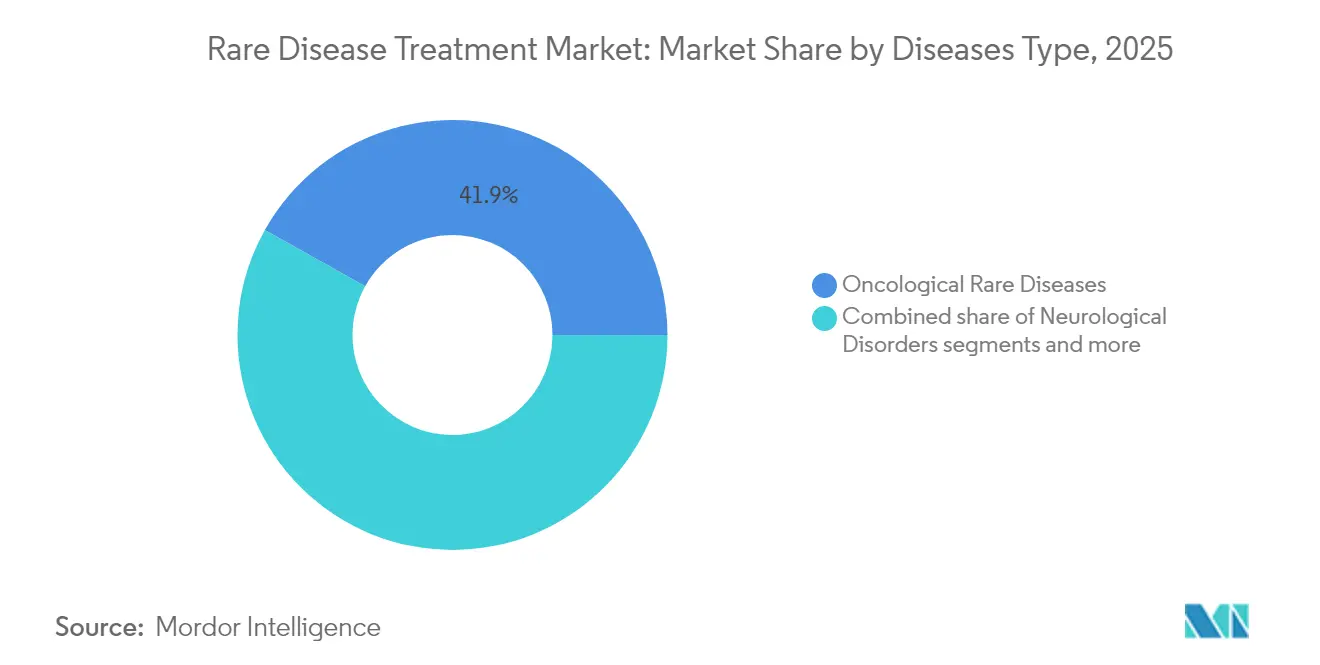
- By disease type, oncological rare diseases held 41.89% of the rare disease treatment market share in 2025; neurological disorders are forecast to expand at a 12.62% CAGR through 2031.
- By therapy type, biologics and monoclonal antibodies accounted for 50.74% of the market size for rare disease treatments in 2025. In contrast, gene and cell therapies are projected to advance at a 12.88% CAGR from 2025 to 2031.
- By route of administration, parenteral products accounted for 60.63% of the revenue in 2025, while oral formulations are expected to grow at a 13.05% CAGR between 2026 and 2031.
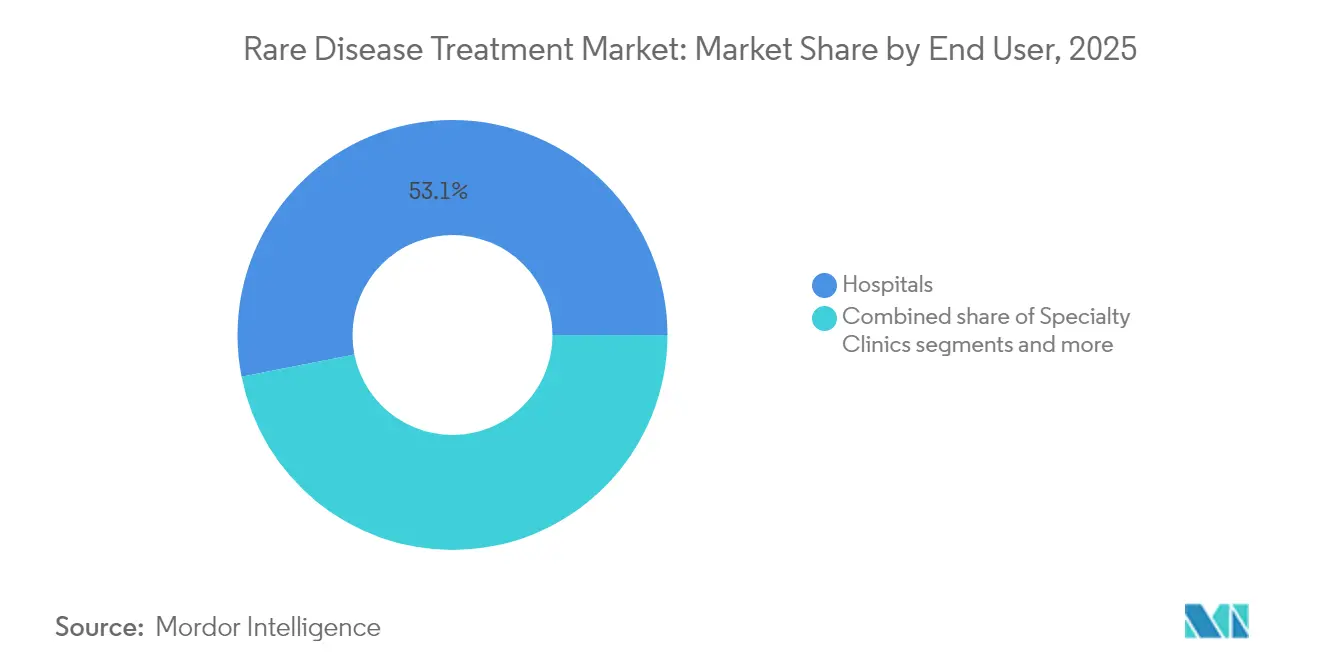
- By end user, hospitals captured 53.11% of the rare disease treatment market size in 2025; home-care settings registered the fastest 13.12% CAGR for the forecast period.
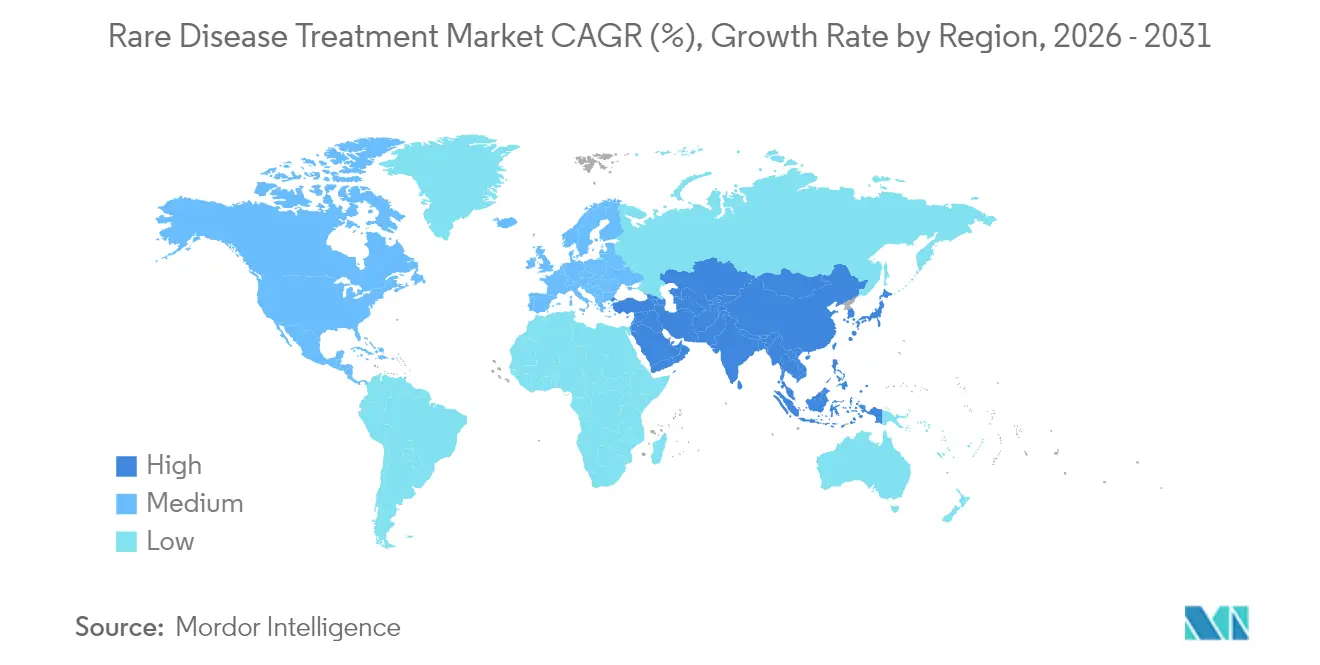
- Regionally, North America controlled 41.86% rare disease treatment market share in 2025, and Asia-Pacific is on course for a 13.29% CAGR to 2031.
Note: Market size and forecast figures in this report are generated using Mordor Intelligence’s proprietary estimation framework, updated with the latest available data and insights as of 2026.
Market Trends and Insights
Drivers Impact Analysis of Rare Disease Treatment Market*
| Driver | (~) % Impact on CAGR Forecast | Geographic Relevance | Impact Timeline |
|---|---|---|---|
| Government incentives & global orphan-drug exclusivity | +2.8% | Global, with strongest impact in North America & EU | Long term (≥ 4 years) |
| Growing FDA/EMA orphan-drug approvals pipeline | +2.1% | North America & EU core, spill-over to APAC | Medium term (2-4 years) |
| Premium pricing & favourable reimbursement frameworks | +1.9% | North America & EU, emerging in APAC | Medium term (2-4 years) |
| Rapid advances in gene & cell therapies | +2.4% | Global, with early gains in North America, EU, Japan | Long term (≥ 4 years) |
| Distributed manufacturing for personalised gene therapy | +0.8% | North America & EU, pilot programs in APAC | Long term (≥ 4 years) |
| AI-enabled virtual trials for ultra-rare cohorts | +1.2% | Global, with early adoption in North America & EU | Medium term (2-4 years) |
| Source: Mordor Intelligence | |||
Government Incentives & Global Orphan-Drug Exclusivity
Extended exclusivity and tax credits continue to underwrite innovation within the rare disease treatment market. In the United States, seven-year exclusivity and 25% clinical trial tax credits lower net risk, while the European Union grants 10-year protection that can extend to 12 years for pediatric compliance. Priority Review Vouchers worth roughly USD 150 million add further return potential, as shown by the sale following DAYBUE approval for Rett syndrome. Such incentives help translate basic-science breakthroughs into commercially viable therapies.
Growing FDA/EMA Rare-Disease Approvals Pipeline
Regulators have embraced expedited mechanisms. The FDA cleared multiple gene therapies in 2024, including Kebilidi for aromatic L-amino acid decarboxylase deficiency. The EMA granted 17 orphan designations in 2023, demonstrating a steady flow of candidates. Together with the FDA START pilot and EMA PRIME schemes, these frameworks reduce review uncertainty and accelerate launches, fuelling market expansion.
Premium Pricing & Favourable Reimbursement Frameworks
Annual therapy costs often top USD 500,000, yet payers endorse high-value medicines that demonstrate durable clinical benefit. Lenmeldy for metachromatic leukodystrophy secured reimbursement even at multi-million-dollar pricing. The U.S. Cell and Gene Therapy Access Model fosters instalment and outcome-based contracts that balance budget pressure with patient access.
Rapid Advances in Gene & Cell Therapies
Seven AAV gene therapies have earned approval to date, validating vector platforms and spurring investment in more than 700 active development programmes. CRISPR-based in-vivo editing offers promise for ultra-rare mutations, illustrated by single-patient protocols that underwent FDA review in 2024.
Restraints Impact Analysis of Rare Disease Treatment Market*
| Restraint | (~) % Impact on CAGR Forecast | Geographic Relevance | Impact Timeline |
|---|---|---|---|
| Limited patient pools for conventional RCTs | -1.4% | Global, most acute in ultra-rare conditions | Medium term (2-4 years) |
| Escalating payor push-back on six-figure price tags | -2.1% | North America & EU, emerging in APAC | Short term (≤ 2 years) |
| Viral-vector manufacturing bottlenecks | -1.7% | Global, most severe in North America & EU | Medium term (2-4 years) |
| Post-gene-therapy long-term safety liabilities | -0.9% | Global, regulatory focus in North America & EU | Long term (≥ 4 years) |
| Source: Mordor Intelligence | |||
Limited Patient Pools for Conventional RCTs
Ultra-rare conditions can involve only hundreds of patients worldwide, making standard randomised trials extremely difficult. Adaptive and basket designs help, but more than 50% of rare-disease studies still fail to publish results due to recruitment gaps.
Escalating Payor Push-Back on Six-Figure Price Tags
US legislation such as the Inflation Reduction Act has reduced the likelihood of companies seeking additional indications once exclusivity declines, reflecting concern over future pricing negotiation. The most recent data shows that Medicare Part D specialty drug spending (which includes many orphan drugs) increased by 43% from early 2024 to early 2025, with costs rising from approximately USD 1,200 to USD 1,700 per member per month for non-low income beneficiaries.
*Our forecasts treat driver/restraint impacts as directional, not additive. The impact forecasts reflect baseline growth, mix effects, and variable interactions.
Rare Disease Treatment Market Segment Analysis
By Disease Type:
Oncological Rare Diseases Lead but Neurological Disorders AccelerateOncological rare diseases captured 41.89% of the rare disease treatment market share in 2025, underscoring their revenue dominance within the overall rare disease treatment market. This leadership reflects the high clinical unmet need and premium pricing associated with niche cancer therapeutics, particularly hematologic malignancies that benefit from targeted biologics and immunotherapies. The rare disease treatment market size for oncological indications is projected to maintain mid-single-digit growth as additional precision drugs secure approvals and expand addressable sub-cohorts. Neurological disorders, by contrast, are forecast to grow at a 12.62% CAGR through 2031, propelled by gene therapies such as Lenmeldy and Kebilidi that penetrate the blood–brain barrier and deliver potentially curative benefits . Regulatory pilots that shorten review timelines for neurodegenerative indications add further momentum.
Growth outside these two pillars remains steady yet meaningful. Metabolic disorders continue to rely on enzyme replacement and emerging gene-editing modalities that broaden lifetime treatment options. In contrast, immunological disorders absorb advances in monoclonal antibodies and engineered T-cell platforms. Infectious-disease applications, although smaller in value, attract interest for antimicrobial-resistance niches where orphan incentives offset limited volumes. Pipeline analysis shows roughly 18% of phase III assets now target neurological diseases, signaling sustained capital reallocation toward high-growth categories. Overall, disease-type diversification reduces portfolio risk for manufacturers and helps the rare disease treatment market achieve balanced long-term expansion.

By Therapy Type:
Biologics Retain Scale, Gene and Cell Therapies Drive MomentumBiologics and monoclonal antibodies accounted for 50.74% of 2025 revenue, maintaining their position at the center of the rare disease treatment market size, thanks to their proven efficacy and payer familiarity with chronic infusion models. Even so, gene and cell therapies are outpacing every other modality at a 12.88% CAGR, driven by a pipeline exceeding 700 active clinical programmes that target both well-characterised and ultra-rare mutations. Recent approvals across neurologic and hematologic categories validate adeno-associated virus vectors and encourage investment in next-generation capsids with enhanced tissue tropism.
The competitive interplay among modalities is widening. Small-molecule drugs preserve niche relevance for metabolic pathways and allosteric enzyme modulation, offering convenience and lower manufacturing complexity. RNA-based interventions, particularly siRNA agents, continue to face adoption challenges despite broader coverage, because annual treatment costs range from USD 375,000 for first-generation options, such as patisiran (ONPATTRO), to more than USD 1.6 million for newer, highly specialized siRNA therapies. Vutrisiran (Amvuttra), administered quarterly, reduces the administration burden and related healthcare utilization, giving it a potential cost-effectiveness edge over patisiran without compromising clinical benefit. Enzyme-replacement therapies remain central for lysosomal storage diseases; however, long-term switching studies suggest a gradual shift toward single-administration gene transfers. Collectively, these dynamics transform the therapeutic mix and heighten innovation pressure on incumbent biologics franchises within the rare disease treatment market.
By Route of Administration:
Parenteral Stronghold Faces Oral and Subcutaneous PushParenteral delivery retained 60.63% of 2025 revenue, reflecting the bioavailability needs of biologics, gene therapies, and high-molecular-weight enzymes. Hospital-based infusions dominate the initiation of gene therapy, while subcutaneous formats are gaining popularity for chronic antibody regimens. Nonetheless, oral formulations are projected to expand at a 13.05% CAGR to 2031, driven by permeation enhancers such as SNAC, which enable peptides and small proteins to survive gastrointestinal transit. These innovations provide precise adherence and quality-of-life benefits for long-term treatment courses.
Technology breakthroughs are expanding delivery options even further. Transmucosal routes and implantable depots are under active investigation for ultra-rare metabolic conditions requiring steady pharmacokinetic profiles. Post-marketing preference surveys indicate 82% of immunology and hematology patients would switch from hospital infusions to at-home subcutaneous administration if efficacy and safety were equivalent. As device design improves and stability data mature, parenteral exclusivity is expected to soften, enabling more patient-centric regimens that reinforce uptake across the rare disease treatment market.
By End User:
Hospital Leadership Gives Way to Decentralised CareHospitals generated 53.11% of the rare disease treatment market revenue in 2025, as complex gene-therapy infusions and first-dose monitoring require specialized infrastructure. Yet home-care settings are forecast to grow at a 13.12% CAGR, supported by payer initiatives that encourage decentralised infusion nursing and digital adherence oversight. Cost studies on enzyme-replacement therapy for lysosomal storage diseases show parity between in-hospital and in-home delivery, eroding economic arguments for centralisation.
Specialty clinics and academic centres preserve a critical role in diagnostics, eligibility confirmation, and adverse-event adjudication, particularly for first-in-class modalities. Telehealth follow-up and remote lab collection further simplify long-term management, aligning with broader post-pandemic trends. Supply-chain providers are developing turnkey home-infusion capabilities to support the increasing demand for subcutaneous formulations. As these service ecosystems scale, patient autonomy rises, and hospitals transition toward high-acuity gene-therapy administration, collectively reshaping utilisation patterns within the rare disease treatment market.
Geography Analysis
North America and Europe Rare Disease Treatment Market
North America accounted for 41.86% of rare disease treatment market share in 2025, reflecting the combination of FDA fast-track pathways, wide commercial insurance coverage, and strong academic research networks. Average launch timelines for orphan assets are two to three years shorter than in any other region, giving the United States an enduring first-mover advantage. Canada mirrors this momentum through its Priority Review program, although provincial budget caps delay uniform access by six to nine months. Europe follows closely; the EMA granted 17 new orphan designations in 2023, underscoring a robust centralised review process that cuts duplicative national filings. Nonetheless, disparate reimbursement rules mean Central and Eastern European countries cover fewer than half of approved therapies, creating a two-tier access environment.
APAC, LATAM and MEA Rare Disease Treatment Market
Asia-Pacific is poised for the fastest 13.29% CAGR through 2031, driven chiefly by China’s regulatory reforms that expanded the National Rare Diseases List from 121 to 207 conditions. The NMPA CARE scheme compresses review cycles to 130 working days for qualifying drugs, yet only 38% of FDA-cleared orphan therapies later gain Chinese approval, signalling ongoing localisation hurdles. Japan sustains leadership in ultra-rare neuromuscular indications; its 2024 approval of aceneuramic acid for GNE myopathy illustrates the value of targeted subsidy programs.South Korea and Singapore roll out tax credits and clinical-trial infrastructure grants that attract multinational studies, although small domestic populations still limit revenue upside. Collectively, growing diagnostic capacity, newborn screening expansion, and rising household income underpin the long-run contribution of Asia-Pacific to rare disease treatment market size. Latin America, the Middle East, and Africa represent nascent yet strategic frontiers with single-digit current penetration. Brazil’s Health Surveillance Agency grants up to eight years of exclusivity for priority orphan drugs, but reimbursement remains case-by-case, creating unpredictable uptake. Saudi Arabia established a Rare Disease Registry in 2024, setting the stage for future market entry once local pharmacoeconomic guidelines mature.Multilateral organisations are piloting pooled procurement models to ease affordability barriers, though currency volatility and supply-chain gaps continue to restrain growth.
Regulatory Landscape
Rare disease treatment regulation is increasingly shaped by orphan-drug incentives and expedited review frameworks across major agencies. In the United States, FDA orphan-drug pathways and expedited programs support a high share of novel approvals receiving orphan designation (23 of 46 novel drugs in 2025), and recent rare-disease specific initiatives continue to formalize how evidence is generated when randomized trials are infeasible for ultra-rare cohorts.
In 2026, the FDA issued draft guidance aimed at accelerating development of individualized therapies for ultra-rare diseases, signaling wider acceptance of non-traditional evidence packages for approvals and label expansion. In Europe, a political agreement reached in December 2025 on reform of EU pharmaceutical legislation includes updates to orphan medicinal product rules, with implementation scheduled to begin in 2026 and a transition period through 2028. This is likely to create a more modulated incentive environment that can affect exclusivity planning and launch sequencing across EU Member States.
Value Chain Analysis
The rare disease treatment value chain runs from discovery and translational research through clinical development built around small patient cohorts, CMC development, and specialized manufacturing (including viral vectors, plasmids, and cell processing for advanced therapies). Because volumes are low and processes can be bespoke, programs often rely on single-source suppliers for critical inputs such as plasmids for gene therapy, making supply continuity and release testing throughput key constraints.
Downstream, distribution and access execution adds operational friction due to payer controls, data requirements for outcomes-based arrangements, and jurisdictional compliance, including evolving US state-level rules that can affect limited distribution networks. As regulators push earlier CMC readiness and developers pursue decentralized care models, manufacturers and CDMOs are aligning process validation, cold-chain logistics, and patient services to reduce time-to-therapy while maintaining chain-of-identity and chain-of-custody for personalized modalities.
Competitive Landscape
The rare disease treatment market features prominent players like Pfizer, AstraZeneca, Novartis, Bristol-Myers Squibb, and Bayer AG, leading innovation and development. These companies are increasingly focusing on breakthrough therapies and biologics for treating rare genetic disorders, leveraging advanced research capabilities and extensive clinical trial networks. Strategic collaborations with research institutions and smaller biotech firms have become commonplace to accelerate drug development timelines and expand therapeutic portfolios. Companies are also investing heavily in gene therapy platforms and precision medicine approaches while simultaneously working to improve patient access through specialized distribution networks. The industry has seen a marked shift toward patient-centric development strategies, with companies establishing dedicated rare disease units and implementing comprehensive support programs for affected populations. Notably, orphan drug companies are playing a crucial role in this transformation, driving forward the development of orphan medicines to address unmet medical needs.
Rare Disease Treatment Industry Leaders
-
Amgen Inc.
-
Biomarin Pharmaceuticals
-
Bayer AG
-
Bristol-Myers Squibb Company
-
AstraZeneca (Alexion Pharmaceuticals Inc.)
- *Disclaimer: Major Players sorted in no particular order
Rare Disease Treatment Market Companies Covered in this Report
- Novartis
- Johnson & Johnson
- Roche
- AstraZeneca plc (Alexion)
- Amgen
- Pfizer
- Takeda Pharmaceutical Co.
- Sanofi
- Bristol-Myers Squibb
- Vertex Pharmaceuticals
- BioMarin Pharmaceutical
- CSL Behring
- Ultragenyx Pharmaceutical
- Regeneron Pharmaceuticals
- Bluebird bio
- Sarepta Therapeutics
- Horizon Therapeutics
- Genzyme (Sanofi)
- PTC Therapeutics
Market Opportunities and Future Outlook
Regulatory modernization for ultra-rare development is creating practical whitespace for individualized and very small-cohort programs. The FDA issued draft guidance in 2026 to accelerate development of individualized therapies for ultra-rare diseases where randomized trials are not feasible, complementing agency efforts such as Rare Disease Evidence Principles introduced in September 2025. Together, these steps support evidence strategies for indications with extremely limited patient pools.
Manufacturing and supply resilience is also a visible opportunity as the market shifts toward higher-complexity modalities. Capacity investments and long-term manufacturing agreements point to active build-out: Kedrion Biopharma announced a EUR 150 million expansion program in Italy to triple plasma processing capacity to 3.3 million liters annually by 2031, and large-scale footprint expansion continues among major biopharma, including AstraZeneca's announced USD 2 billion Maryland manufacturing investment (November 2025) covering production capacity for its rare disease portfolio. In advanced therapies, commercial supply partnerships and capacity extensions, including Minaris and Genetix Biotherapeutics for LYFGENIA and Lonza and Genetix Biotherapeutics for ZYNTEGLO, reflect ongoing demand for scalable CGT manufacturing. This reinforces opportunities for developers, CDMOs, and enabling technology suppliers focused on reducing batch variability and turnaround times.
Recent Industry Developments in Rare Disease Treatment Market
- July 2026: BioMarin reported that the US FDA accepted its supplemental NDA seeking full approval of VOXZOGO (vosoritide) for children with achondroplasia, with a PDUFA target action date of February 28, 2027. The filing supports a shift from accelerated to full approval positioning, reinforcing lifecycle management in skeletal dysplasia where long-term evidence packages are central to access and prescribing confidence.
- April 2026: BioMarin completed its USD 4.8 billion acquisition of Amicus Therapeutics, adding Galafold (Fabry disease) and Pombiliti + Opfolda (Pompe disease) to its commercial portfolio. The combination broadens BioMarin's rare disease footprint across lysosomal storage disorders and strengthens its scale in specialty distribution, patient services, and global market access execution.
- December 2025: Amgen announced US FDA approval of UPLIZNA (inebilizumab-cdon) for adults with generalized myasthenia gravis. This label expansion extends a marketed biologic into another rare autoimmune neurology indication, increasing competitive intensity in specialty immunology and reinforcing the role of large pharma commercialization capabilities in orphan categories.
Rare Disease Treatment Market Report Scope and Research Methodology
Market Definition and Coverage
This market is defined as revenues earned from therapies used to treat rare diseases, counted at the manufacturer level and tracked across major regions for the study period.
Scope exclusions: We exclude diagnostics, screening programs, and pure research tools that do not generate treatment revenues.
Segments Covered in This Report
- By Disease Type
- Oncological Rare Diseases
- Neurological Disorders
- Metabolic Disorders
- Hematologic Disorders
- Immunological Disorders
- Infectious Diseases
- Others
- By Therapy Type
- Small-Molecule Drugs
- Biologics & Monoclonal Antibodies
- Gene & Cell Therapy
- RNA-based Therapy
- Enzyme Replacement Therapy
- Others
- By Route of Administration
- Oral
- Parenteral
- Others
- By End User
- Hospitals
- Specialty Clinics
- Home-Care Settings
- Research & Academic Institutes
- By Geography
- North America
- United States
- Canada
- Mexico
- Europe
- Germany
- United Kingdom
- France
- Italy
- Spain
- Rest of Europe
- Asia-Pacific
- China
- India
- Japan
- South Korea
- Australia
- Rest of Asia-Pacific
- South America
- Brazil
- Argentina
- Rest of South America
- Middle East and Africa
- GCC
- South Africa
- Rest of Middle East and Africa
- North America
Data Sources, Market Sizing, and Validation
Desk Research
Desk research was used to set the market boundary and build the first pass of demand and pricing assumptions. We reviewed public sources such as FDA orphan drug designation and approval listings, the NIH Genetic and Rare Diseases Information Center, and the EMA community register for orphan medicines to understand which treatments are actively marketed.
To support volume and access assumptions, we also leaned on sources such as the CDC for epidemiology context, OECD health statistics for spending and utilization signals, and peer reviewed clinical and health economics literature for treatment patterns and persistence. Company annual reports, investor presentations, and reputable press coverage were used to validate launch timing, geographic expansion, and the direction of pricing. Where needed, a paid subscription database for company financials, a patent database, and a news and financials platform were used to cross check product level signals and avoid missed events. These sources are illustrative rather than exhaustive, and many other public and subscription sources were also referenced for data collection, validation, and research clarification.
Primary Interviews and Surveys
Primary work focused on confirming treatment uptake and real world pricing behavior across regions, since rare disease markets can shift quickly after label expansions and reimbursement decisions. We spoke with a mix of manufacturers, distributors, payers, clinicians in specialty centers, and patient advocacy linked experts across APAC, EMEA, and the Americas to pressure test assumptions and close gaps left by public data.
Distribution of primary research fieldwork respondents
| Company type | Respondent position | Region |
|---|---|---|
| Top tier: 39% | CXOs: 18% | APAC: 43% |
| Mid tier: 43% | Functional/Unit leaders: 35% | EMEA: 33% |
| Smaller Players: 18% | Managers: 47% | Americas: 24% |
Market-Sizing & Forecasting
The core sizing logic starts from a top-down build that reconstructs the treated demand pool using rare disease prevalence, diagnosis rates, and therapy eligibility, which is then translated into value using therapy mix and pricing. Results were corroborated with selective bottom-up approximations, such as sampled brand level revenue roll ups from public filings, channel checks on launch timing, and volume proxies where treatment cycles are well described.
Key model inputs included (illustrative) orphan designation and approval counts by year, the pace of new launches and label expansions, patient identification and referral trends in specialty centers, therapy duration and adherence patterns, and net price movement after rebates and access restrictions. Where data was thin for smaller indications, we applied conservative uptake curves anchored to analogous therapies, then rechecked the implied per patient spending with interview feedback.
Forecasting relied mainly on scenario analysis, because single events (a trial success, a safety warning, or a reimbursement shift) can change the trajectory fast. Assumptions for launch cadence, uptake speed, and net price progression were reviewed with primary respondents and adjusted by region to reflect different payer behavior and time to access.
Data Validation & Update Cycle
We validate outputs by comparing implied patient counts, therapy mix, and per patient spending against independent signals, then investigating any jumps that do not match observed approval, access, or epidemiology patterns. When a variance is material, analysts revisit the assumptions, recheck the desk sources, and recontact relevant experts to confirm whether the change is real or an artifact of timing.
A multi step review is used before sign off, including peer checks on the market boundary, unit logic, and currency conversion consistency. Reports are refreshed annually, with interim updates triggered by material approvals, withdrawals, major label expansions, and notable pricing or reimbursement decisions. Before delivery, a final pass is completed so clients receive the latest updated view.
Mordor Intelligence's Rare Disease Treatment Market Size Compared Against Other Published Estimates
Published market sizes for rare disease treatment can look far apart, even when they use similar sounding titles, because underlying timing and price handling are not always aligned. Differences usually come from how the current year is selected, how list price is converted into net price, and whether one time launches are treated as a step change or smoothed over.
When the model is refreshed, currency timing is normalized and net price assumptions are rechecked around major reimbursement decisions and label expansions, and those validation checks help explain why the value reported by Mordor Intelligence can differ from estimates that carry forward older price points or use list price proxies.
Benchmark comparison
| Source | Market Size | Gaps in Research Methodology |
|---|---|---|
| Mordor Intelligence | USD 271.07 B (2026) | |
| Trade Journal A | USD 220.00 B (2025) | Uses a drugs only frame with limited clarity on net pricing adjustments, and the base year sits earlier, which can undercount the impact of recent launches and label expansions. |
| Industry Portal B | USD 187.30 B (2025) | Applies a longer horizon projection with high level assumptions, and may not fully align currency timing or regional access lags, which can compress the near term market value. |
The spread in the table mainly reflects year selection, price treatment (list versus net), and whether therapy mix is updated after key access events. By keeping the model traceable to treated patient pools, therapy mix, and region specific access timing, the resulting value is easier to reproduce and stress test when conditions change.
Key Questions Answered in the Report
What is the current rare disease treatment market size?
The rare disease treatment market size is USD 271.07 billion in 2026 and is expected to reach USD 472.89 billion by 2031.
Which therapeutic area is growing fastest within the rare disease treatment market?
Neurological disorders are forecast to grow at a 12.62% CAGR through 2031, driven by breakthrough gene therapies.
Why do rare-disease treatments command premium prices?
Limited patient pools and extensive development costs, combined with exclusivity incentives and demonstrated clinical impact, sustain prices often exceeding USD 500,000 per year.
Which region is projected to grow most rapidly?
Asia-Pacific is projected to expand at a 13.29% CAGR to 2031 due to regulatory reforms and broadened rare-disease registries.