
Rapid Prototyping Materials Market Size and Share
Market Overview
| Study Period | 2020 - 2031 |
|---|---|
| Market Size (2026) | USD 6.44 Billion |
| Market Size (2031) | USD 9.53 Billion |
| Growth Rate (2026 - 2031) | 8.15 % |
| Fastest Growing Market | Asia Pacific |
| Largest Market | North America |
| Market Concentration | High |
Major Players *Disclaimer: Major Players sorted in no particular order Image © Mordor Intelligence. Reuse requires attribution under CC BY 4.0. | |
Rapid Prototyping Materials Market Analysis by Mordor Intelligence
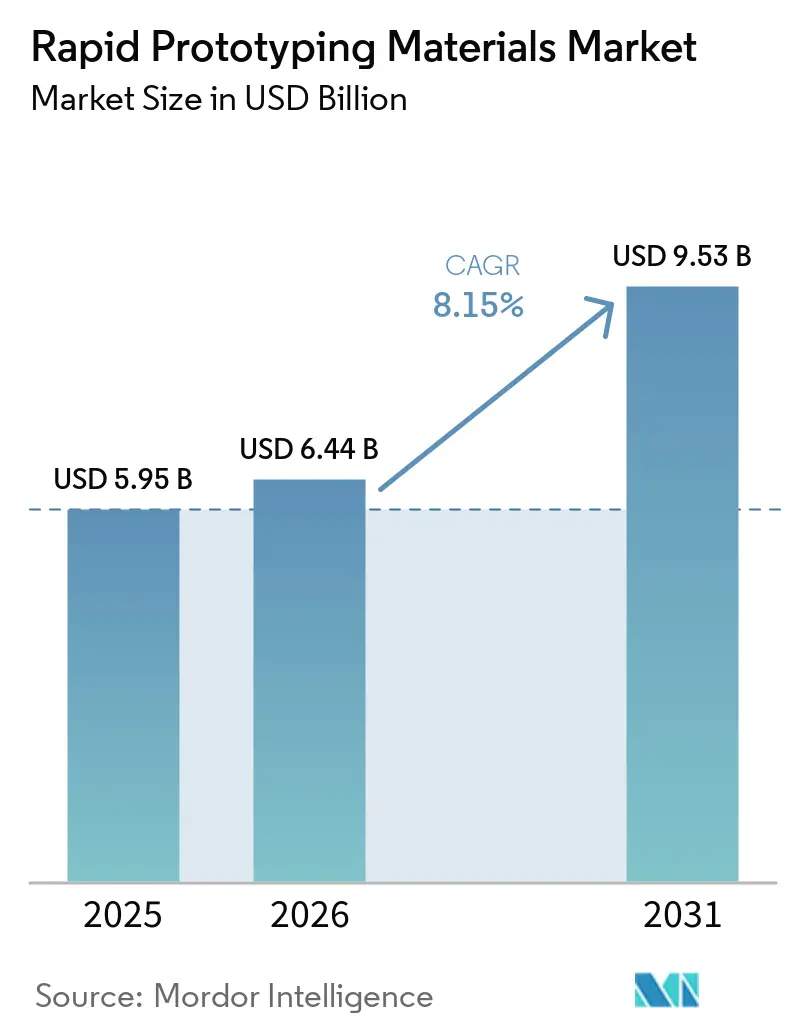
The Rapid Prototyping Materials market size is expected to grow from USD 5.95 billion in 2025 to USD 6.44 billion in 2026 and is forecast to reach USD 9.53 billion by 2031 at 8.15% CAGR over 2026-2031. This momentum is propelled by the steady shift from subtractive to additive workflows, allowing manufacturers to shorten design-to-launch cycles, minimize material waste, and customize parts at scale. Sustainability regulations are simultaneously driving demand for bio-based polymers; more than 60 BASF products now carry ISCC+ certification. Metals and alloys are gaining traction in aerospace, where ceramic-matrix‐composite-reinforced parts withstand temperatures up to 1,300 °C and slash component weight. Regionally, North America leverages strong aerospace and defense budgets to command headline share, while Asia Pacific accelerates through China’s rapidly scaling additive manufacturing ecosystem.
Key Report Takeaways
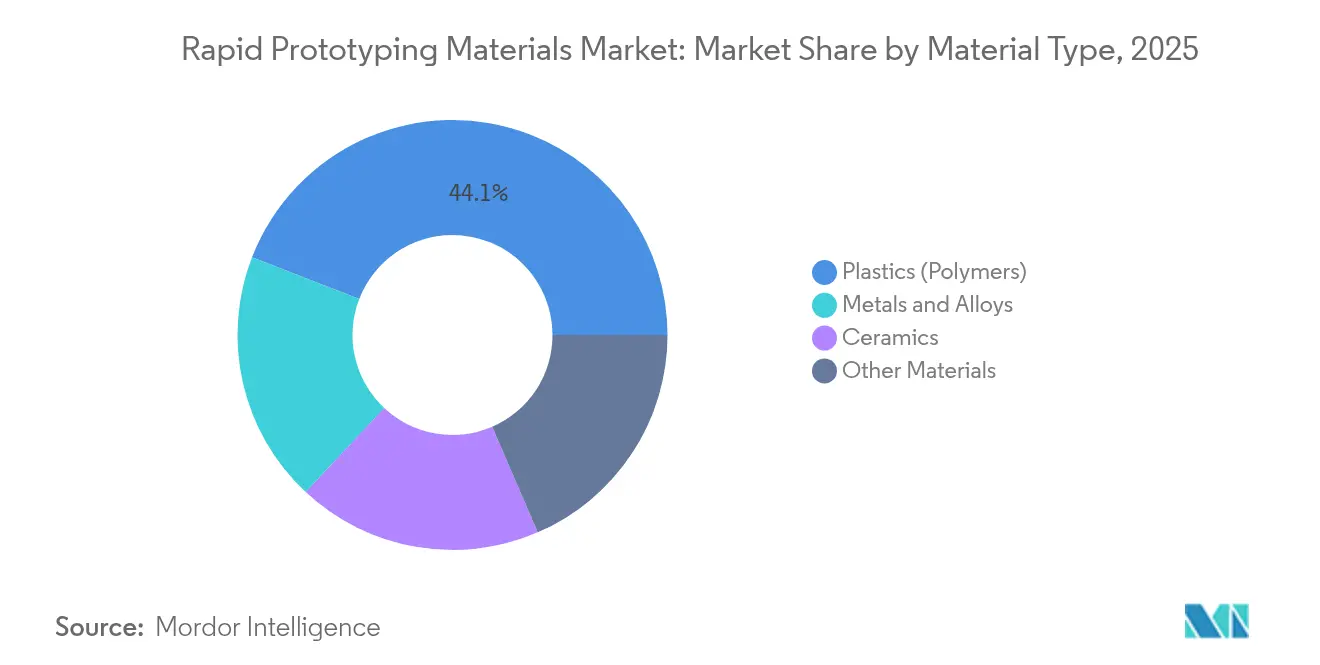
- By material type, plastics held 44.12% of the rapid prototyping materials market share in 2025, whereas metals and alloys are projected to post the fastest 10.03% CAGR through 2031.
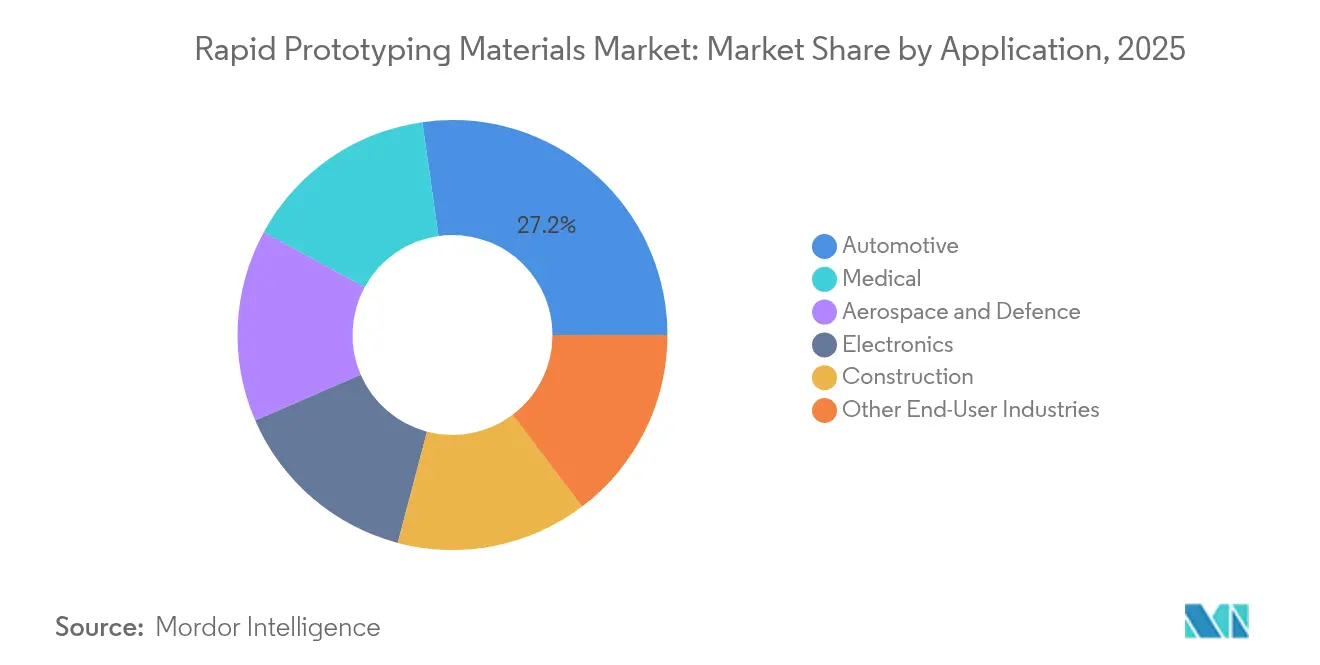
- By end-user industry, the automotive sector accounted for 27.24% revenue share in 2025, while medical applications are advancing at the highest 10.55% CAGR to 2031.
- By geography, North America led with 31.21% of the rapid prototyping materials market in 2025; Asia Pacific is forecast to grow at a 10.31% CAGR through 2031.
Note: Market size and forecast figures in this report are generated using Mordor Intelligence’s proprietary estimation framework, updated with the latest available data and insights as of 2026.
Global Rapid Prototyping Materials Market Trends and Insights
Drivers Impact Analysis*
| Drivers | (~) % Impact on CAGR Forecast | Geographic Relevance | Impact Timeline |
|---|---|---|---|
| Expanding adoption of additive manufacturing in aerospace and defense prototyping | +2.1% | North America and Europe, spill-over to APAC | Medium term (2-4 years) |
| Surge in medical implants and anatomical models needing biocompatible materials | +1.8% | Global; early gains in North America, Europe, Japan | Short term (≤ 2 years) |
| Continued decline in polymer and metal powder prices | +1.4% | Global | Short term (≤ 2 years) |
| OEM push for lightweight automotive parts | +1.2% | APAC core; spill-over to North America and Europe | Medium term (2-4 years) |
| Government-funded circular-economy mandates favoring bio-based polymers | +0.9% | Europe and North America; expanding to APAC | Long term (≥ 4 years) |
| Source: Mordor Intelligence | |||
Expanding Adoption of Additive Manufacturing in Aerospace and Defense Prototyping
The aerospace and defense community is accelerating additive uptake to compress design iterations and unlock complex internal geometries. The U.S. Defense Advanced Research Projects Agency (DARPA) initiated its AMME program to localize production of intricate micro-electronic systems and safeguard supply sovereignty. GE’s single-piece 3D-printed LEAP fuel nozzle demonstrated 25% weight reduction and a fivefold durability improvement compared with legacy builds. Ceramic-matrix-composite components able to tolerate 1,300 °C are now integrated in turbine pathways, contributing to higher thermal efficiency and lower emissions. Boeing and Airbus have each expanded in-house printing farms to accommodate flight-certified polymer and metal parts, recognizing that every kilogram shed translates directly into airline operating-cost savings.
Surge in Medical Implants and Anatomical Models Needing Biocompatible Materials
Healthcare facilities are moving toward point-of-care printing of patient-specific devices. In 2025, 3D Systems produced the first MDR-compliant PEEK facial implant directly inside a hospital setting. The solution removes lengthy external machining queues and lets surgeons adjust designs minutes before surgery. Alternative alloys such as tantalum and niobium are being trialed to solve titanium rejection in certain patient sub-groups. Updated FDA guidelines clarify validation routes for additive devices, enabling shorter approval cycles. Evonik has commercialized carbon-fiber-reinforced PEEK filaments promising enhanced load-bearing performance in spinal cages. These developments, alongside progress in scaffold-based tissue engineering, underpin the rapid ascent of personalized medical solutions within the rapid prototyping materials market. Medical applications contribute to demand in the rapid prototyping market beyond specialized materials.
Continued Decline in Polymer and Metal Powder Prices
Falling raw-material prices are democratizing access to additive workflows for small and mid-sized enterprises. Wider recycling of aluminum and steel powders improves throughput and visibility, counterbalancing headline metal price inflation signaled by the World Bank through 2025[1]. Alternative feedstock formats, notably metal wire and injection-molding pellets, deliver 15% to 40% part-cost savings while maintaining printability. Circular-economy pioneers such as Continuum supply recycled superalloys compatible with Desktop Metal binder-jet systems, lowering material costs while meeting aerospace pedigree requirements
OEM Push for Lightweight Automotive Parts
Regulators are extending emissions rules to non-exhaust sources such as brake discs, forcing automakers to re-evaluate every gram in the vehicle chassis. ArcelorMittal’s additive-dedicated steel powders permit lattice‐reinforced brake calipers that outperform cast iron on thermal conductivity while trimming mass. Researchers at the University of Glasgow combined polypropylene and polyethylene matrices with carbon nanotubes to create metamaterials displaying high impact absorption yet low density.
Restraints Impact Analysis*
| Restraints | (~) % Impact on CAGR Forecast | Geographic Relevance | Impact Timeline |
|---|---|---|---|
| Volatility of titanium and high-performance polymer feedstock prices | -1.6% | Global; acute in North America and Europe | Short term (≤ 2 years) |
| Skills gap for large-scale additive manufacturing design and material processing | -1.2% | Global; pronounced in emerging markets | Medium term (2-4 years) |
| Supply bottlenecks of rare-earth alloying elements for advanced metal powders | -0.8% | Global; critical to aerospace and defense | Long term (≥ 4 years) |
| Source: Mordor Intelligence | |||
Volatility of Titanium and High-Performance Polymer Feedstock Prices
Titanium mill prices climbed 4.48% year-over-year to a U.S. PPI of 219.99 in December 2024, straining aerospace procurement budgets[2]. Geopolitical risk, amplified by Russia-Ukraine tensions, constrains sponge supply, while new entrants in the Middle East and North America require multi-year scale-up periods. Manufacturers either stockpile or accept lower margins because qualification cycles for flight- or implant-grade resins preclude rapid material substitution. Volatility thus acts as a drag on capital allocation to greenfield additive lines.
Skills Gap for Large-Scale Additive Manufacturing Design and Material Processing
The additive boom outpaces workforce upskilling. SME documented an 80% rise in metal-printer shipments over 24 months but flagged stagnant operator certification volumes. MIT and Penn State now run full-semester curricula on topology optimization and powder handling, yet graduate output still trails hiring demand. ASTM and EOS co-launched machine-operator certification, but the rapid evolution toward multi-material hybrids forces a continuous learning loop that many firms struggle to maintain. The capability gap hits emerging markets hardest, compelling firms to import expertise and raising project costs.
*Our forecasts treat driver/restraint impacts as directional, not additive. The impact forecasts reflect baseline growth, mix effects, and variable interactions.
Segment Analysis
By Material Type: Polymers Dominate Despite Metal Innovation
Plastics retained 44.12% of the rapid prototyping materials market share in 2025, confirming their versatility and cost advantage over metals. High-temperature grades such as Victrex’s PAEK, engineered for lower refresh rates in powder-bed systems, extend polymer use into under-hood automotive and aerospace ducting applications. Metals and alloys are expanding faster, clocking a 10.03% CAGR as aerospace primes demand fatigue-resistant titanium aluminide and cobalt-chrome implants populate orthopedics.
A parallel trend centers on process innovation. Foundation Alloy’s solid-state metallurgy bypasses melt-pool instabilities and can deliver alloys twice as strong as wrought counterparts while cutting development cycles to months. Such breakthroughs will help metals narrow the cost gap with polymers by reducing post-processing. Polymers, however, are likely to retain the lion’s share because of continual upgrades in UV-curable resins and elastomers. Overall, material diversification enlarges the total rapid prototyping materials market and hedges against feedstock price shocks.

By End-User Industry: Automotive Leads While Medical Accelerates
Automotive OEMs accounted for 27.24% share of the rapid prototyping materials market in 2025, using lattice-filled brackets and air-flow-optimized ducts to shave vehicle mass while meeting Euro 7 particulate caps. ArcelorMittal’s steel-powder family allows thin-wall structures that dissipate braking heat without extra machining steps, scaling additive parts into mid-volume production.
Medical applications, growing at 10.55% annually, are set to eclipse aerospace incremental demand after 2027. More than 80 cranial reconstructions have been conducted using 3D Systems’ EXT 220 MED printer, illustrating clinical confidence. Construction represents an emergent outlet: graphene-infused concrete mixes provide 31% lower embodied carbon while boosting compressive strength, mirroring wider decarbonization imperatives.
Geography Analysis
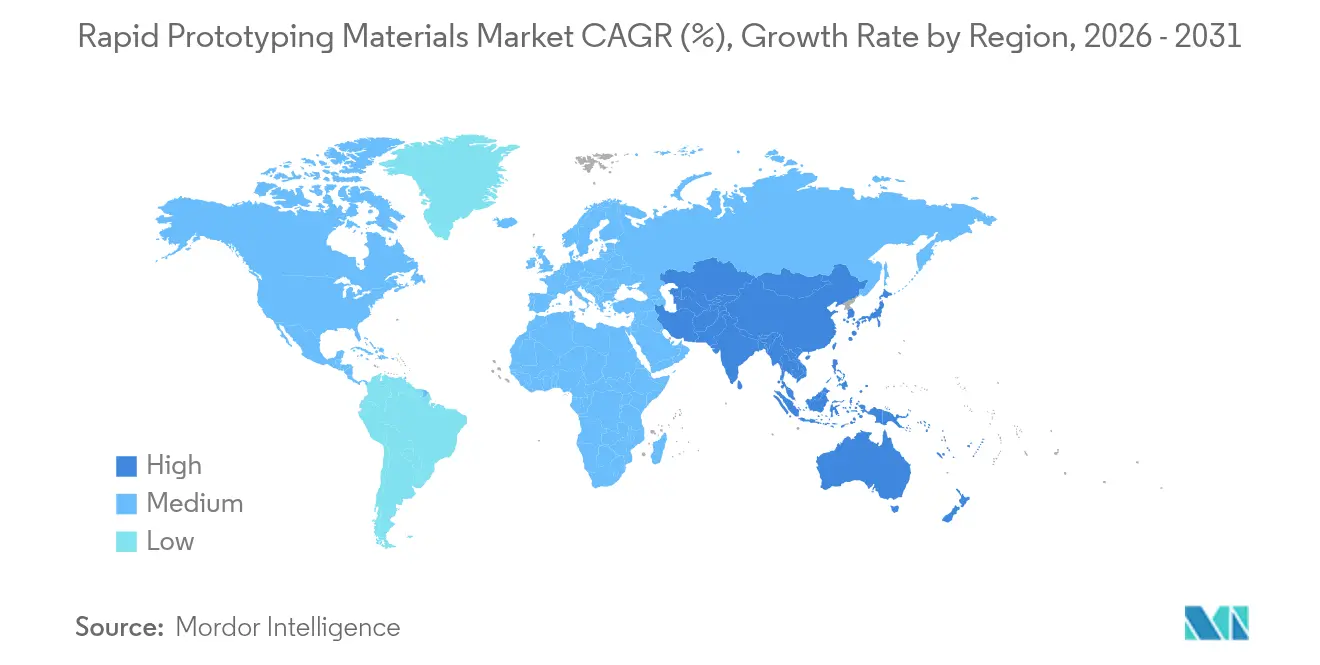
North America held 31.21% of the rapid prototyping materials market in 2025 on the back of robust aerospace and medical infrastructure. DARPA’s cumulative USD 35 billion investment in advanced manufacturing, plus FDA fast-track pathways for additive devices, incentivize commercial scale-up.
Asia Pacific is the fastest grower, clocking a 10.31% CAGR through 2031. India’s iterative prototyping culture within large teaching hospitals drives localized demand for biocompatible polymers. Japan applies additive solutions to miniaturized consumer electronics, while South Korea’s automakers seek lattice-reinforced seat frames.
Europe maintains a competitive position anchored in sustainability-first policy. The EU Raw Materials Foresight Study prioritizes additive manufacturing for strategic autonomy through 2050. Germany’s EOS and SGL Carbon pioneer high-temperature resin and ceramic portfolios; the UK channels aerospace research and development into powder-bed fusion of scalmalloy flight parts.
Value Chain Analysis
Rapid prototyping materials move through a chain that starts with upstream feedstocks (petrochemical monomers and specialty additives for photopolymers and thermoplastics, and mined and refined metals such as titanium, nickel, aluminum, and copper for powders and wires). Midstream conversion includes compounding and resin formulation, or metal feedstock conditioning and powder production (for example, gas or plasma atomization) with tight controls on particle size distribution, oxygen pickup, and trace impurities. Downstream, materials are validated against specific machine-process windows by printer OEMs and service bureaus, then routed through printing and finishing steps such as debinding and sintering (binder jet), hot isostatic pressing (critical aerospace and medical parts), heat treatment, machining, and surface finishing before qualification and end-use shipment.
Bottlenecks in the chain are concentrated more in qualification data availability and compliance documentation than in basic physical availability, particularly for flight- and implant-grade metal powders where traceability and testing requirements are stringent. Activity in 2026 also reflected a stronger shift toward validated material-process pairs and traceable powders, for example EOS partnering with Constellium to offer aluminum alloys with validated laser powder bed fusion parameters, and Sandvik launching Osprey GRCop-42 under an AS9100-certified quality system to support cradle-to-gate traceability for space propulsion components. These moves compress customer validation cycles, while raising the expectations for suppliers on metrology, quality systems, and documented provenance.
Competitive Landscape
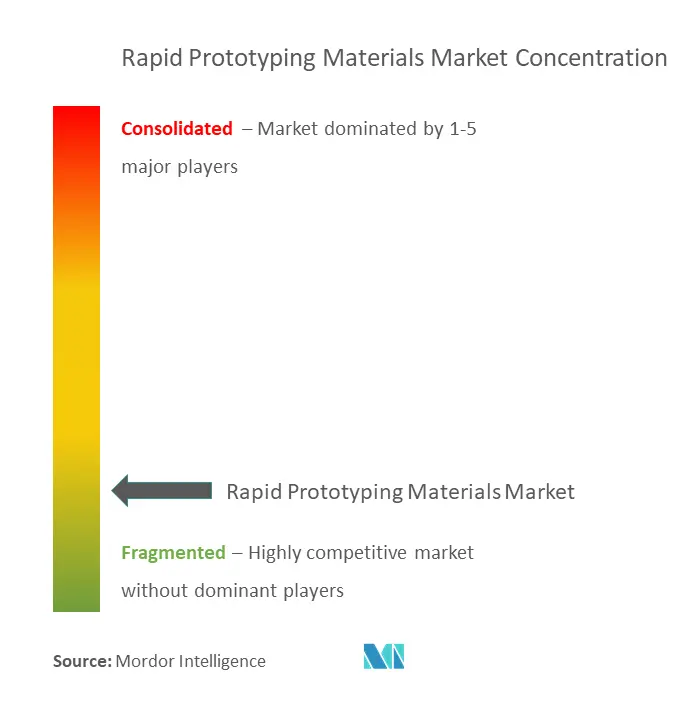
The rapid prototyping materials market is consolidated in nature. Chemical powerhouses BASF, Evonik, and Arkema exploit global logistics and deep polymer chemistries to serve cross-industry demand. Meanwhile, 3D Systems, Stratasys and EOS emphasize printer-material co-optimization. Future rivalry will pivot on multi-material deposition and integrated post-processing. Players integrating in-situ inspection and AI-guided parameter tuning stand to capture higher margins as customers favor turnkey solutions over standalone powders or printers. Intellectual-property depth around alloy chemistry and material databases will further dictate competitive staying power within the rapid prototyping materials market.
Rapid Prototyping Materials Industry Leaders
-
Arkema
-
BASF
-
3D Systems Inc.
-
EOS GmbH
-
Stratasys Ltd.
- *Disclaimer: Major Players sorted in no particular order
Market Opportunities and Future Outlook
A visible whitespace sits at the intersection of qualification-ready feedstocks and turnkey process recipes, especially for metals where buyers want repeatability across lots, machines, and sites. The EOS and Constellium co-marketing of specialized aluminum alloys with validated laser powder bed fusion parameters points to demand shifting from generic powders toward packaged, application-led solutions that reduce parameter development time for aerospace and industrial users. Materials suppliers and OEMs that bundle certified powders or resins with parameter sets, inspection guidance, and post-processing routes are positioned to capture more value than commodity feedstock sellers.
Two additional opportunity lanes are taking clearer shape: (1) regionalized, resilient supply for critical metal powders and (2) sustainability-led polymer innovation. Coogee Titanium, together with the Additive Manufacturing Cooperative Research Centre and the University of Queensland, started a funded program in 2026 to assess locally produced TiRO titanium powder for industrial additive manufacturing, indicating buyer interest in alternative, regionally validated titanium supply. In parallel, biodegradable and compostable filament introductions (for example, Hembased launching a cold-compostable filament derived from palm-leaf byproducts) and industrial-scale bio-based filament capacity announcements in China show continued experimentation and scaling in lower-impact polymers. This supports room for qualified, performance-stable bio-based materials that also meet processing and consistency requirements.
Recent Industry Developments
- May 2026: Stratasys announced a definitive agreement to acquire Markforged in an all-cash transaction. The combination brings together complementary polymer and metal additive platforms and broadens the installed base that consumes qualified materials. The announcement reinforced consolidation dynamics among OEMs that increasingly control material ecosystems through integrated hardware, software, and validated consumables.
- July 2025: Stratasys acquired select 3D printing assets from Nexa3D. The deal expanded Stratasys capabilities across polymer printing technologies and supported a wider portfolio of compatible materials and workflows. It also tightened competitive pressure on smaller players by shifting more customer demand toward end-to-end platforms.
- February 2024: Evonik Industries launched INFINAM FR 4100L, a flame-retardant photopolymer designed for DLP printers. The product targeted applications where regulatory and safety requirements drive resin selection, supporting broader adoption beyond concept models into functional prototypes. The launch added to the trend of application-specific resin chemistries rather than general-purpose photopolymers.
Research Methodology Framework and Report Scope
Market Definition and Coverage
For this methodology, the rapid prototyping materials market includes revenues from materials consumed to build prototype parts and models using rapid prototyping and related additive processes, across industrial and product development uses.
Scope exclusions: We exclude printer hardware, software, scanning services, and general machining tool consumables that are not purchased mainly for prototype builds.
Segmentation Overview
- By Material Type
- Plastics (Polymers)
- Metals and Alloys
- Ceramics
- Other Materials
- By End-User Industry
- Automotive
- Aerospace and Defence
- Medical
- Electronics
- Construction
- Other End-User Industries
- By Geography
- Asia-Pacific
- China
- India
- Japan
- South Korea
- Rest of Asia-Pacific
- North America
- United States
- Canada
- Mexico
- Europe
- Germany
- United Kingdom
- France
- Italy
- Rest of Europe
- South America
- Brazil
- Argentina
- Rest of South America
- Middle-East and Africa
- Saudi Arabia
- South Africa
- Rest of Middle-East and Africa
- Asia-Pacific
Data Sources, Market Sizing, and Validation
Desk Research
Desk research was used to set the outer limits of demand and to anchor the model to repeatable public indicators. We reviewed manufacturing output and trade signals, along with materials science and process adoption notes, to understand how quickly prototype workflows are shifting from legacy methods into additive and hybrid methods.
Public sources reviewed included, as examples, US Census Bureau and US International Trade Commission data for manufacturing and trade context, Bureau of Labor Statistics producer price series for cost movement, Eurostat structural business statistics, OECD industrial production series, and technical standards and guidance from organizations such as ISO and ASTM that influence material qualification. We also referred to company filings, investor presentations, patents databases, and reputable industry press, and we selectively used paid subscriptions for company financials and news plus patent analytics to validate product mix changes and timing. These desk sources are not exhaustive, and we used other public and paid references to support data collection, validation, and clarification.
Primary Interviews and Surveys
Primary work focused on confirming what portion of overall prototyping activity is actually material driven, and how pricing behaves across polymers, metals, and ceramics. We spoke with a mix of material suppliers, service bureaus, and procurement and engineering roles from key end users across APAC, EMEA, and the Americas, which helped close gaps around utilization, scrap factors, and typical re-order cycles.
Distribution of primary research fieldwork respondents
| Company type | Respondent position | Region |
|---|---|---|
| Top tier: 37% | CXOs: 15% | APAC: 44% |
| Mid tier: 42% | Functional/Unit leaders: 42% | EMEA: 35% |
| Smaller Players: 21% | Managers: 43% | Americas: 21% |
Market-Sizing & Forecasting
Sizing started from a top-down build where manufacturing activity and prototyping intensity were translated into a materials consumption pool, and then converted to revenue using material specific pricing and mix. To keep it practical, we used inputs such as additive prototyping adoption by industry, typical material consumption per prototype build, scrap and rework rates, shifts in resin and powder pricing, qualification cycles in regulated end uses, and regional production trends that move prototype volumes.
Results were then checked with selective bottom-up approximations, such as sampled volume by material family multiplied by observed average selling prices and channel checks with distributors and service bureaus. When a direct split was not visible (for example, prototype versus short-run production usage), we applied share assumptions based on primary feedback, followed by sensitivity checks so the totals stayed consistent with external demand signals.
For forecasting, we used scenario analysis with a light multivariate regression overlay, where adoption rates, price trends, and industry output were the main drivers. The forward view was adjusted only after expert feedback confirmed the direction of qualification lead times and the expected pace of material substitutions.
Data Validation & Update Cycle
Validation was done through stepwise checks that compared model outputs against independent signals, such as industrial production, pricing direction, and visible shifts in end-user prototyping activity. Outliers were reviewed at the country and region level, and assumptions were re-checked when the implied material intensity moved outside ranges supported by interviews.
Before sign-off, the work goes through multi-step analyst review, followed by re-contact triggers when large variances show up across sources or when a major event changes supply, pricing, or qualification rules. Reports are refreshed annually, with interim updates for material events, and a final pre-delivery pass is completed so clients receive the latest updated view.
Mordor Intelligence's Rapid Prototyping Materials Market Estimate Compared With Other Published Estimates
Published market sizes for rapid prototyping materials do not always match because the counted item can shift between materials-only revenue and broader prototyping ecosystems. Differences also come from how analysts treat prototype-only consumption versus short-run production usage, how fast they let average selling prices change, and which regions are refreshed first when new capacity or qualification rules appear.
Some published figures fold in services and printer related spend, and the materials pool becomes larger as a result. In Mordor Intelligence, the total is limited to material revenues tied to prototyping workflows, and it is cross-checked using material mix and consumption rates discussed with suppliers and end users.
Benchmark comparison
| Source | Market Size | Gaps in Research Methodology |
|---|---|---|
| Mordor Intelligence | USD 6.44 B (2026) | |
| Trade Journal A | USD 5.90 B (2026) | Uses conservative pricing for polymers and assumes faster recycling and reuse of powders, which reduces net material consumption per prototype build. |
| Global Consultancy B | USD 7.20 B (2026) | Includes adjacent spend linked to prototyping programs, such as contracted prototype services bundled with material charges, and applies higher blended ASP escalation. |
The table shows that most of the spread is explained by what is counted as materials revenue and how consumption and pricing are treated. By keeping the model tied to observable prototyping activity, practical consumption factors, and interview-backed price movement, we can present a value that is easier to trace and repeat year after year.
Key Questions Answered in the Report
What is the current value of the rapid prototyping materials market?
The market is valued at USD 6.44 billion in 2026 and is projected to grow to USD 9.53 billion by 2031.
Which material segment is expanding the fastest?
Metals and alloys are expected to post the highest 10.03% CAGR through 2031, driven by aerospace and biomedical demand.
Why is Asia Pacific the fastest-growing region?
China’s aggressive capacity build-out and India’s burgeoning medical-device sector underpin a 10.31% regional CAGR, outpacing other geographies.
How are sustainability mandates influencing material choices?
ISCC-certified bio-based polymers and recycled metal powders are gaining traction as regulators impose carbon-reduction targets and circular-economy goals.
What is the major bottleneck limiting large-scale additive adoption?
A global skills gap in advanced design optimization and material processing constrains production scaling despite rising hardware installations.