
Rapid Application Development Market Size and Share
Market Overview
| Study Period | 2020 - 2031 |
|---|---|
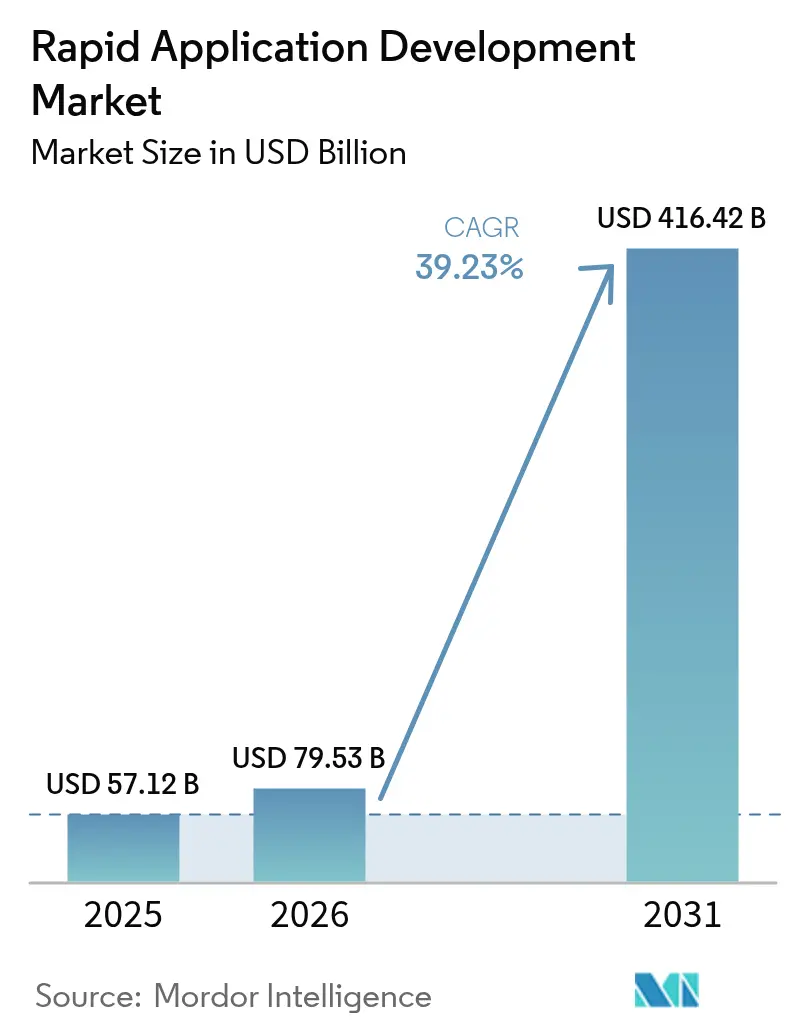
| Market Size (2026) | USD 79.53 Billion |
| Market Size (2031) | USD 416.42 Billion |
| Growth Rate (2026 - 2031) | 39.23 % |
| Fastest Growing Market | Asia Pacific |
| Largest Market | North America |
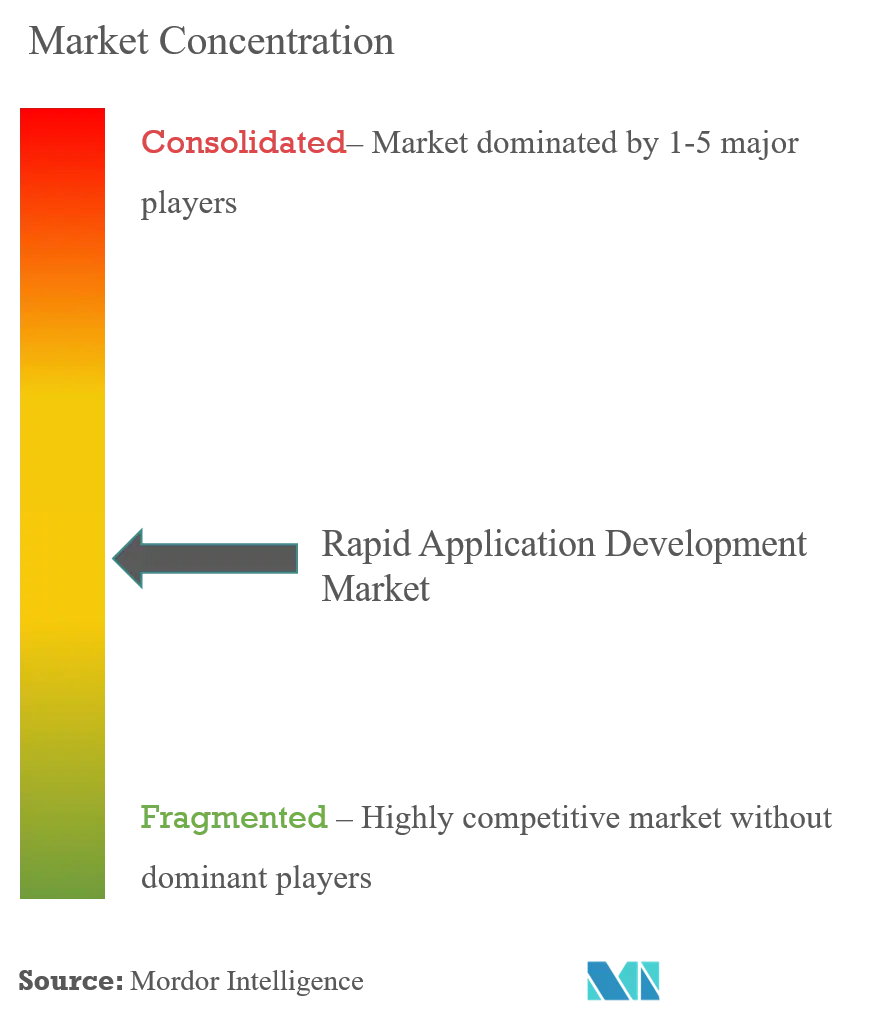
| Market Concentration | Medium |
Major Players *Disclaimer: Major Players sorted in no particular order Image © Mordor Intelligence. Reuse requires attribution under CC BY 4.0. | |
Rapid Application Development Market Analysis by Mordor Intelligence
The rapid application development market size was valued at USD 57.12 billion in 2025 and estimated to grow from USD 79.53 billion in 2026 to reach USD 416.42 billion by 2031, at a CAGR of 39.23% during the forecast period (2026-2031). Demand accelerates as enterprises shift from lengthy waterfall cycles to platforms that compress build times from quarters to weeks, a trend intensified by chronic software developer shortages and initiatives to digitize aging workflows. Low-code platforms support professional developers who want speed without sacrificing control, while no-code tools empower business users to build departmental apps, expanding the total creator base. Cloud deployment continues to outpace on-premise installations because it delivers elastic scalability, automatic updates, and consumption-based pricing that aligns operating costs with usage. Meanwhile, generative AI embedded in platforms such as Salesforce Einstein GPT and Microsoft Copilot Studio drafts logic from natural language prompts, further reducing the time-to-market for customer-facing and internal tools. Competitive intensity is rising as hyperscalers bundle RAD features into broader cloud subscriptions, pressuring standalone vendors on pricing, even as verticalized templates and AI-assisted governance offer new avenues for differentiation.
Key Report Takeaways
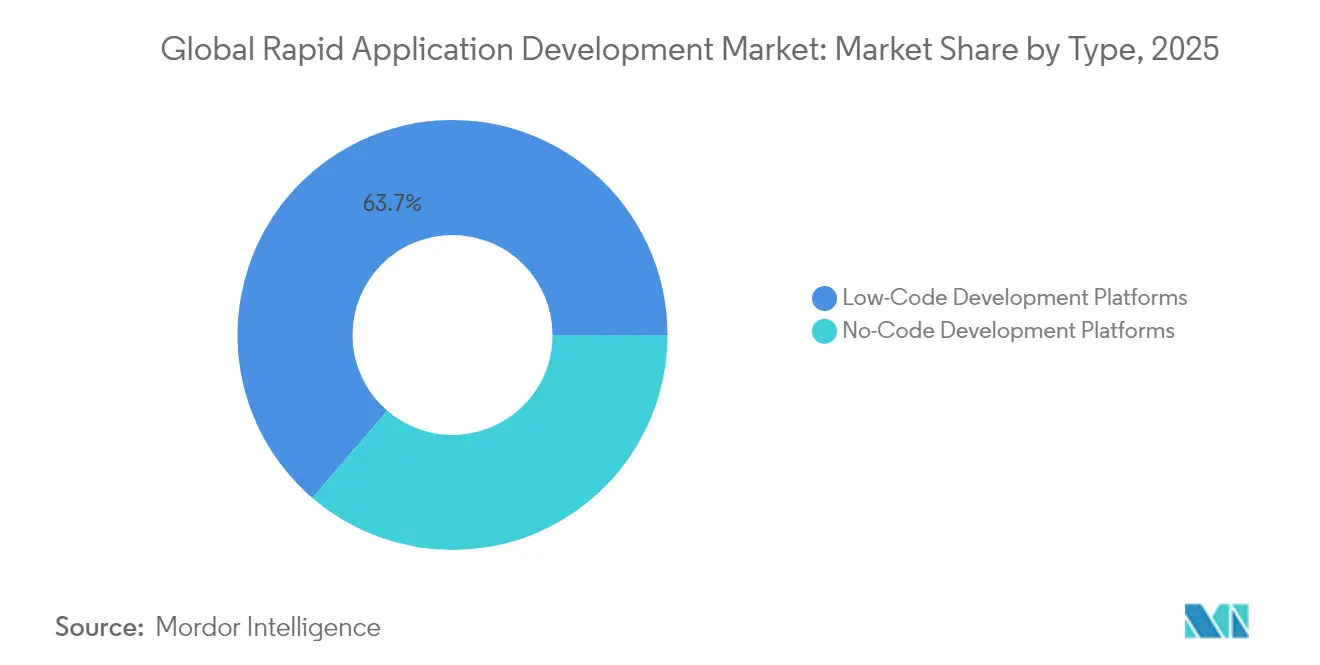
- By type, low-code development platforms led with 63.70% revenue share of the rapid application development market in 2025; no-code development platforms are forecast to register a 41.20% CAGR through 2031, the fastest among all categories.
- By deployment mode, cloud deployment captured 73.15% share of the rapid application development market in 2025; cloud deployment is projected to grow at a 40.95% CAGR through 2031, outpacing on-premise installations.
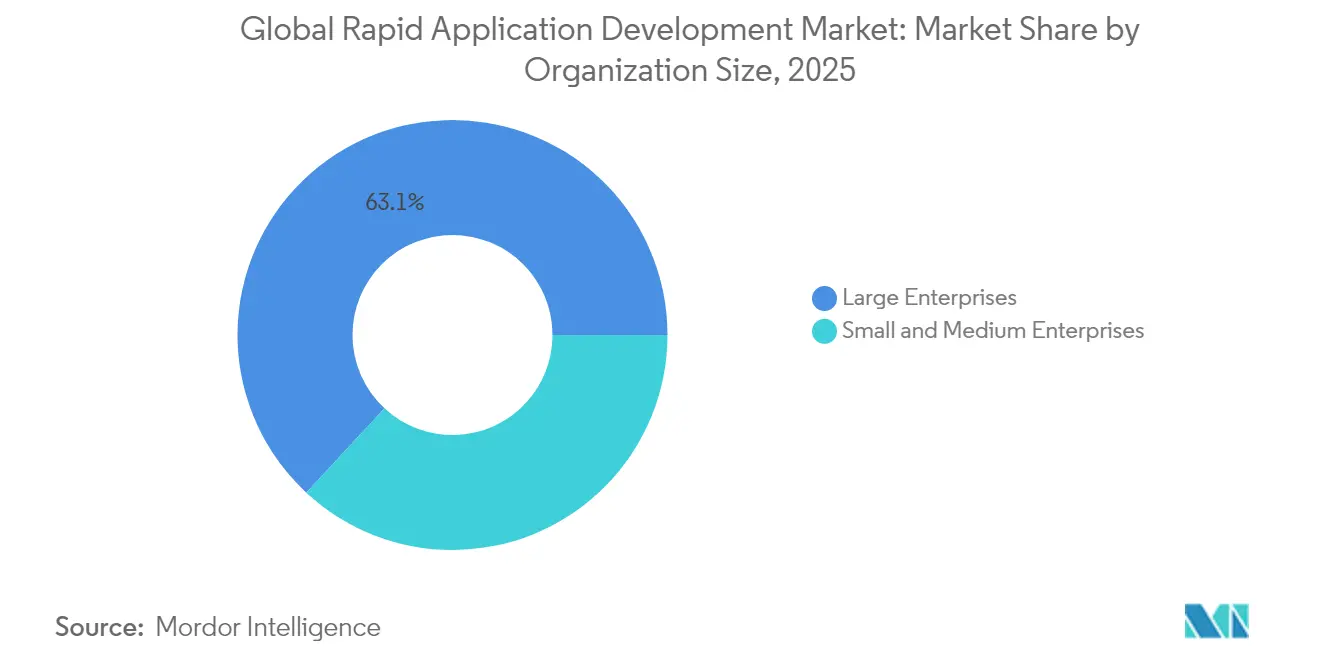
- By organization size, large enterprises held a 63.10% share of the rapid application development market in 2025; small and medium enterprises are expected to expand at a 41.65% CAGR through 2031, the quickest across company tiers.
- By end-user industry, Banking, Financial Services, and Insurance accounted for a 28.65% share of the rapid application development market in 2025; the Information Technology segment is set to rise at a 42.80% CAGR through 2031, the highest among all verticals.
- By geography, North America dominated the rapid application development market with a 38.90% share in 2025; the Asia Pacific is forecast to post a 41.95% CAGR through 2031, the fastest regional expansion.
Note: Market size and forecast figures in this report are generated using Mordor Intelligence’s proprietary estimation framework, updated with the latest available data and insights as of 2026.
Market Trends and Insights
Drivers Impact Analysis of Rapid Application Development Market*
| Driver | (~) % Impact on CAGR Forecast | Geographic Relevance | Impact Timeline |
|---|---|---|---|
| Innovation in businesses and integration of advanced technologies | +6.8% | Global, concentrated in North America and Europe | Medium term (2-4 years) |
| Flexibility to customize solutions as per dynamic enterprise requirements | +5.2% | Global, particularly strong in Asia Pacific and North America | Short term (≤ 2 years) |
| Rising demand for low-code platforms amid software-developer shortages | +7.9% | Global, acute in North America, Europe and developed Asia Pacific markets | Short term (≤ 2 years) |
| Accelerating digital transformation initiatives among small and medium enterprises | +6.5% | Global, with rapid uptake in Asia Pacific, Latin America and Middle East | Medium term (2-4 years) |
| AI-assisted application generation capabilities embedded in RAD tools | +8.1% | Global, early adoption in North America and Europe | Long term (≥ 4 years) |
| Corporate citizen-developer programs scaling under revised IT governance | +5.4% | North America and Europe, expanding to Asia Pacific | Medium term (2-4 years) |
| Source: Mordor Intelligence | |||
Innovation in Businesses and Integration of Advanced Technologies
Enterprises are pivoting to microservices, event-driven architectures, and serverless compute, and RAD platforms have evolved to integrate these components through visual connectors. ServiceNow and Appian expose pre-built microservice templates that shorten provisioning time for workflow engines from days to minutes. Manufacturers exploit Siemens Mendix to fuse IoT sensor data with low-code dashboards that run at the network edge, unlocking predictive maintenance use cases. These integrations reduce technical debt by abstracting complex infrastructure behind declarative models, while ensuring that applications remain cloud-agnostic as strategies mature. Adoption is most advanced in North America and Europe, where 5G rollouts and mature DevOps cultures support continuous improvement cycles.
Rising Demand for Low-Code Platforms Amid Software-Developer Shortages
The United States Bureau of Labor Statistics projected in 2024 that software developer employment would grow 25% from 2022 to 2032, outpacing supply growth.[1] Low-code tools mitigate the shortfall by enabling business analysts to build web and mobile apps through drag-and-drop interfaces, freeing senior engineers to focus on core algorithms. An OutSystems study reported that 74% of organizations planned to deliver at least 10 applications via low-code in the next year, with 31% using embedded AI for faster delivery. Financial institutions such as JPMorgan Chase compressed loan-origination cycles from 18 months to 6 weeks after adopting Appian. Wage inflation exceeding 15% for developers in 2024 raised pressure on operating budgets and boosted demand for citizen-developer programs that stretch limited talent.
Accelerating Digital Transformation Initiatives Among Small and Medium Enterprises
SMEs historically relied on off-the-shelf software that seldom matched niche workflows. Subscription-priced RAD products provide ready-made templates for inventory management, field service automation, and omnichannel commerce. Government digital-filing mandates in India and Brazil encouraged SMEs to integrate tax portals with legacy accounting packages using low-code connectors. Cloud deployment eliminates infrastructure burdens, enabling a mid-sized retailer to launch an inventory system on Zoho Creator within weeks at a fraction of the traditional development cost.[2] Network effects emerge as SMEs monetize templates on vendor marketplaces, spreading best practices and reducing duplicate coding effort.
AI-Assisted Application Generation Capabilities Embedded in RAD Tools
Generative AI elevates RAD from visual assembly to intelligent co-creation. Salesforce Einstein GPT converts plain-English process descriptions into Apex code, validation rules, and screen flows.[3] Microsoft Copilot Studio extends Power Platform with chat-based interfaces that output Power Apps canvases and Power Automate flows, cutting first-draft build time by 40%. OutSystems AI Mentor Studio scans low-code artifacts to flag inefficient queries and propose refactoring, thereby shrinking technical debt remediation cycles. Enterprises that pair these tools with prompt engineering training realize outsized productivity gains, although the full value will be realized over four years or more when models ingest proprietary codebases and compliance policies.
Restraints Impact Analysis of Rapid Application Development Market*
| Restraint | (~) % Impact on CAGR Forecast | Geographic Relevance | Impact Timeline |
|---|---|---|---|
| Lack of skilled professionals to scale, govern and secure RAD deployments | -3.2% | Global, particularly acute in emerging markets | Short term (≤ 2 years) |
| Security and data-governance concerns within highly regulated sectors | -4.1% | Global, concentrated in BFSI, Healthcare, Government and Defense | Medium term (2-4 years) |
| Vendor lock-in risks owing to proprietary metadata models | -2.8% | Global, affecting enterprises with multi-cloud strategies | Long term (≥ 4 years) |
| Performance limitations for complex, compute-intensive workloads | -2.3% | Global, impacting Financial Services, Energy and Manufacturing | Medium term (2-4 years) |
| Source: Mordor Intelligence | |||
Security and Data-Governance Concerns Within Highly Regulated Sectors
Financial services and healthcare institutions face strict mandates for audit trails, encryption, and data residency that many RAD platforms only recently addressed. The Open Web Application Security Project reported common weaknesses such as insecure direct object references in citizen-built apps. Deutsche Bank limited low-code use to non-customer-facing workflows until vendors achieved SOC 2 Type II and ISO 27001 certifications. Healthcare providers cited HIPAA compliance gaps in default permission settings, delaying production launches. Stricter frameworks, such as GDPR, require regional data centers, prompting vendors like Betty Blocks to open a Frankfurt facility for European customers. Until platforms deliver end-to-end governance as the default, adoption in regulated verticals will lag behind less-regulated industries.
Lack of Skilled Professionals to Scale, Govern, and Secure RAD Deployments
RAD lowers coding barriers but not governance complexity. A KPMG survey revealed that 62% of firms lacked formal low-code oversight teams, resulting in duplicated functionality and orphaned projects. Architects who bridge business logic and security policy remain scarce, especially in emerging markets with shallow talent pools. ServiceNow App Engine Studio embeds automated policy checks, yet it still requires skilled administrators to configure guardrails. Enterprises are therefore investing in centers of excellence that curate components, run code reviews, and ensure integration with service catalogs; however, recruiting delays slow program maturity.
*Our forecasts treat driver/restraint impacts as directional, not additive. The impact forecasts reflect baseline growth, mix effects, and variable interactions.
Rapid Application Development Market Segment Analysis
By Type:
No-Code Platforms Capture Non-Technical UsersLow-code platforms held a 63.70% market share in the rapid application development market in 2025, led by Microsoft Power Platform and OutSystems, which combine drag-and-drop design with optional custom code for performance-critical paths. No-code platforms are forecast to grow at a 41.20% CAGR through 2031 as business users tap Airtable and Quickbase to build approval workflows and dashboards without IT involvement. This trajectory illustrates growing trust in visual tools for departmental productivity while IT retains oversight for enterprise-wide systems.
No-code growth complements rather than replaces low-code. Departments often experiment with no-code for rapid prototyping and later migrate to low-code when user counts increase or real-time data synchronization is required. The interplay expands the rapid application development market by matching tool complexity to workload requirements, driving broader adoption across mixed skill profiles.

By Deployment Mode:
Cloud Dominance Driven by Scalability and Automatic UpdatesCloud deployment accounted for 73.15% of revenue in 2025 and is forecast to expand at a 40.95% CAGR through 2031, capturing both new workloads and migrations. Bundled identity management, consumption-based billing, and real-time collaboration give cloud platforms a decisive advantage over on-premise alternatives.
On-premise solutions persist where data sovereignty or air-gapped networks are mandatory, for example, in defense installations and select financial institutions. Oracle APEX and hybrid OutSystems stacks cater to these needs; however, the total cost of ownership remains higher than that of cloud equivalents. As compliance frameworks evolve, more users switch, reinforcing cloud as the primary growth engine for the rapid application development market.
By Organization Size:
SMEs Drive Growth as Subscription Models Lower BarriersLarge enterprises contributed 63.10% of 2025 revenue by embedding RAD within enterprise architecture and leveraging dedicated vendor support. They modernize legacy COBOL forms, automate multi-step approvals, and integrate global data sources through platforms tied to existing cloud ecosystems.
SMEs, however, are expected to register a 41.65% CAGR through 2031. Affordable per-user subscriptions enable a regional retailer to deploy a reservation system for USD 500, rather than commissioning bespoke development at USD 50,000. Government mandates for e-invoicing in India and Brazil are compelling many SMEs to digitize their operations quickly, thereby further expanding the rapid application development market.
By End-User Industry:
Information Technology Sector Leads Growth as Vendors Embed RAD into DevOpsBanking, Financial Services, and Insurance accounted for 28.65% of 2025 revenue, driven by compliance-driven iteration cycles. Yet, the Information Technology sector is set to grow at a 42.80% CAGR through 2031 as software vendors embed low-code builders into IT service suites. ServiceNow, Atlassian, and GitLab each added visual workflow designers that enable teams to ship internal tools without relying on external contractors.
Healthcare, Retail, Manufacturing, and Government each adopt RAD for sector-specific imperatives. Siemens Mendix empowers manufacturers to visualize IoT data. Retailers build customized curbside pickup portals. Governments are using low-code to modernize their permitting systems. The breadth of scenarios underscores how domain templates expand the addressable market for Rapid Application Development.
Geography Analysis
North America Rapid Application Development Market
North America accounted for 38.90% of 2025 revenue, driven by mature IT budgets and widespread citizen-developer programs. Microsoft, Salesforce, and ServiceNow leverage extensive ecosystems of implementation partners, making platform adoption straightforward for Fortune 500 companies. Canada’s public sector adopted RAD to refresh legacy systems while meeting local data-residency laws. Mexico’s manufacturing plants share supplier portals built on AWS Honeycode with U.S. partners, illustrating cross-border workflow digitization.
APAC Rapid Application Development Market
Asia Pacific is projected to grow at 41.95% CAGR through 2031, the highest regional pace. India’s Digital India initiative and China’s 14th Five-Year Plan encourage local firms to minimize custom coding hours, fueling the uptake of Zoho Creator and Alibaba Cloud's low-code suites. Japan uses RAD to offset developer shortages amid an aging workforce, while Australia’s banks adopt low-code to comply with open banking requirements. Local data-protection rules, such as China’s PIPL, force vendors to establish regional data centers; yet, this investment expands addressable demand across diverse markets.
EMEA and South America Rapid Application Development Market
Europe, South America, the Middle East, and Africa make steady contributions. GDPR compliance raised the bar for security features, slowing uptake in highly regulated sectors yet accelerating demand for platforms with robust audit logs and on-shore hosting. Brazil’s SMEs prefer subscription-priced RAD tools that match revenue volatility. Gulf Cooperation Council states fund e-government programs built on ServiceNow and OutSystems, and Kenya’s startups leverage mobile-first RAD suites to leapfrog desktop development.
Regulatory Landscape
Regulation affecting rapid application development (RAD) is increasingly focused on security, auditability, and the safe use of embedded AI in low-code and no-code environments, especially for cloud deployments that dominate platform adoption. In Europe, the European Commission is implementing the EU AI Act (Regulation (EU) 2024/1689), with full enforcement for high-risk AI systems starting in August 2026 and transparency obligations under Article 50 shaping how RAD platforms document AI-generated content and user disclosures when generative capabilities are embedded in app builders.
Governments and standards bodies are also formalizing platform requirements and software supply-chain controls. In the United States, the Army National Guard issued PPM CIO-076 in July 2025 to set enterprise guidance for low-code/no-code development governance and cybersecurity integration, while federal cloud oversight continues to tighten via FedRAMP policy updates for 2026 that emphasize secure configuration and continuous monitoring for automated deployment workflows. In China, SAC/SAMR issued GB/T 46900-2025 in December 2025, which takes effect on July 1, 2026 and defines general technical requirements for low-code development platforms, creating a compliance anchor for vendors and enterprise buyers in that market. Parallel guidance from bodies such as NIST and CISA also supports SBOM visibility and secure development attestations that influence how RAD pipelines are controlled and audited.
Value Chain Analysis
The RAD value chain starts with core technology inputs (cloud infrastructure, identity and access management, databases, API management, and AI foundation services) and incorporates them into low-code/no-code platforms through visual designers, connectors, governance tooling, and runtime services. Platform vendors distribute mainly via cloud marketplaces and direct enterprise sales, while system integrators, managed service providers, and consulting partners handle implementation and integration to ERP/CRM and legacy systems, along with ongoing governance through centers of excellence, including security configuration, access controls, and audit reporting.
Downstream value comes from solution packaging, vertical templates, and component reuse across departments, with bottlenecks often concentrated in integration readiness, security reviews, and data access when connectors and policies are not standardized. Standards activity also functions as a value-chain enabler and a procurement filter: IEEE Std 3358-2025 (approved May 28, 2025) specifies architectural and performance requirements for low-code application platforms, including scalability, portability, and security, while China’s GB/T 46900-2025 (issued December 31, 2025, implemented July 1, 2026) sets technical expectations that shape product localization, documentation, and verification practices for vendors serving Chinese enterprises. These external anchors raise the importance of compliance-ready platform configurations and partner-led assurance services across delivery.
Competitive Landscape
The rapid application development market tilts toward moderate concentration. Microsoft, Salesforce, Oracle, and Amazon Web Services anchor the top tier by bundling RAD with existing PaaS and productivity clouds. Microsoft Power Platform surpassed 22 million monthly active users in October 2025, following the addition of AI agents to Copilot Studio. Salesforce Einstein 1 Studio, generally available in November 2025, automates workflow generation and targets industries with pre-trained models. Oracle APEX 24.1 introduced AI-assisted SQL creation that resonates with database administrators. AWS Honeycode enhancements attract startups already running compute workloads on EC2.
Specialists defend share through vertical depth and governance tools. OutSystems partnered with NVIDIA in September 2025 to embed GPU inference, unlocking predictive-maintenance apps for industrial users. Siemens Mendix 10 added edge-computing support for shop-floor analytics. Appian partnered with AWS on compliance packs for the regulated sector. ServiceNow acquired Moveworks to embed conversational AI within employee portals.
Emerging disruptors target departmental buyers. Airtable added multi-step automation that draws marketing teams, while Quickbase inserts AI data-quality checks to reduce errors in SME dashboards. Betty Blocks satisfies GDPR data residency requirements by hosting in Germany. Creatio delivers no-code CRM with embedded AI for cost-sensitive Latin American customers. The field remains competitive as generative AI, template marketplaces, and vertical solution packs reshape value propositions within the rapid application development market.
Rapid Application Development Industry Leaders
-
Microsoft Corporation
-
Salesforce Inc.
-
Oracle Corporation
-
International Business Machines Corporation
-
Amazon Web Services Inc.
- *Disclaimer: Major Players sorted in no particular order
Rapid Application Development Market Companies Covered in this Report
- Microsoft Corporation
- Salesforce Inc.
- Oracle Corporation
- International Business Machines Corporation
- Amazon Web Services Inc.
- Appian Corporation
- ServiceNow Inc.
- Zoho Corporation Private Limited
- OutSystems – Software em Rede S.A.
- LANSA Inc.
- Mendix Technology B.V.
- Pegasystems Inc.
- Siemens AG (Mendix)
- Google LLC (AppSheet)
- Airtable Inc.
- Quickbase Inc.
- Betty Blocks B.V.
- Temenos AG (Temenos Quantum, formerly Kony)
- Creatio EOOD
- Nintex Global Ltd.
- WaveMaker Inc.
- Neptune Software AS
Market Opportunities and Future Outlook
A key whitespace is enterprise-grade governance for AI-assisted and citizen-developed applications, where regulated industries require end-to-end audit trails, data controls, and secure release processes across visual builders and CI/CD. Policy and guidance are converging on software supply-chain transparency and secure development practices, supporting demand for RAD platforms that can generate and manage artifacts such as SBOMs and attestations alongside automated deployment workflows. This is reinforced by federal cloud governance through FedRAMP policy updates for 2026 and security guidance from bodies such as NIST and CISA. Vendors that embed governance by default, rather than as an add-on, can broaden adoption beyond departmental tools into customer-facing and compliance-sensitive workflows.
Another opportunity is the shift from standalone code generation toward agentic, lifecycle-wide development experiences that orchestrate requirements, build, test, and deployment within governed environments. In July 2026, Forrester published its Agentic Development Platforms Vendor Landscape (Q3 2026), reflecting buyer attention toward platforms that combine orchestration and enterprise context with governance across the SDLC, which aligns with generative AI being embedded in RAD environments. Recent platform moves also point in this direction, including AWS App Studio (July 2024) bringing generative, prompt-driven app creation to business users, and Oracle’s AI-native builder experience for Oracle AI Agent Studio for Fusion Applications (July 2026) spanning no-code, low-code, and pro-code, which expands the partner implementation surface for reusable agentic workflows tied to enterprise application suites.
Recent Industry Developments in Rapid Application Development Market
- July 2026: Oracle introduced an AI-native builder experience for Oracle AI Agent Studio for Fusion Applications, combining no-code, low-code, and pro-code approaches in a unified build path. The release puts agent-centric development inside a major enterprise application suite into sharper focus and increases competitive pressure on standalone RAD vendors that differentiate primarily on UI builders rather than end-to-end lifecycle tooling.
- March 2025: Salesforce launched Agentforce 2dx with new capabilities and tooling to configure, test, and deploy AI agents, spanning both low-code and pro-code workflows. By packaging agent creation into repeatable building blocks, the update expands RAD use from app screens and forms toward operational automation where governance and monitoring become part of the delivery standard.
- July 2024: AWS announced AWS App Studio, a generative AI-powered low-code service that enables building enterprise applications using natural language prompts. The launch strengthened hyperscaler participation in RAD and expanded buyer options for rapid internal app creation directly within cloud ecosystems where identity, data, and deployment services are already standardized.
Rapid Application Development Market Report Scope and Research Methodology
Market Definition and Coverage
This market covers revenue generated from rapid application development platforms and related services that help organizations build, test, deploy, and update business applications faster, using visual development, reusable components, and automation.
Scope exclusions: We exclude general IT outsourcing that is not tied to RAD platform delivery, and we also exclude unrelated application hosting sold as standalone infrastructure.
Segments Covered in This Report
- By Type
- Low-Code Development Platforms
- No-Code Development Platforms
- By Deployment Mode
- On-Premise
- Cloud
- By Organization Size
- Small and Medium Enterprises
- Large Enterprises
- By End-User Industry
- Banking, Financial Services and Insurance
- Retail and E-Commerce
- Government and Defense
- Healthcare
- Information Technology
- Energy and Utilities
- Manufacturing
- Other End-User Industries
- By Geography
- North America
- United States
- Canada
- Mexico
- South America
- Brazil
- Argentina
- Rest of South America
- Europe
- Germany
- United Kingdom
- France
- Italy
- Spain
- Russia
- Rest of Europe
- Asia Pacific
- China
- Japan
- India
- South Korea
- Australia
- Rest of Asia Pacific
- Middle East and Africa
- Middle East
- Saudi Arabia
- United Arab Emirates
- Turkey
- Rest of Middle East
- Africa
- South Africa
- Nigeria
- Egypt
- Rest of Africa
- Middle East
- North America
Data Sources, Market Sizing, and Validation
Desk Research
Desk research starts by mapping the demand pool for rapid application development using public technology and economic indicators, and then aligning that with supply-side disclosures. In practice, we reference sources such as the US Bureau of Labor Statistics (software developer employment and wages), the US Census Bureau and OECD (digital economy and enterprise ICT indicators), Eurostat (enterprise cloud and software adoption), and standards and guidance bodies such as NIST for software security and governance context.
We also use company annual reports, investor presentations, and product documentation to understand how RAD platforms are packaged, priced, and sold, and to separate platform subscription revenue from adjacent spend like general cloud hosting. When needed, paid subscriptions are used selectively for company financials and intelligence, news and financials, and patent databases to check product direction and timing of platform capabilities. The desk sources listed here are not exhaustive, and additional public sources were used for cross-checks and clarification.
Primary Interviews and Surveys
Primary work is used to convert broad adoption signals into workable assumptions, especially where public data is not specific to rapid application development. We speak with platform-side roles, system integrators, and enterprise buyers across major regions so pricing bands, the cloud versus on-premise mix, and typical usage patterns can be checked against real buying cycles.
Input from functional leaders and delivery managers is used to confirm what share of low-code and no-code spend is actually RAD-related, and where that spend is accounted for inside broader application development budgets.
Distribution of primary research fieldwork respondents
| Company type | Respondent position | Region |
|---|---|---|
| Top tier: 25% | CXOs: 13% | APAC: 49% |
| Mid tier: 57% | Functional/Unit leaders: 41% | EMEA: 31% |
| Smaller Players: 18% | Managers: 46% | Americas: 20% |
Market-Sizing & Forecasting
Sizing begins with a top-down build where application development software and platform spend is reconstructed by region, then filtered using adoption rates for RAD-style platforms in enterprises and SMBs. Once that demand pool is shaped, we apply split assumptions for low-code versus no-code, cloud versus on-premise delivery, and the share sold via direct sales versus partners.
To keep totals realistic, the model is checked with selective bottom-up approximations such as sampled vendor revenue bands, average subscription pricing tied to typical user seats, and implementation services intensity seen in channel checks. Key inputs that were tracked include enterprise cloud adoption, the number of application projects moving from backlog to build, developer availability pressures, average contract length and renewal behavior, and the pace of feature add-ons like governance and AI assistance that can move average selling prices. For forecasting, scenario analysis is used so growth paths can be adjusted using primary feedback on budget cycles, platform consolidation, and procurement scrutiny, and then stress-tested across regions.
Data Validation & Update Cycle
Outputs are validated through triangulation across independent signals, followed by variance checks at region and deployment level so unusual jumps are investigated before sign-off. Where the model disagrees with interview feedback, assumptions are revisited, and when needed respondents are re-contacted to confirm whether the gap is due to scope, pricing, or timing.
Each report is refreshed annually, and interim updates are made when major platform shifts, regulatory changes, or pricing moves materially change adoption. Before delivery, we do a fresh pass on key inputs and sanity checks so clients receive the most current view available at that time.
Mordor Intelligence's Rapid Application Development Market Sizing Compared With Other Published Estimates
Published numbers for rapid application development can vary widely, even when they appear to describe the same space, because scope and counting rules are not consistent. Differences most often come from what is treated as RAD platform revenue versus general app development, whether services are included, and how quickly price points are assumed to move.
By tracking contract-length weighted ASP changes, cloud versus on-premise mix, and partner-led services attach rates, Mordor Intelligence keeps the model tied to revenue that is directly attributable to RAD platforms (instead of broader software development spend). Some estimates also use older base years or narrow definitions like RAD software-only, which can understate today's platform-led purchasing, while aggressive outlooks can overstate growth by assuming uniform adoption across industries and regions.
Benchmark comparison
| Source | Market Size | Gaps in Research Methodology |
|---|---|---|
| Mordor Intelligence | USD 79.53 B (2026) | |
| Trade Newswire A | USD 49.80 B (2022) | Uses an earlier base year and a broader narrative scope, and the conversion to a comparable RAD platform revenue pool is not clearly explained, which shifts both starting value and growth path. |
| RAD Software Publisher B | USD 3.53 B (2024) | Focuses on RAD software as a narrow product bucket, which likely excludes platform services, enterprise-grade tooling bundles, and broader low-code and no-code RAD use cases. |
The spread in the table is largely explained by boundary choices and the year being measured, not only by arithmetic differences. When scope is kept consistent around platform-led RAD revenue, and inputs are checked against buying and delivery patterns, the final size stays traceable to a repeatable set of assumptions.
Key Questions Answered in the Report
How fast is the Rapid Application Development market expected to grow through 2031?
It is projected to expand from USD 79.53 billion in 2026 to USD 416.42 billion by 2031, reflecting a 39.23% CAGR.
Which deployment model leads new spending on Rapid app platforms?
Cloud deployment held 73.15% share in 2025 and will grow the quickest at a 40.95% CAGR through 2031 thanks to elastic scalability and automatic updates.
Why are small and medium enterprises adopting RAD tools rapidly?
Subscription pricing, pre-built templates, and no infrastructure overhead allow SMEs to digitize workflows quickly, driving a 41.65% CAGR for this segment.
What role does generative AI play in today’s low-code platforms?
Embedded models such as Salesforce Einstein GPT and Microsoft Copilot Studio translate natural language into app logic, cutting initial build effort by roughly 40%.
Which vertical shows the fastest growth outlook for RAD adoption?
The Information Technology segment is forecast to log the highest 42.80% CAGR through 2031 as vendors embed low-code builders into DevOps pipelines.
What is a primary risk associated with citizen-developer programs?
Security and data-governance gaps can emerge when non-technical users publish apps without adequate oversight, especially in highly regulated industries.