
Racket Sports Equipment Market Size and Share
Market Overview
| Study Period | 2021 - 2031 |
|---|---|
| Market Size (2026) | USD 102.29 Billion |
| Market Size (2031) | USD 139.69 Billion |
| Growth Rate (2026 - 2031) | 6.42 % |
| Fastest Growing Market | Asia Pacific |
| Largest Market | North America |
| Market Concentration | Medium |
Major Players *Disclaimer: Major Players sorted in no particular order Image © Mordor Intelligence. Reuse requires attribution under CC BY 4.0. | |
Racket Sports Equipment Market Analysis by Mordor Intelligence
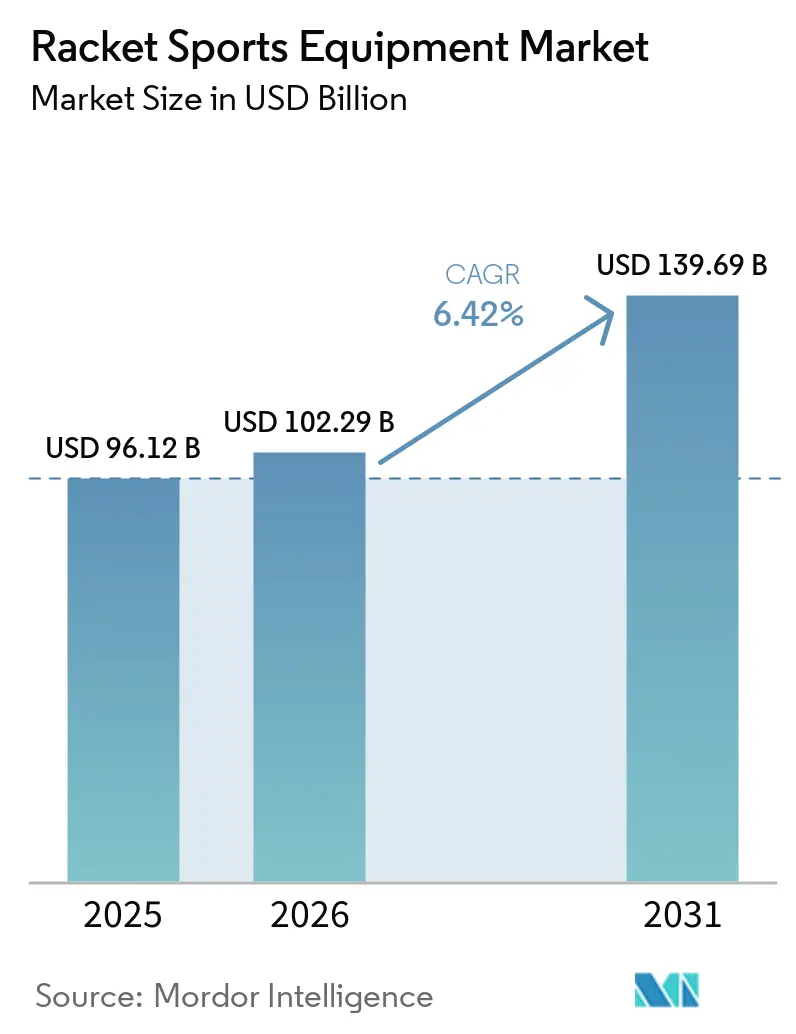
The racket sports equipment market size is expected to grow from USD 96.12 billion in 2025 to USD 102.29 billion in 2026 and is forecast to reach USD 139.69 billion by 2031 at 6.42% CAGR over 2026-2031. The market's growth is driven by the increasing establishment of indoor and outdoor courts, rising youth participation, and rapid advancements in product innovation, such as the integration of lightweight composites with smart sensor technologies. Government initiatives to fund facility expansions and the growing popularity of high-profile tournaments are further boosting market visibility and encouraging aspirational purchases. Additionally, evolving consumer preferences for sustainability, digital coaching solutions, and convenience are reshaping the market landscape. To meet these demands, companies are introducing recyclable frames, data-enabled rackets, and subscription-based services for grip and string replacements. While the Asia-Pacific region is experiencing the fastest growth, North America remains the largest contributor to overall market spending.
Key Report Takeaways
- By product type, rackets and bats led with 47.05% of the Racquet sports equipment market share in 2025, while bags and accessories are projected to expand at a 7.2% CAGR through 2031.
- By sport type, badminton accounted for 35.02% of revenue in 2025, while other sports types are projected to expand at an 7.85% CAGR through 2031.
- By end user, men held 56.93% share in 2025; equipment for kids/children is set to post a 7.45% CAGR to 2031.
- By distribution channel, offline retail controlled 73.55% of sales in 2025, yet online retail stores are growing at 7.6% CAGR.
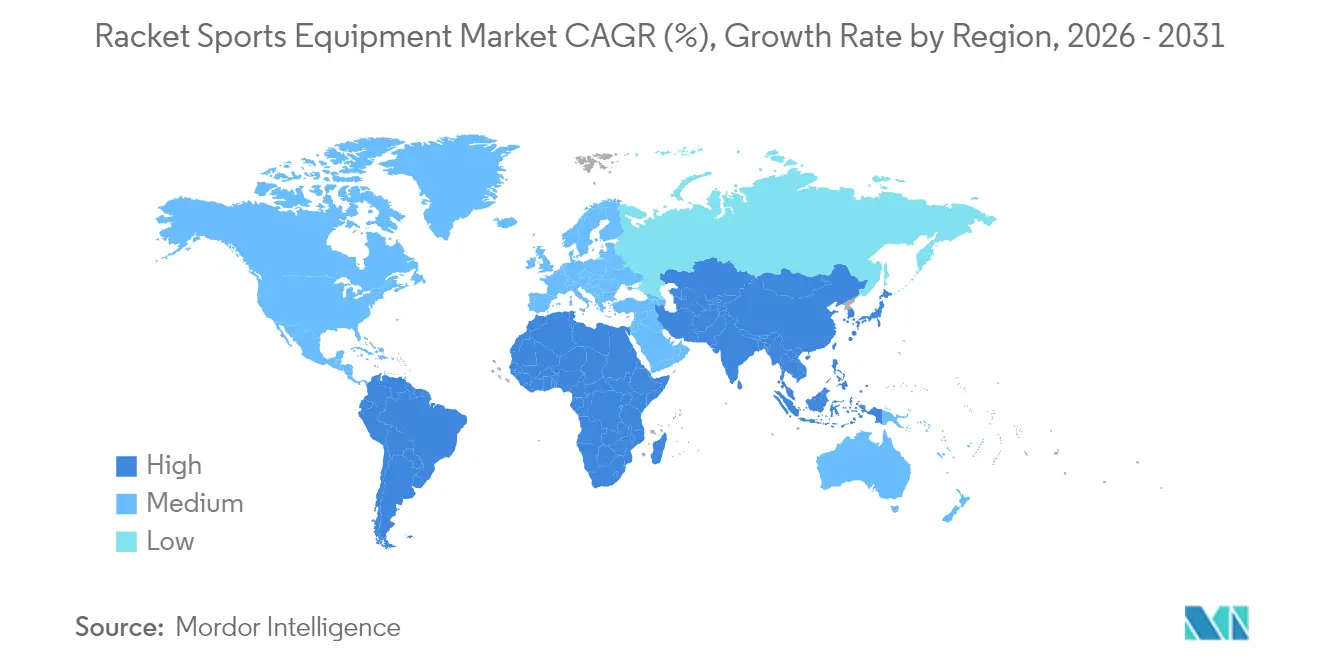
- By geography, North America remained the largest region with 32.15% in 2025, whereas Asia-Pacific is on track for an 8.05% CAGR to 2031.
Note: Market size and forecast figures in this report are generated using Mordor Intelligence’s proprietary estimation framework, updated with the latest available data and insights as of 2026.
Market Trends and Insights
Drivers Impact Analysis of Racket Sports Equipment Market*
| DRIVER | (~) % IMPACT ON CAGR FORECAST | GEOGRAPHIC RELEVANCE | IMPACT TIMELINE |
|---|---|---|---|
| Increasing number of racquet sports courts worldwide | +1.2% | Global, with concentrated growth in Asia-Pacific and emerging markets | Medium term (2-4 years) |
| Rising number of tournaments and leagues | +0.8% | Global, with premium impact in North America and Europe | Short term (≤ 2 years) |
| Government initiatives and sports promotion | +1.1% | Asia-Pacific core, spill-over to Middle East and Africa | Long term (≥ 4 years) |
| Increasing participation of women and children | +0.9% | Global, with accelerated adoption in developed markets | Medium term (2-4 years) |
| Technological advancements in equipment | +0.7% | North America and Europe, expanding to Asia-Pacific | Short term (≤ 2 years) |
| Influence of social media platforms and celebrity endorsements | +0.6% | Global, with youth-centric impact across all regions | Short term (≤ 2 years) |
| Source: Mordor Intelligence | |||
Increasing number of racquet sports courts worldwide
The global court construction market is witnessing significant growth, driven by the rapid expansion of padel facilities and other racquet sports infrastructure. For instance, the UK added 250 new courts between 2022 and 2023, reflecting a remarkable 116% increase. This surge highlights the growing popularity of padel across Europe. Similarly, Singapore's Punggol Regional Sport Centre, scheduled to open in 2026, will feature international-standard tennis courts designed to host major competitions. This development demonstrates how infrastructure investments are strategically targeting both recreational and professional markets to meet rising demand. The expansion of sports facilities is creating a ripple effect; the Asia-Pacific region, in particular, is experiencing a robust infrastructure boom, supported by government-backed initiatives. These initiatives focus on constructing synthetic courts and multipurpose halls that accommodate multiple racquet sports, thereby maximizing facility utilization and driving tennis racquet demand across a broad spectrum of users. This trend underscores the region's commitment to fostering sports participation and supporting the associated industries.
Rising number of tournaments and leagues
The rapid expansion of professional tournament structures is significantly influencing recreational equipment purchasing decisions by creating aspirational demand. For instance, the Australian Open's inclusion of pickleball in 2025 highlights the sport's growing mainstream acceptance and its integration into established tournament frameworks, signaling a shift in the perception of emerging sports. Similarly, the International Table Tennis Federation's introduction of innovative formats, such as the Mixed Team World Cup, not only broadens competitive opportunities but also fosters sustained participation and drives regular equipment replacement cycles[1]. This growth in the tournament ecosystem generates a cascading impact: professional equipment preferences increasingly shape amateur purchasing trends, while enhanced media coverage boosts overall market awareness. Furthermore, grassroots league structures play a pivotal role by offering organized participation pathways. These pathways help convert casual interest into long-term engagement, ensuring consistent equipment demand as players meet the requirements of structured play and advance through competitive levels. Together, these factors create a robust and dynamic environment that supports both market growth and sustained consumer interest.
Government initiatives and sports promotion
India's Ministry of Youth Affairs and Sports has allocated ₹3,794 crores for the fiscal year 2025-26, with a significant focus on infrastructure development and athlete support programs. These initiatives include the establishment of racquet sports facilities and the procurement of necessary equipment, aiming to strengthen the foundation for sports development. In Hong Kong, the "Sport for All" culture promotes widespread participation through major events such as badminton and tennis competitions[2]. The Young Athletes Training Scheme further supports youth development, creating a talent pipeline that contributes to the long-term expansion of the racquet sports market. Similarly, Andhra Pradesh's Sports Policy 2024-2029 prioritizes the development of world-class sports infrastructure, integrating advanced technology and emphasizing the creation of racquet sports academies and high-performance centers[3]. These strategic measures collectively drive sustained demand through institutional procurement channels while fostering participation pathways. As a result, government investments are effectively converted into long-term market growth, catering to multiple demographic segments and ensuring a robust foundation for the racquet sports market.
Increasing participation of women and children
Efforts to expand demographic participation are effectively extending market reach beyond traditional male-dominated patterns. The United States Professional Tennis Association has strengthened its initiatives by forming strategic partnerships with organizations like RacquetFit and introducing expanded certification programs. These programs are specifically designed to promote youth development, improve accessibility, and address critical barriers to entry. Globally, governments are implementing gender-inclusive sports policies aimed at overcoming historical challenges. These policies focus on upgrading sports facilities, providing equipment subsidies, and offering targeted coaching programs to encourage broader participation. Additionally, private sector involvement in funding and sponsorships is further accelerating the adoption of these initiatives. Youth engagement strategies, particularly those supported by institutional frameworks such as school sports programs, are proving instrumental in creating a pipeline effect. Early exposure to sports through these programs fosters lifelong participation habits, drives sustained demand for sports equipment, and cultivates a culture of inclusivity, supporting growth.
Restraints Impact Analysis of Racket Sports Equipment Market*
| RESTRAINT | (~) % IMPACT ON CAGR FORECAST | GEOGRAPHIC RELEVANCE | IMPACT TIMELINE |
|---|---|---|---|
| Risk of injury and safety concerns | -0.8% | Global, with heightened awareness in developed markets | Medium term (2-4 years) |
| Lack of time and lifestyle constraints | -1.1% | North America and Europe, expanding to urban Asia-Pacific | Long term (≥ 4 years) |
| Limited access to facilities and infrastructure | -0.9% | Emerging markets, rural areas globally | Long term (≥ 4 years) |
| Counterfeit and low-quality products | -0.6% | Asia-Pacific manufacturing hubs, global distribution | Medium term (2-4 years) |
| Source: Mordor Intelligence | |||
Risk of injury and safety concerns
Overuse injuries, including shoulder issues, tennis elbow, wrist ailments, and ankle problems, are the leading causes of reduced player participation in tennis. These injuries highlight the need for effective preventive measures within the market. While growing safety awareness has driven demand for protective equipment, it has also created a paradox by discouraging participation among risk-averse individuals, thereby impacting market growth. To address these challenges, equipment manufacturers are introducing advanced injury-prevention solutions, such as ergonomic grip designs and optimized string tension, aimed at reducing repetitive stress injuries. However, the high medical costs and extended recovery periods associated with racquet sports injuries remain significant barriers to long-term participation. This issue is particularly pronounced among older adults, a demographic increasingly interested in low-intensity exercise options but often deterred by the physical risks and recovery challenges associated with the sport.
Counterfeit and low-quality products
Legitimate manufacturers encounter significant obstacles in market access and brand integrity due to challenges in intellectual property enforcement. In fiscal year 2022, U.S. Customs and Border Protection seized over 21,000 items infringing intellectual property rights, with an estimated value of nearly USD 3 billion. These seizures included counterfeit sports equipment, which not only jeopardizes consumer safety but also damages brand reputation. The 2024 Special 301 Report highlights persistent deficiencies in intellectual property enforcement across key manufacturing regions[4]. These weaknesses have facilitated the proliferation of counterfeit racquet sports equipment, which adversely impacts legitimate manufacturers by eroding their pricing power and weakening their market positioning. Counterfeit products present dual risks: they displace legitimate revenue streams and pose safety hazards. Inferior materials used in counterfeit goods can lead to equipment failures or user injuries, further harming the reputation of the entire product category.
*Our forecasts treat driver/restraint impacts as directional, not additive. The impact forecasts reflect baseline growth, mix effects, and variable interactions.
Racket Sports Equipment Market Segment Analysis
By Product Type:
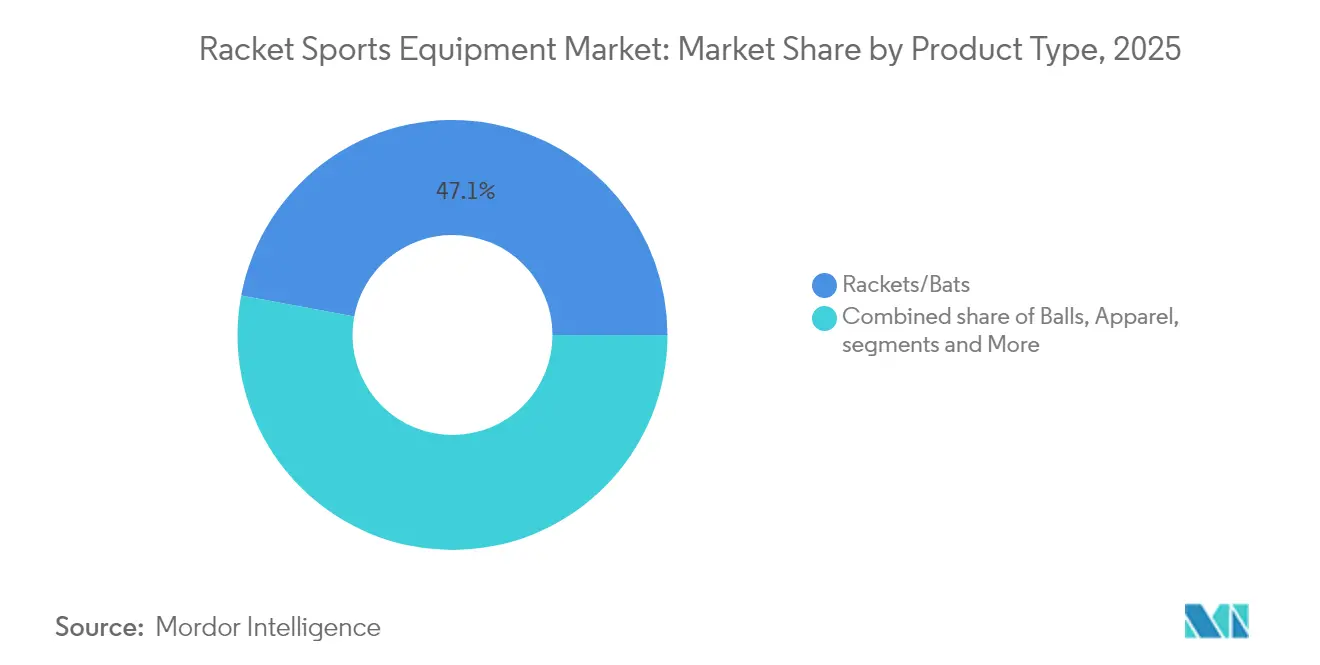
Rackets and Bats DominanceIn 2025, rackets and bats dominate the market with a 47.05% share, underscoring their pivotal role in driving market entry and forging brand-consumer relationships. Their prominence in racquet sports is evident, as the quality and performance of these tools significantly influence both player experience and competitive results. Regular replacement cycles, spurred by wear and tear, performance upgrades, and tech innovations, fuel frequent purchases, especially among dedicated players. Endorsements from professional athletes and visibility in tournaments generate aspirational demand, swaying recreational players in their equipment choices. Moreover, advancements in materials science not only facilitate continuous product differentiation but also support premium pricing strategies.
Meanwhile, bags and accessories are the market's fastest-growing segment, boasting a 7.2% CAGR through 2031. This surge signals a maturation phase, with established players broadening their portfolios beyond just rackets and balls. As consumers become more sophisticated, the integration of sports into fashion and lifestyle becomes evident, enhancing the overall experience. The segment's lower price points promote frequent purchases and gifting, while social media amplifies demand for accessories that resonate with current athletic wear trends.

By Sport Type:
Badminton LeadershipIn 2025, badminton commands a dominant 35.02% market share, bolstered by its deep-rooted cultural significance and robust infrastructure across the Asia-Pacific. Here, badminton enjoys not just widespread participation but also strong governmental backing. The sport's indoor nature allows for uninterrupted play throughout the year, irrespective of weather. Its modest space requirements make it a perfect fit for urban locales with limited outdoor facilities. Badminton's inherent technical complexity fuels a demand for specialized equipment, catering to a spectrum from casual players seeking affordable shuttlecocks to professionals investing in premium-grade rackets.
Meanwhile, other sports are witnessing the fastest growth, boasting an 7.85% CAGR. This surge is largely attributed to the rise of racquet sports like pickleball and padel. These newcomers prioritize accessibility and social interaction, diverging from the technical focus of their predecessors. They resonate with demographics often overlooked by tennis and badminton, such as older adults in search of low-impact exercise and younger enthusiasts attracted to the social scene. Their growth is underpinned by simplified rules and compact court sizes, lowering entry barriers. Additionally, the novelty of these sports garners significant media spotlight and social media buzz, fueling swift adoption. This landscape presents a golden opportunity for innovative manufacturers, allowing them to seize market share through tailored product development and focused marketing initiatives.
By End User:
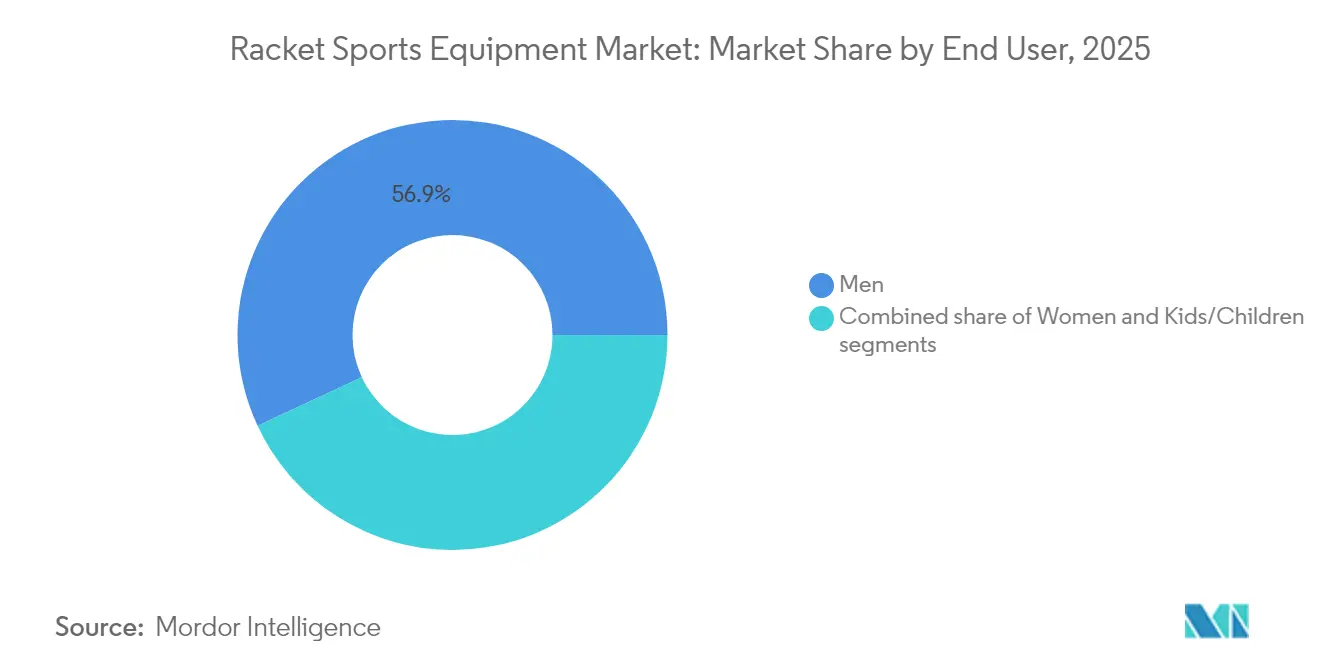
Men's Market LeadershipIn 2025, men represent 56.93% of the end-user market, a reflection of historical participation trends in racquet sports. These trends are shaped by cultural influences and greater accessibility to facilities for male players. This dominance is further reinforced by structured participation pathways, heightened visibility through professional tournaments, and robust social networks that encourage sustained involvement. Male players exhibit strong purchasing power, particularly for premium equipment and technology-driven products designed to enhance performance. Additionally, frequent equipment replacement among male participants is driven by the demands of competitive play and brand loyalty, which is often cultivated through endorsements by professional athletes and associations with major tournaments.
Kids/children constitute the fastest-growing segment, with a CAGR of 7.45%, driven by targeted youth engagement initiatives and increasing parental investment in sports development. Government programs, such as India's Khelo India Scheme, play a significant role by focusing on youth development through improved school sports programs and upgraded facilities, thereby enhancing accessibility and participation. This segment benefits from institutional purchases made by schools and sports academies, while parents prioritize high-quality and safe sports equipment for their children, often placing less emphasis on cost. Early exposure to sports fosters long-term engagement, creating a pipeline effect that sustains market demand.
By Distribution Channel:
Offline Retail DominanceIn 2025, offline retail stores captured a dominant 73.55% share of the market, underscoring the importance of hands-on equipment evaluation and professional fitting services for racquet sports enthusiasts. These physical retail spaces allow customers to assess racket weight, grip size, and string tension prior to purchase. Moreover, knowledgeable staff offer technical insights that significantly sway buying choices. Immediate product availability, coupled with services like stringing and equipment maintenance, fosters lasting customer relationships. Specialized sporting goods retailers leverage product expertise, strategic brand partnerships, and strong community ties, often supporting local sports programs and tournaments, to maintain their competitive edge.
Online retail stores are on a rapid ascent, boasting an 7.6% CAGR. This growth is fueled by digital transformation efforts and enhanced e-commerce experiences, effectively addressing traditional hurdles in sports equipment purchases. Key drivers of this online expansion include advanced product visualization technologies, comprehensive product specifications, and robust customer review systems, all aiding consumers in making informed choices without the need for physical inspection. Manufacturers, through direct-to-consumer strategies, not only retain margin control but also cultivate direct relationships with customers, bolstering brand loyalty and encouraging repeat purchases.
Geography Analysis
North America Racket Sports Equipment Market
In 2025, North America secures its position as the market leader with a 32.15% share, driven by its advanced infrastructure and well-established consumer spending patterns. These factors cater to both premium and mass-market equipment categories, ensuring a balanced market presence. While traditional segments face saturation, the region's growth is sustained by the increasing adoption of emerging sports and the integration of advanced technologies into equipment. The presence of professional tournaments, including major championships and extensive media coverage, fosters aspirational demand, influencing recreational equipment purchases and shaping brand preferences.
APAC Racket Sports Equipment Market
Asia-Pacific emerges as the fastest-growing region, recording an impressive 8.05% CAGR. This growth is fueled by comprehensive government initiatives and large-scale infrastructure development programs that establish strong institutional demand channels. In India, the Khelo India Programme, supported by substantial funding for sports infrastructure and youth development, creates structured participation pathways, driving sustained market growth across diverse demographic groups. Singapore exemplifies the region's commitment to premium market development through investments in world-class facilities, such as the Punggol Regional Sport Centre, which enhance infrastructure quality and position the country as a hub for hosting international events.
Europe Racket Sports Equipment Market
Europe demonstrates steady growth, underpinned by the increasing adoption of premium products and ongoing facility modernization efforts that cater to both traditional and emerging racquet sports. The region's strong focus on sustainability and environmental responsibility has driven demand for eco-friendly equipment and innovative materials, which often command premium pricing. Government initiatives, such as the UK's "Get Active" strategy, emphasize community engagement and improved access to sports facilities, addressing participation disparities and unlocking growth potential in underserved market segments. Additionally, Europe's inclination toward technological advancements and consumer preferences for high-quality, innovative products create opportunities for manufacturers to introduce advanced offerings.
Regulatory Landscape
Product safety and conformity requirements increasingly shape global go-to-market strategies for racket sports equipment, particularly for brands expanding online. In the European Union, the General Product Safety Regulation (GPSR), Regulation (EU) 2023/988, became applicable on December 13, 2024, tightening obligations for economic operators and affecting how equipment is risk-assessed, documented, and monitored across offline and online channels. For protective gear commonly used alongside racket sports, reference points such as ASTM International standard F3164 (racket sports eye protectors) and ISO standards covering sports eye and face protection are used by manufacturers and procurement buyers to substantiate safety claims and reduce injury-related liability exposure.
Trade policy and customs classification also influence pricing and sourcing decisions for cross-border sales of rackets and related equipment. As of April 2026, MFN duty rates referenced for badminton rackets include 4.7% in the EU, 5.6% in the United States, and 4% in the United Kingdom, while strung tennis rackets in the United States (HTS 9506.51.20.00) carry a 5.3% MFN duty rate. At the same time, tariff-policy uncertainty has been highlighted in U.S.-EU trade discussions, as cited in U.S. CRS coverage of a tariffs and trade framework (with 2025 executive actions referenced in that context). This has led manufacturers and importers to validate HTS classifications, country-of-origin documentation, and landed-cost assumptions for key markets before committing to distribution and promotional calendars.
Competitive Landscape
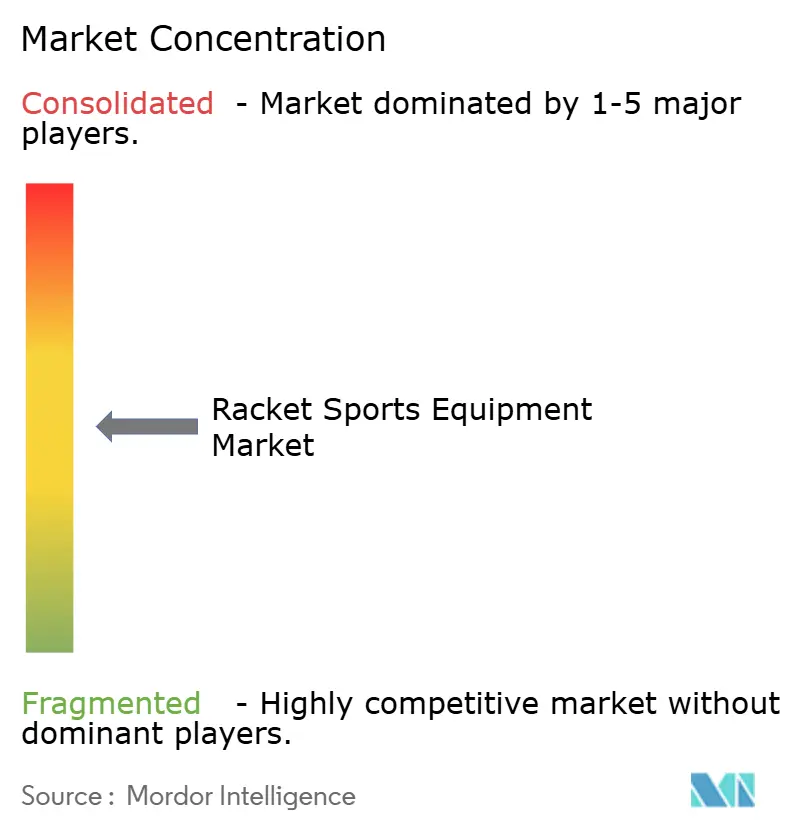
The racket sports equipment market is moderately consolidated, with a mix of regional and global players competing for market share. Prominent companies in this market include Yonex Company, Limited, Anta Sports Products Co., Ltd., HEAD Sport GmbH, and Li-Ning Company Limited. These manufacturers primarily focus on expansion and new product development as key growth strategies. They are actively innovating their product portfolios while adopting sustainable manufacturing practices, such as utilizing recycled materials in the production of rackets and other equipment essential for racket sports.
Technological advancements are transforming the competitive landscape, compelling traditional equipment manufacturers to adapt to emerging trends like smart equipment, performance analytics, and digital customer engagement platforms. These innovations are reshaping consumer expectations and driving the demand for more advanced and connected products.
Strategic partnerships and collaborative innovations are playing a pivotal role in redefining business models. For instance, advancements in material science, particularly in sustainable composites, are enabling companies to align with evolving market demands. Additionally, white-space opportunities are emerging in underserved demographics and niche sports categories, presenting avenues for growth. Supply chain innovations are further enhancing competitiveness across various sports segments by leveraging shared manufacturing capabilities and specialized expertise, which facilitate market expansion beyond traditional boundaries.
Racket Sports Equipment Industry Leaders
-
Yonex Company, Limited
-
Anta Sports Products Co., Ltd.
-
HEAD Sport GmbH
-
BABOLAT VS SAS
-
Li-Ning Company Limited
- *Disclaimer: Major Players sorted in no particular order
Racket Sports Equipment Market Companies Covered in this Report
- Yonex Company, Limited
- Anta Sports Products Co., Ltd.
- HEAD Sport GmbH
- BABOLAT VS SAS
- Li-Ning Company Limited
- Dunlop Sports Co. Ltd.,
- Authentic Brands Group LLC.
- VICTOR Rackets Industrial Corporation
- ASICS Corporation
- Diadem Sports
- Decathlon S.A.
- Nike, Inc.
- Adidas Group
- Gamma Sports, Inc.
- Harrow Sports Inc.
- STIGA Sports Group AB
- Tamasu Co., Ltd.
- Goode Sport Ltd.
- Amer Sports
- Solinco Sports
Market Opportunities and Future Outlook
Technology-enabled play and coaching are creating whitespace across equipment, facilities, and services, particularly as clubs and leagues introduce automation and analytics into training and match-day experiences. In 2026, market actions point to sustained momentum behind smart systems and data workflows: Major League Pickleball debuted automated AI line-calling technology (Owl AI) at a Carvana PPA Tour event in Zion, Utah, while SportAI acquired Padelytics to deepen biomechanical video analysis in racket-sports training. For equipment brands, these moves support bundling connected products (sensors, apps, and training integrations) with higher-frequency replacement categories such as grips, strings, and balls, alongside coordination with facility operators rolling out smart-court installations.
Capital deployment and category focus are also widening distribution and product-portfolio options across price tiers. Selkirk Sport secured a USD 30 million growth equity investment from Bluestone Equity Partners in January 2026 to fund expansion and product and technology development, and it followed with the acquisition of Bread & Butter Pickleball in May 2026 to broaden its pickleball offering and reach. Institutional programs provide additional pathways to scale, including US Squash launching an official supplier program with Harrow Sports (effective July 1, 2026) and RSPA signing a multi-year endorsement agreement with PICKLETILE for glass court enclosures, which expands the set of facility upgrades supported by the category. Taken together, these actions support opportunities for manufacturers to strengthen relationships with clubs, associations, and facility operators, and to build offerings that address safety and injury concerns through material choices and arm-friendly configurations.
Recent Industry Developments in Racket Sports Equipment Market
- May 2026: HEAD Sport GmbH was named the official exclusive ball partner for the Valencia Premier Padel P1 tournament, featuring the HEAD Padel Pro+ and Pro S+ ball models. The announcement links product performance with elite-event visibility, supporting premium positioning and repeat purchase cycles in balls and consumables.
- April 2025: Yonex signed an equipment agreement with the Badminton Confederation of Africa (BCA) in Xiamen, China, supporting badminton development initiatives across the continent. The partnership expands Yonex brand presence and can stimulate institutional and grassroots equipment demand through federation-linked programs.
- April 2024: ASTM International continued advancing standardization around racket-sport eye protection through its F3164 framework for eye protectors used in sports such as squash, racquetball, tennis, and pickleball. Standard alignment improves retailer and facility confidence in protective equipment categories and supports safety-led purchasing in organized play environments.
Racket Sports Equipment Market Report Scope and Research Methodology
Market Definition and Coverage
This market covers the sales value of equipment used to play racket sports, where demand is tied to participation, court access, and replacement cycles for key gear like rackets, balls, shoes, and related accessories.
Scope exclusions: We do not count sports apparel beyond sport-specific footwear, and we do not include venue services, coaching fees, or tournament revenues.
Segments Covered in This Report
- By Product Type
- Rackets/Bats
- Balls
- Bags and Accessories
- Apparel
- Footwear
- By Sport Type
- Lawn Tennis
- Table Tennis
- Badminton
- Other Sport Types
- By End User
- Men
- Women
- Kids/Children
- By Distribution Channel
- Offline Retail Stores
- Online Retail Stores
- By Geography
- North America
- United States
- Canada
- Mexico
- Rest of North America
- Europe
- Germany
- United Kingdom
- Italy
- France
- Spain
- Netherlands
- Poland
- Belgium
- Sweden
- Rest of Europe
- Asia-Pacific
- China
- India
- Japan
- Australia
- Indonesia
- South Korea
- Thailand
- Singapore
- Rest of Asia-Pacific
- South America
- Brazil
- Argentina
- Colombia
- Chile
- Peru
- Rest of South America
- Middle East and Africa
- South Africa
- Saudi Arabia
- United Arab Emirates
- Nigeria
- Egypt
- Morocco
- Turkey
- Rest of Middle East and Africa
- North America
Data Sources, Market Sizing, and Validation
Desk Research
Desk research was used to frame the demand pool and the practical rules for what should count as racket sports equipment spend. Public sources were reviewed to understand participation trends, facility build-outs, and international trade signals for sports goods, which helped us choose realistic growth drivers.
Common inputs came from sources such as the Sports and Fitness Industry Association (SFIA) participation summaries, International Tennis Federation and Badminton World Federation updates, and government sports and recreation statistics such as the US Census Bureau and Eurostat. For supply-side checks, we also used broad customs and trade datasets (for example, UN Comtrade), plus public company filings and investor presentations, to understand price bands, product refresh cycles, and channel mix. Where needed, we referenced paid subscriptions for company financials and news screening, patent databases for materials and sensor trends, and shipment-level import-export databases for directional cross-checks. The desk sources listed here are illustrative and not exhaustive, and other public materials were used for validation and clarification.
Primary Interviews and Surveys
Primary work focused on validating what sells in practice, at what typical price points, and how quickly purchasing shifts between specialty stores and online channels across major regions. We spoke with a mix of brand-side leaders, distributors, retailers, and sport ecosystem stakeholders, which helped tighten assumptions on replacement cycles, promotional intensity, and category overlaps. One recurring point was whether shoes are treated as sport-specific or general footwear within the equipment basket.
Distribution of primary research fieldwork respondents
| Company type | Respondent position | Region |
|---|---|---|
| Top tier: 32% | CXOs: 14% | APAC: 49% |
| Mid tier: 51% | Functional/Unit leaders: 35% | EMEA: 29% |
| Smaller Players: 17% | Managers: 51% | Americas: 22% |
Market-Sizing & Forecasting
Sizing started with a top-down build that reconstructs demand from participation by racket sport, active player base, expected replacement frequency, and an average spend per player for the equipment basket. Those demand-side totals were then checked with selective bottom-up approximations, including sampled price checks by channel, distributor sell-through discussions, and a limited roll-up of supplier revenue exposure to racket sports. This helped adjust for over-counting where categories overlap.
Key model inputs included the mix of sports (lawn tennis, table tennis, badminton, and squash), the share of sales occurring online versus physical retail, typical racket and ball replacement cycles, the attach rate of accessories like strings, grips, and bags, and the premium mix shift toward composite frames and sensor-enabled products. For forecasting, we used scenario analysis supported by a light multivariate regression approach, where participation growth, facility additions, and price inflation assumptions were stress-tested with interview feedback. When bottom-up signals were missing for smaller geographies or niche sports, gaps were handled using region-level per-player spend benchmarks and channel-normalized price bands, which were reviewed with field respondents.
Data Validation & Update Cycle
Outputs were validated through multiple checks so the totals stay consistent with real market signals. We compared the model against independent indicators such as participation trajectories, trade movement direction, and public revenue commentary, and then investigated outliers including sudden price jumps or unrealistic channel share swings.
Before sign-off, the work is reviewed in steps by another analyst, with targeted re-contacts triggered when assumptions move materially, for example when a major sport shows an unexpected demand shift. Reports are refreshed annually, and interim updates are made when a major event changes demand or pricing. Right before delivery, a final pass is completed so clients receive the most current view available.
Mordor Intelligence's Racket Sports Equipment Market Size Compared Against Other Published Estimates
Published numbers for this market can look far apart because the term equipment is used differently, and because some sources focus on revenue growth deltas rather than total spend in a specific year. Differences also come from how shoes and accessories are treated, how online pricing is averaged, and whether currency conversion timing is aligned to the same base year.
The main gap comes from category scope. Mordor Intelligence counts sport-specific shoes and core accessories inside the equipment basket, rather than limiting the value to rackets only or mixing in broader sporting goods that inflate totals.
Benchmark comparison
| Source | Market Size | Gaps in Research Methodology |
|---|---|---|
| Mordor Intelligence | USD 102.29 B (2026) | |
| Trade Journal A | USD 0.73 B (2028) | Uses a net growth figure over 2024 to 2028 rather than a single-year market value, and the category basket is not consistently defined across product types. |
| Industry Publisher B | USD 10.50 B (2024) | Appears to use a narrower equipment definition and a different base year, which can understate totals when shoes, bags, and frequent-replace accessories are excluded or priced conservatively. |
The spread in the table is largely explained by what is being measured and when it is being measured, not by a disagreement that demand exists. By keeping the equipment basket rules explicit and then checking totals against participation and channel price reality, the final number stays traceable to repeatable steps that can be revisited each update cycle.
Key Questions Answered in the Report
What is the current size of the Racquet sports equipment market?
The market generated USD 102.29 billion in 2026 and is projected to reach USD 139.69 billion by 2031.
Which product segment dominates sales?
Rackets and bats held 47.05% of 2025 revenue, making them the core purchase category.
Which region is growing the fastest?
Asia-Pacific is forecast to expand at an 8.05% CAGR due to large-scale public investment in new courts and youth programs.
How significant is online retail for racquet sports equipment?
While brick-and-mortar stores still command 73.55% of sales, online channels are climbing at 7.6% CAGR as virtual fitting tools improve.