QR Codes Market Size and Share
Market Overview
| Study Period | 2020 - 2031 |
|---|---|
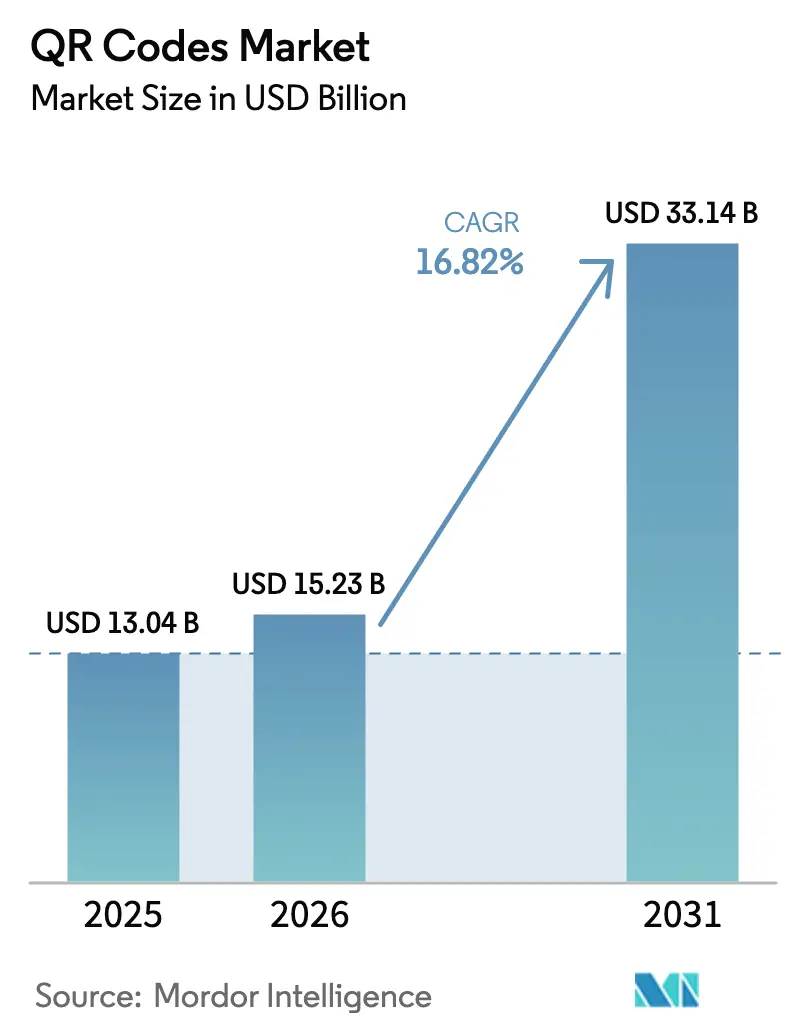
| Market Size (2026) | USD 15.23 Billion |
| Market Size (2031) | USD 33.14 Billion |
| Growth Rate (2026 - 2031) | 16.82% CAGR |
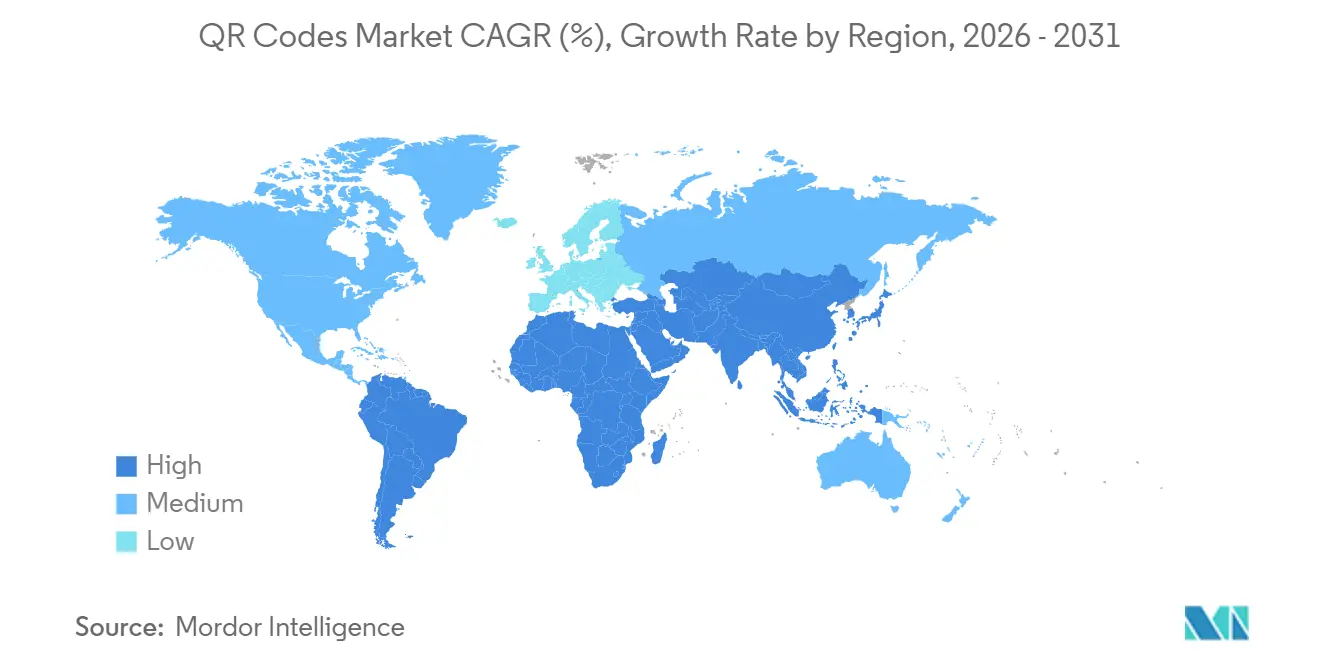
| Fastest Growing Market | Asia Pacific |
| Largest Market | Asia Pacific |
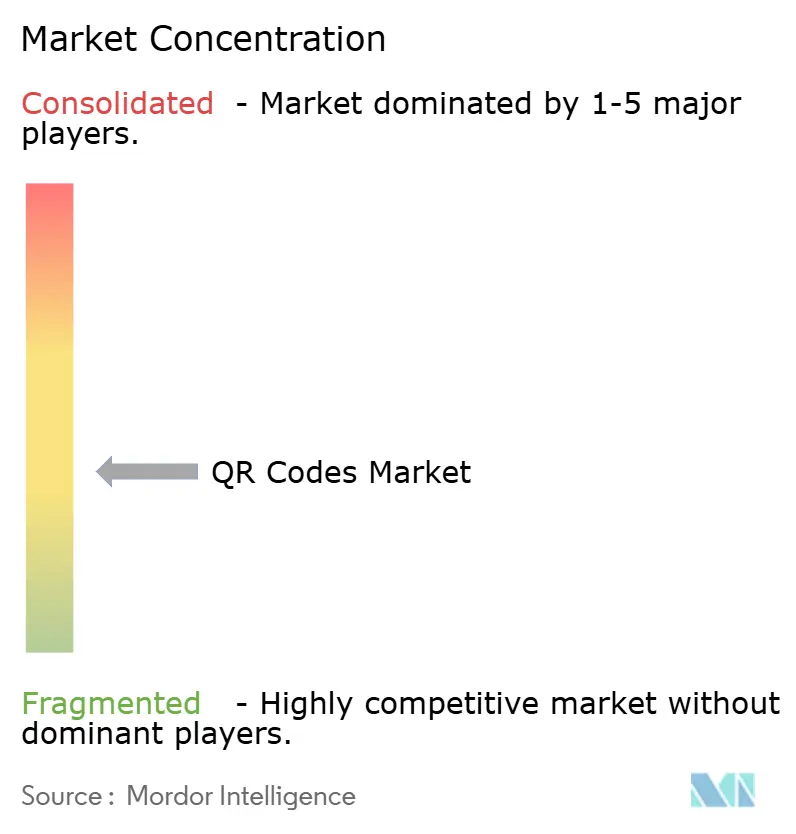
| Market Concentration | Medium |
Major Players *Disclaimer: Major Players sorted in no particular order Image © Mordor Intelligence. Reuse requires attribution under CC BY 4.0. | |
QR Codes Market Analysis by Mordor Intelligence
The QR codes market size is projected to expand from USD 13.04 billion in 2025 and USD 15.23 billion in 2026 to USD 33.14 billion by 2031, registering a 16.82% CAGR between 2026 to 2031. Broad-based momentum comes from contactless payment habits formed during pandemic recovery, now reinforced by digital passport and pharmaceutical serialization rules that embed scannable codes into everyday compliance workflows. Asia-Pacific remains the revenue anchor as India’s UPI rail and China’s Alipay-plus ecosystem normalize QR checkout for hundreds of millions of shoppers. Enterprises worldwide are migrating from static to dynamic codes to gain campaign editability, first-party analytics, and privacy-control triggers, while regulators are hard-coding two-dimensional barcodes into sustainability, traceability, and safety statutes. Competition is still moderate because open-source libraries reduce switching costs, yet a handful of enterprise platforms are scaling through API bundling, ISO-27001 hosting, and AI-driven design tools, gradually consolidating the QR codes market.
Key Report Takeaways
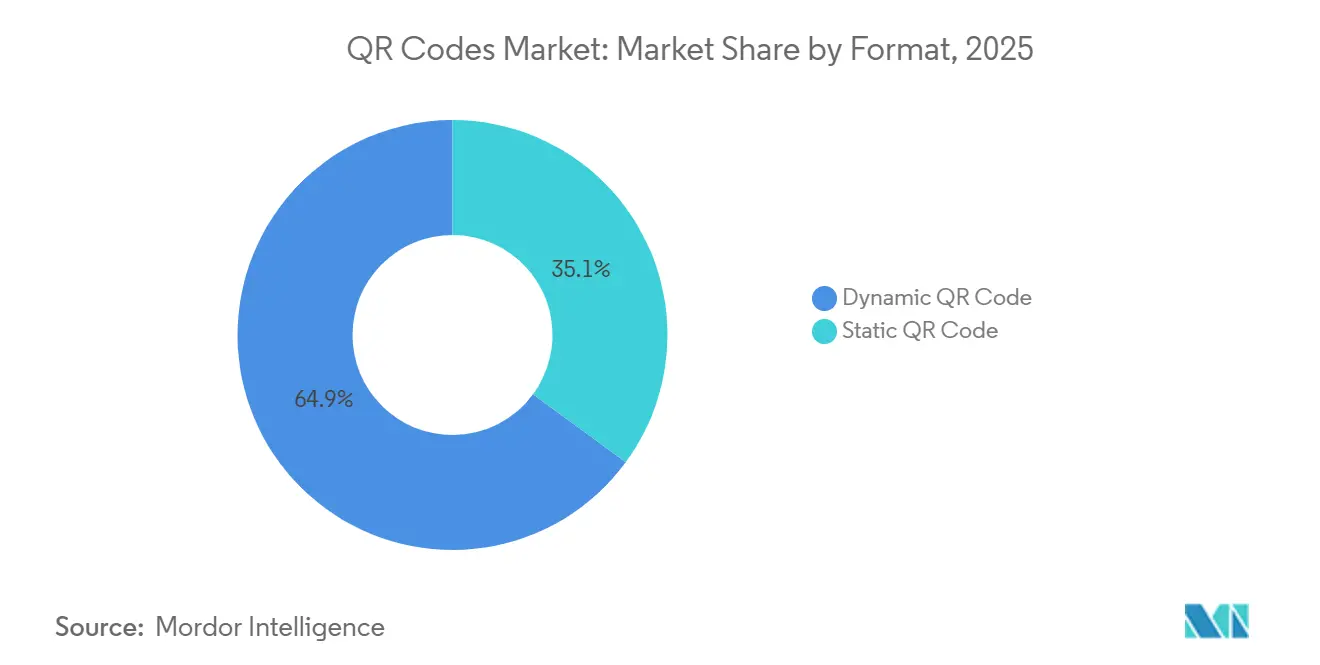
- By format, dynamic QR codes led with 64.92% revenue share in 2025, while static alternatives are forecast to trail far behind as dynamics advance at a 17.27% CAGR to 2031.
- By end-user application, payments and transactions held 45.19% of 2025 revenue, whereas marketing and advertising is set to expand fastest at an 18.16% CAGR through 2031.
- By payment model, push-payment codes commanded a 58.67% share in 2025; pull-payment codes are projected to post a 17.24% CAGR through 2031.
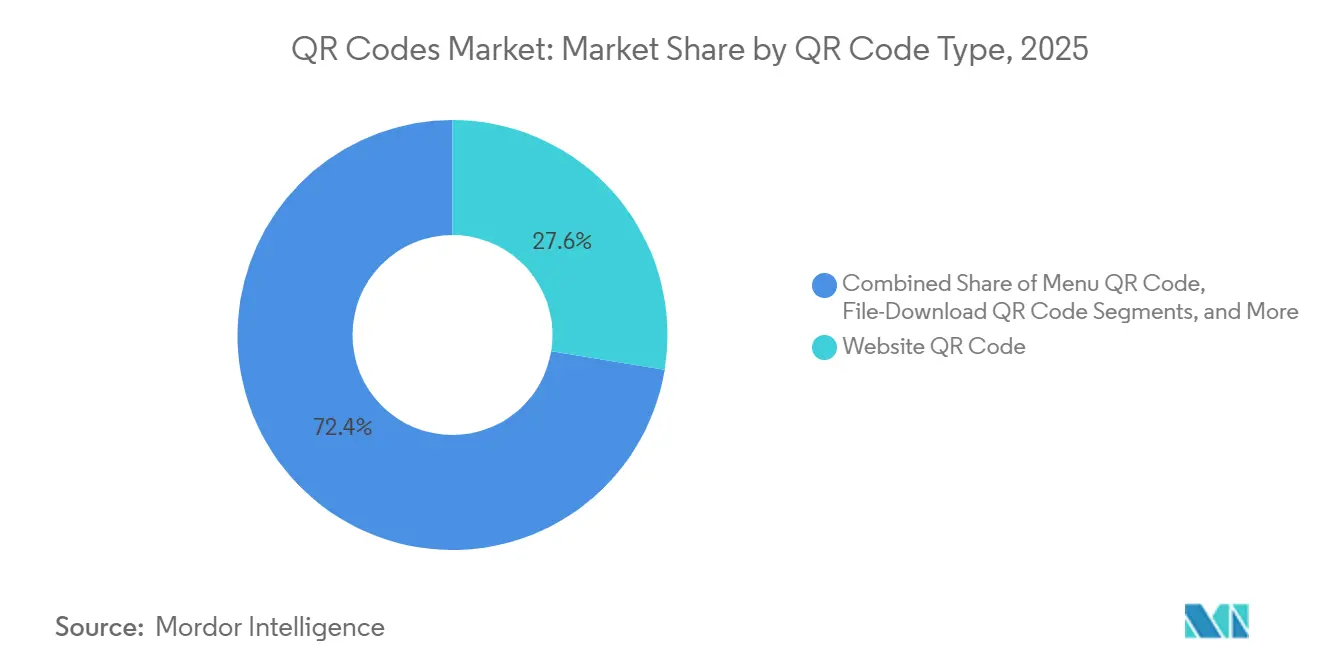
- By code type, website codes captured a 27.59% share in 2025, but app-store codes are poised to grow at a 19.43% CAGR as brands shortcut browser friction.
- By geography, Asia-Pacific delivered 37.59% of global revenue in 2025 and is positioned to compound at an 18.16% CAGR to 2031.
Note: Market size and forecast figures in this report are generated using Mordor Intelligence’s proprietary estimation framework, updated with the latest available data and insights as of 2026.
Global QR Codes Market Trends and Insights
Drivers Impact Analysis*
| Driver | (~) % Impact on CAGR Forecast | Geographic Relevance | Impact Timeline |
|---|---|---|---|
| Exploding UPI and Alipay-style QR payments in Asia | +3.2% | Asia-Pacific core, spillover to Middle East and Africa | Medium term (2-4 years) |
| EU Digital Product Passport mandate fueling embedded-QR labeling | +2.1% | Europe, early adoption in Germany, France, Netherlands | Medium term (2-4 years) |
| U.S. FDA DSCSA serialization deadline boosting pharma traceability QR | +1.8% | North America, secondary impact in regulated export markets | Short term (≤ 2 years) |
| GCC tourism push driving multilingual QR menu adoption | +1.3% | Middle East, spillover to North Africa | Short term (≤ 2 years) |
| GenAI-led personalized dynamic QR campaigns for retail loyalty | +2.4% | Global, early gains in North America, Europe, urban Asia-Pacific | Medium term (2-4 years) |
| Carbon-footprint disclosure labels switching to QR | +0.9% | Europe and North America | Long term (≥ 4 years) |
| Source: Mordor Intelligence | |||
Exploding UPI And Alipay-Style QR Payments In Asia
Interoperable instant-payment rails have turned India and China into proof points for large-scale QR adoption. India processed 16.7 billion UPI transactions in December 2024, with merchant-displayed codes dominating small-ticket sales, a use case now spilling into the Middle East and Africa.[1]National Payments Corporation of India, “UPI Product Statistics,” npci.org.in Alipay-plus extended acceptance to 90 foreign markets by late 2025, and WeChat Pay mirrored the strategy by embedding cross-border settlement inside its mini-program framework. Regulators such as the Reserve Bank of India mandated interoperable formats, breaking proprietary silos and accelerating micro-merchant uptake.[2]Reserve Bank of India, “Interoperable QR Code Standards,” rbi.org.in The network effect entices acquirers and wallet providers to converge on a single scannable standard, reinforcing growth across the QR codes market.
EU Digital Product Passport Mandate Fueling Embedded-QR Labeling
Regulation 2024/1781 obliges European manufacturers to attach machine-readable carriers, explicitly including QR codes, to batteries, textiles, and electronics by 2027, linking every item to a cloud-hosted passport that discloses material composition and end-of-life guidance. Exporters targeting the single market must comply, effectively globalizing the labeling model. Early movers in automotive and consumer electronics now laser-etch durable codes onto housings and demand 99.9% uptime from QR-hosting vendors, driving enterprise platform contracts across the QR codes market. As deadlines approach, packaging-line retrofits and serialization software upgrades are turning what began as a compliance expense into a strategic visibility layer.
GenAI-Led Personalized Dynamic QR Campaigns For Retail Loyalty
Marketers are harnessing large-language-model and computer-vision APIs to auto-generate QR creatives tuned to demographics, location, and time of day.[3]Flowcode, “Flowcode Platform and AI QR Generator,” flowcode.com AI engines test color palettes, call-to-action copy, and landing-page variants, then swap destinations in real time without reprinting physical media. This ability cuts deployment cycles from days to minutes and elevates conversion metrics, prompting retailers and consumer-goods firms to shift budgets from static print to dynamic QR placements. The loop between offline scan analytics and online personalization strengthens first-party data strategies, embedding QR capabilities deeper into marketing stacks and expanding the addressable QR codes market.
U.S. FDA DSCSA Serialization Deadline Boosting Pharma Traceability QR
Pharmaceutical producers met the November 2024 DSCSA requirement by encoding National Drug Code, serial number, lot, and expiry into two-dimensional barcodes on every unit. Distributors verify each handoff, creating an auditable chain that deters counterfeits. Hospitals have since reused the same QR for bedside validation, while insurers pilot prior-authorization forms that auto-populate when a pharmacist scans the code. The rule delivered immediate North American revenue for industrial printers, vision systems, and secure QR platforms, and now influences proposals in Europe and Japan, widening the regulatory footprint that supports the QR codes market.
Restraints Impact Analysis*
| Restraint | (~) % Impact on CAGR Forecast | Geographic Relevance | Impact Timeline |
|---|---|---|---|
| Deep-fake phishing via look-alike QR codes | -1.4% | Global, acute in North America, Europe, urban Asia-Pacific | Short term (≤ 2 years) |
| Fragmented national standards restrain market growth | -0.8% | Latin America, Africa, Southeast Asia | Medium term (2-4 years) |
| Apple or Google tap-to-pay cannibalizing low-value QR transactions | -1.9% | North America, Europe, high-income Asia-Pacific | Medium term (2-4 years) |
| GDPR and CCPA limits on first-party data in dynamic QR | -1.1% | Europe and U.S. states adopting privacy statutes | Long term (≥ 4 years) |
| Source: Mordor Intelligence | |||
Apple Or Google Tap-To-Pay Cannibalizing Low-Value QR Transactions
Wallet apps now preload NFC credentials on millions of smartphones, letting consumers hover devices at terminals without scanning a code.[4]Apple, “Tap to Pay on iPhone,” apple.com In mature card markets, merchants already invested in contactless hardware see little incentive to add QR signage, creating a substitution threat for the QR codes market. Google’s Wallet expansion into transit and ticketing deepens NFC entrenchment. Nonetheless, QR remains cheaper for micro-merchants lacking terminals, especially across Asia and South America, mitigating but not nullifying the restraint.
Deep-Fake Phishing Via Look-Alike QR Codes
Security vendors logged a fivefold rise in “quishing” attacks that overlay counterfeit stickers on parking meters and restaurant tables, funneling users to credential-harvest sites. Microsoft now parses embedded URLs inside email-attached QR images to flag suspect domains. Enterprises deploy preview apps that show landing pages before navigation, yet consumer wariness slows spontaneous scanning. Trust degradation, if unaddressed, could shave growth from tourism and hospitality deployments inside the QR codes market.
*Our updated forecasts treat driver/restraint impacts as directional, not additive. The revised impact forecasts reflect baseline growth, mix effects, and variable interactions.
Segment Analysis
By QR Code Type: App-Store Codes Gain Momentum As Brands Skip Browsers
Website codes contributed 27.59% of 2025 revenue, underscoring their ubiquity across print ads, packaging, and event signage, yet app-store codes are expanding at a 19.43% CAGR as mobile-first brands chase direct-to-app installs. The ability to bypass a webpage trims drop-off rates by up to 40%, a performance edge that has major retailers shifting budget toward scannable app-delivery assets. Dynamic generators now bundle A/B testing, location targeting, and aesthetic templates, giving creative teams near-real-time agility.
Generative-AI engines further compress launch timelines, crafting code layouts that resonate with niche cohorts in specific neighborhoods or transit lines. As a result, app-store codes are expected to chip away at the website-code lead, especially in entertainment, food delivery, and fintech verticals where app funnel efficiency defines customer-acquisition cost. The QR codes market size allocated to code-generation software is therefore tilting toward platforms that specialize in mobile-install journeys.


By Payment Type: Pull Codes Accelerate In Recurring-Billing Use Cases
Push-payment flows dominated with a 58.67% share in 2025, reflecting merchants’ comfort with shopper-initiated scans that leave liability with the payer’s bank. Even so, utilities, subscription software, and insurers now embed pull-payment QR requests inside statements, propelling pull codes at a 17.24% CAGR. Brazil’s PIX and Argentina’s interoperable standards showcase how pull models shrink invoice errors and cut reconciliation time.
Regulators evaluating least-cost routing could further tilt adoption. Block’s 2025 submission urged Australia’s central bank to let merchants route pull-QR rails around card interchange, promising savings that would widen acceptance. Should similar reforms spread, the QR codes market share attached to pull flows will rise, carving a durable niche alongside entrenched push transactions.
By Format: Dynamic Codes Cement Leadership Through Real-Time Control
Dynamic codes controlled 64.92% of 2025 format revenue and should keep widening the gap, given their editability and scan analytics. Enterprises run national campaigns months before launch, yet change offers nightly; dynamic redirect layers make that possible without reprinting assets. They also simplify GDPR erasure requests, an edge that static codes cannot counter.
Static formats linger in low-budget contexts such as business cards and permanent signage. Price compression in cloud storage, however, narrows the cost differential, nudging even small businesses toward dynamic options. Integrations with CRM and marketing-automation suites strengthen the value proposition and expand the QR codes market size captured by SaaS vendors.
By End-User Application: Marketing And Advertising Race Ahead
Payments kept a 45.19% share in 2025 thanks to Asia-Pacific transaction volumes, but marketing codes are pacing the field at an 18.16% CAGR. Offline media, billboards, packaging, and transit ads, now carry scannable calls to action that tie directly into digital funnels, providing long-sought attribution clarity. Fortune 500 advertisers employ AI engines to rotate offers, images, and destinations based on scan-rate feedback, deepening engagement.
Loyalty programs leverage QR to bridge identity across channels, letting shoppers bank rewards with a quick scan instead of card swipes. Hospitality players embed menus, order-and-pay functions, and survey links into a single codebase, stitching together customer journeys. This utility, paired with escalating acquisition costs on crowded online channels, keeps funneling spend toward scannable experiences, bolstering the QR codes market.
Geography Analysis
Asia-Pacific remains the epicenter, delivering 37.59% of global 2025 revenue and tracking an 18.16% CAGR through 2031. China’s unified clearing protocol, India’s interoperability standard, and Southeast Asia’s cross-wallet alignment provide a fertile landscape where QR is the lowest-cost acceptance rail. High smartphone penetration and government digital-identity programs further accelerate uptake across retail, transit, and public-service sectors.
North America and Europe post steadier gains. The U.S. FDA’s serialization rule and the European Union’s product-passport mandate inject compliance-driven volume into packaging and label substrates, sustaining printer and software demand even where NFC shields most consumer payments. Canada and several EU states also tap QR for real-time carbon-footprint disclosure, extending utility beyond checkout.
South America surprises on the upside. Brazil’s PIX processed 6.3 billion March 2025 transactions, 41% via QR, while Argentina logged 62.6 million December 2024 scans. Central banks across the region now harmonize instant-payment rails around QR as a shared front end, a policy trend that shortens time-to-scale. The Middle East accelerates on tourism goals, mandating multilingual menus and business-license verification through QR, while Africa tests interoperable pilots, though smartphone costs temper near-term volumes.

Competitive Landscape
The QR codes market hosts a long tail of open-source tools, yet enterprise buyers gravitate to platforms that bundle security certifications, uptime SLAs, and AI design suites. Flowcode claims service to more than 70% of Fortune 500 firms and over 500 million generated codes, differentiating via an AI generator that personalizes creative and geo-fences campaigns. Uniqode, rebranded from Beaconstac, reports 50,000 customers and deep integrations into Salesforce and HubSpot, reframing QR as a first-party data gateway.
Payment giants pursue interoperability: Visa, Mastercard, UnionPay, and Alipay-plus allow a single merchant placard to accept multiple wallets, lowering acceptance friction. Compliance-centric niches are emerging, where manufacturers demand tamper-evident encoding, blockchain provenance logs, and guaranteed archival for 10-plus years to meet regulatory proof burdens. Security providers layer biometric confirmation atop scans to thwart phishing, while cloud-hosting partners race to certify under ISO 27001 and SOC 2, reinforcing barriers to entry for newcomer SaaS vendors.
Platform consolidation is expected as regulated industries prefer vendors with end-to-end toolchains that span code creation, scan analytics, and privacy management. Open-source libraries will persist for hobbyists, yet enterprise features such as role-based access control and automated GDPR compliance give commercial suites an edge, tilting revenue toward a cadre of well-capitalized providers inside the QR codes market.
QR Codes Industry Leaders
PayPal Holdings, Inc.
UnionPay International Co., Ltd.
Nearex Pte Ltd.
QR Code Kit Inc.
Adobe Inc.
- *Disclaimer: Major Players sorted in no particular order

Recent Industry Developments
- January 2026: Ant Group expanded Alipay-plus QR acceptance to 95 markets and began pilot support for offline-to-online loyalty transfers in Japan.
- August 2025: Block submitted its least-cost routing proposal to the Reserve Bank of Australia, positioning pull-payment QR codes as an interchange-free option for small merchants.
- May 2025: Brazil’s central bank announced 6.3 billion PIX transactions in the month, with 41% initiated through QR codes.
- January 2025: Flowcode surpassed 500 million codes generated and rolled out AI-assisted creative testing across its enterprise client base.


Global QR Codes Market Report Scope
The QR Codes Market Report is Segmented by QR Code Type (Website, Menu, File-Download, Social-Media, App-Store, Other Types), Payment Type (Push Payment, Pull Payment), Format (Static, Dynamic), End-User Application (Payments and Transactions, Marketing and Advertising, Information Sharing, Customer Engagement and Loyalty, Other Applications), and Geography (North America, Europe, Asia-Pacific, South America, Middle East, Africa). The Market Forecasts are Provided in Terms of Value (USD).
| Website QR Code |
| Menu QR Code |
| File-Download QR Code |
| Social-Media QR Code |
| App-Store QR Code |
| Other Types |
| Push Payment |
| Pull Payment |
| Static QR Code |
| Dynamic QR Code |
| Payments and Transactions |
| Marketing and Advertising |
| Information Sharing |
| Customer Engagement and Loyalty |
| Other End-User Applications |
| North America | United States |
| Canada | |
| Mexico | |
| Europe | United Kingdom |
| Germany | |
| France | |
| Spain | |
| Rest of Europe | |
| Asia-Pacific | China |
| India | |
| Japan | |
| South Korea | |
| Rest of Asia-Pacific | |
| South America | Brazil |
| Argentina | |
| Rest of South America | |
| Middle East | Saudi Arabia |
| United Arab Emirates | |
| Rest of Middle East | |
| Africa | South Africa |
| Nigeria | |
| Rest of Africa |
| By QR Code Type | Website QR Code | |
| Menu QR Code | ||
| File-Download QR Code | ||
| Social-Media QR Code | ||
| App-Store QR Code | ||
| Other Types | ||
| By Payment Type | Push Payment | |
| Pull Payment | ||
| By Format | Static QR Code | |
| Dynamic QR Code | ||
| By End-User Application | Payments and Transactions | |
| Marketing and Advertising | ||
| Information Sharing | ||
| Customer Engagement and Loyalty | ||
| Other End-User Applications | ||
| By Geography | North America | United States |
| Canada | ||
| Mexico | ||
| Europe | United Kingdom | |
| Germany | ||
| France | ||
| Spain | ||
| Rest of Europe | ||
| Asia-Pacific | China | |
| India | ||
| Japan | ||
| South Korea | ||
| Rest of Asia-Pacific | ||
| South America | Brazil | |
| Argentina | ||
| Rest of South America | ||
| Middle East | Saudi Arabia | |
| United Arab Emirates | ||
| Rest of Middle East | ||
| Africa | South Africa | |
| Nigeria | ||
| Rest of Africa | ||


Key Questions Answered in the Report
How fast is the QR codes market expected to grow through 2031?
It is projected to expand from USD 15.23 billion in 2026 to USD 33.14 billion by 2031, registering a 16.82% CAGR.
Which region generates the largest revenue from QR codes?
Asia-Pacific accounted for 37.59% of 2025 revenue and is forecast to remain the largest contributor through 2031.
What segment leads the QR codes market by format?
Dynamic codes led with a 64.92% share in 2025 and continue to widen their lead due to editability and analytics.
Why are marketing applications gaining ground on payment QR codes?
Generative-AI personalization and offline-to-online attribution are driving an 18.16% CAGR for marketing and advertising uses.
What security risk threatens QR adoption?
Deep-fake phishing, where attackers overlay counterfeit codes, is eroding consumer trust and has prompted new preview and detection tools.
How concentrated is competition among QR platform vendors?
The top five providers control about 40% of revenue, indicating a moderately fragmented landscape that still favors specialized entrants.
Page last updated on:


