
Qatar Used Car Market Size and Share
Market Overview
| Study Period | 2020 - 2031 |
|---|---|
| Forecast Data Period | 2026 - 2031 |
| Base Year Market Size (2025) | USD 623.66 Million |
| Market Size (2026) | USD 668.64 Million |
| Market Size (2031) | USD 946.96 Million |
| Growth Rate (2026 - 2031) | 7.21 % |
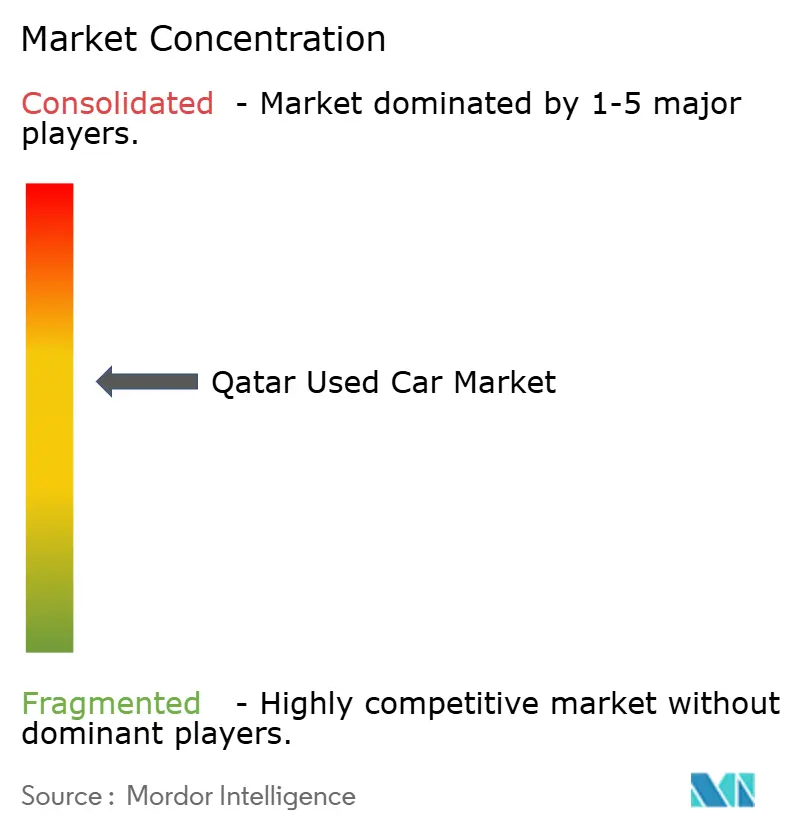
| Market Concentration | Medium |
Major Players *Disclaimer: Major Players sorted in no particular order Image © Mordor Intelligence. Reuse requires attribution under CC BY 4.0. | |
Qatar Used Car Market Analysis by Mordor Intelligence
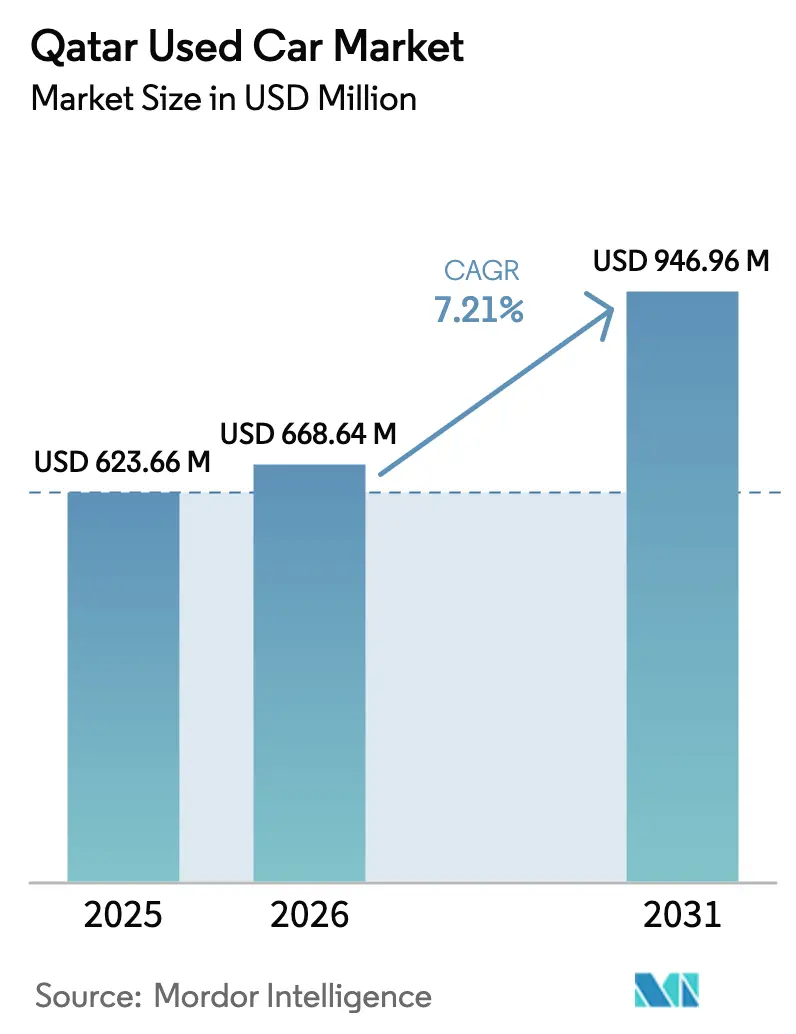
Qatar used car market size in 2026 is estimated at USD 668.64 million, growing from 2025 value of USD 623.66 million with 2031 projections showing USD 946.96 million, growing at 7.21% CAGR over 2026-2031. This expansion unfolds against Qatar’s Third National Development Strategy, which promotes private-sector growth and sustainable mobility[1] International Monetary Fund, “Qatar Article IV Consultation—Staff Report,” imf.org. Digitized customs procedures introduced under the Integrated GCC Customs Tariff in January 2025 improve vehicle traceability, cutting clearance time and reinforcing buyer confidence[2]General Authority of Customs, “Integrated GCC Customs Tariff 2025,” customs.gov.qa. Currency stability—anchored by the Qatar Central Bank’s decades-old peg of QR 3.64 per USD - gives importers and financiers predictable cost structures. Meanwhile, steady 2% real GDP growth projected for 2025 underpins consumer spending power, while moderating 1% inflation preserves real wages. Digital platforms such as Q Motor shorten sales cycles, organized vendors capitalize on financing tie-ups, and a wave of low-mileage hybrids released from electrifying government fleets enlarges the pool of near-new inventory.
Key Report Takeaways
- By vehicle type, Sport Utility Vehicles dominated the Qatar used car market, holding a 49.08% share in 2025. SUVs are projected to grow at a robust 10.11% CAGR through 2031.
- By vendor type, the unorganized channel led the Qatar used car market with a 58.77% share in 2025. Meanwhile, the organized channel is expected to expand at an 8.41% CAGR, continuing through 2031.
- The petrol segment secured a 53.41% share of Qatar's used car market by fuel type in 2025. In contrast, battery electric vehicles are anticipated to surge, boasting a projected 14.52% CAGR over the forecast period.
- By sales channel, offline outlets held a 55.92% share of the Qatar used car market in 2025. However, online platforms are poised for significant growth, with a 13.35% CAGR expected from 2026 to 2031.
- By vehicle age, vehicles aged 3-5 made up 30.86% of the Qatar used car market in 2025. In contrast, vehicles aged 0-2 are forecasted to grow at a 9.18% CAGR through 2031.
- By price band, vehicles between USD 11,000 and USD 20,600 dominated the Qatar used car market in 2025. Meanwhile, vehicles priced above USD 41,000 are projected to see an 8.28% CAGR increase.
- By city, Doha commanded a significant 78.62% share of the Qatar used car market in 2025, while Al Rayyan is set to experience the fastest growth, projected at a 6.60% CAGR through 2031.
Note: Market size and forecast figures in this report are generated using Mordor Intelligence’s proprietary estimation framework, updated with the latest available data and insights as of 2026.
Expected changes in Qatar many a times form part of a broader pattern of global movement rather than an isolated trend. The report on worldwide used car market outlook by Mordor Intelligence brings these expectations together.
Qatar Used Car Market Trends and Insights
Drivers Impact Analysis*
| Driver | (~) % Impact on CAGR Forecast | Geographic Relevance | Impact Timeline |
|---|---|---|---|
| Digital Retail Platforms | +1.8% | Doha and Al Rayyan | Short term (≤ 2 years) |
| Rising Expat Turnover | +1.5% | Nationwide, highest in Doha | Medium term (2–4 years) |
| Sharia-Compliant Financing Access | +1.2% | Urban centers nationwide | Medium term (2–4 years) |
| High Residual Value of Asian SUVs | +0.9% | Al Rayyan and suburban areas | Long term (≥ 4 years) |
| Government Inspection Centres | +0.8% | Major cities nationwide | Short term (≤ 2 years) |
| Taxi-Fleet Hybrid Influx | +0.6% | Doha metro area, expanding | Medium term (2–4 years) |
| Source: Mordor Intelligence | |||
Digital-First Retail Platforms Accelerate Price Discovery and Inventory Turnover
Large classifieds such as Q Motor—drawing 500,000 monthly users—have moved the Qatar used car market toward transparent pricing and faster deal closure. Integrated inspection, warranty, and financing modules inside the app reduce friction for sellers and buyers alike. Improved data quality under the 12-digit customs codes introduced in 2025 lets platforms publish granular specs, supporting fair valuations and lowering dispute risk. With smartphone penetration topping 100% of residents, online reach now eclipses roadside dealer traffic, giving organized players scale economies that unorganized lots cannot match.
Growing Expatriate Population Shortens Ownership Cycles
Contract-based professionals often change cars every three to five years, recycling well-maintained stock into the Qatar used car market. The IMF expects real GDP to keep rising by 2% in 2025, sustaining job creation in non-hydrocarbon sectors and bringing new arrivals who favor late-model vehicles over older imports. A regulatory cap that bars imports older than five years compresses vehicle life cycles further, pushing demand toward younger inventory.
Wider Access to Sharia-compliant Used-car Financing
Banks such as Qatar Islamic Bank, whose ‘A’ rating was reaffirmed in July 2024, now bundle Murabaha contracts with dealer platforms, lowering down-payment hurdles for observant buyers. Competitive flat rates beginning near 3% and terms up to five years make organized vendors that can embed financing in the sale more attractive than cash-only roadside traders.
Japanese & Korean SUVs Retain Residual Value
Asian SUVs outperform rivals in Qatar’s hot climate regarding reliability, support higher resale prices, and encourage first-time buyers to pay a small premium upfront. A 5% uniform import duty plus a five-year age ceiling limits the supply of these models, further propping up prices. As government fleets phase in hybrids, gently-used Toyota and Kia SUVs filter into the secondary channel, enhancing stock depth without sacrificing margins[3]U.S. Department of Commerce, “Qatar—Automotive,” trade.gov.
Restraints Impact Analysis*
| Restraint | (~) % Impact on CAGR Forecast | Geographic Relevance | Impact Timeline |
|---|---|---|---|
| Chinese Brand Promotions Reduce Used-Car Appeal | -1.4% | National, with strongest impact in price-sensitive segments | Short term (≤ 2 years) |
| High Lending Rates Increase Ownership Costs | -1.1% | National, affecting middle-income segments disproportionately | Medium term (2-4 years) |
| Import Cap on 8+ Year Vehicles Limits Budget Supply | -0.8% | National, particularly affecting budget-conscious buyers | Long term (≥ 4 years) |
| Qataris Prefer First-Owner Vehicles | -0.6% | Concentrated in affluent areas of Doha and Al Rayyan | Long term (≥ 4 years) |
| Source: Mordor Intelligence | |||
Aggressive Promotion of New Chinese Brands Narrows Used-car Price Gap
Cut-price launches bundled with lengthy warranties pull value-focused shoppers toward showroom-fresh vehicles. Chinese OEMs leverage the same 5% duty that applies to all imports yet undercut late-model used cars, squeezing dealer spreads. Their portfolio of small EVs also aligns with state green-mobility goals, further challenging conventional petrol offerings.
High Bank Lending Rates Inflate Total Cost of Ownership
Despite respectable banking liquidity, commercial lending costs remain elevated. Middle-income expatriates who finance purchases face higher monthly outlays, curbing demand in the Qatar used car market. Islamic lenders mitigate the pain, yet cannot completely offset tightening credit standards prompted by rising sector non-performing loans.[4] International Monetary Fund, “Qatar Article IV Consultation—Staff Report,” imf.org
*Our forecasts treat driver/restraint impacts as directional, not additive. The impact forecasts reflect baseline growth, mix effects, and variable interactions.
Segment Analysis
By Vehicle Type: SUVs Leads the Market and Demand Surges
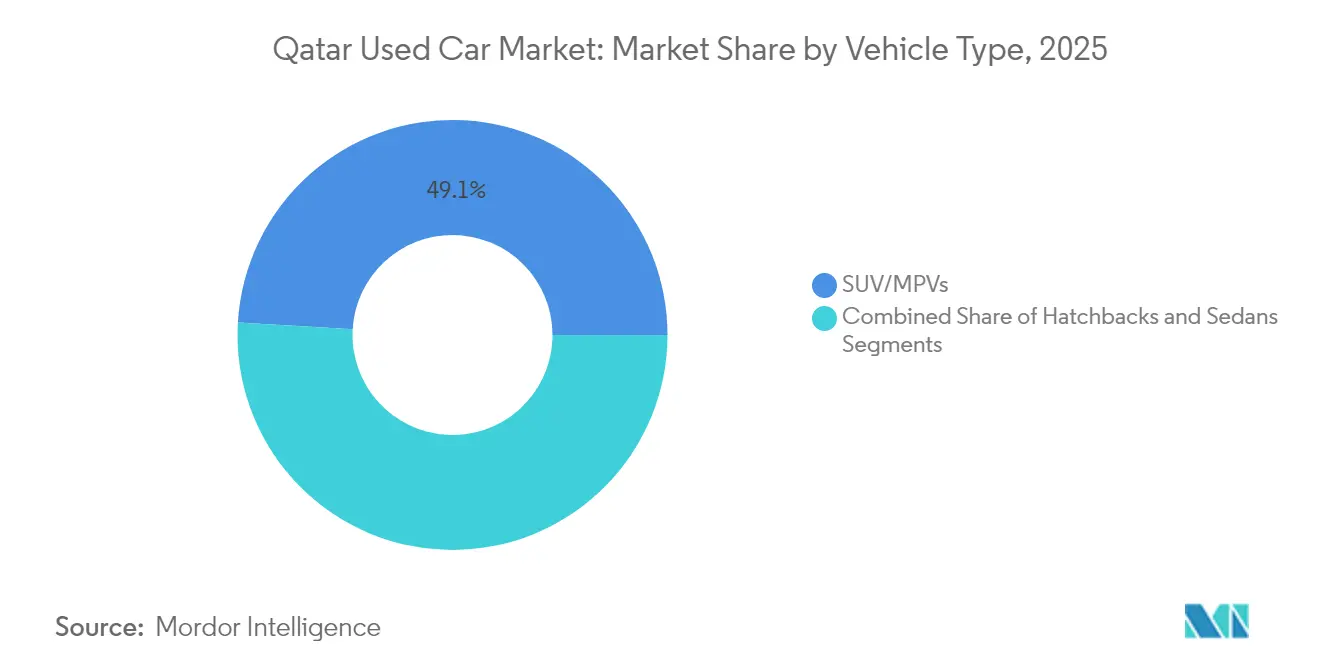
SUVs commanded 49.08% of the Qatar used car market share in 2025, due to their maneuverability and lower running costs in dense Doha traffic. However, SUVs capture mindshare and are projected to expand at a 10.11% CAGR to 2031, buoyed by suburban migration into Al Rayyan and a cultural preference for higher-riding vehicles. This trend ensures the Qatar used car market size allocated to SUVs will outpace every other body style through the forecast window.
Compact sedans cater to families balancing affordability and cabin space, but their pie stabilizes rather than grows. Luxury SUVs maintain price resilience because of robust residual values, while micro-imports such as kei-class cars remain niche, hampered by limited service coverage.


By Vendor Type: Unorganized Dealers Extend their Lead
With a 58.77% grip on the Qatar used car market size in 2025, unorganized vendors exploit omnichannel tactics, and the organized channel is expected to grow with a CAGR of 8.41%. Digital storefronts steer traffic to air-conditioned showrooms where inspection reports and warranty add-ons close the sale. As quality-testing centers roll out nationwide, unorganized sellers lose a key point of differentiation-under-pricing-because buyers place a premium on certified condition.
Semi-organized independents, often single-location operators, ride the certification wave by affiliating with inspection labs, while roadside lots face higher compliance costs. Financing tie-ups further tilt the field: organized networks can approve loans in hours, a service street-corner dealers cannot replicate.
By Fuel Type: Electric Momentum Quickens
Petrol units still held a 53.41% of the Qatar used car market share in 2025, but electric cars headline growth at a 14.52% CAGR as public EV chargers proliferate. The Qatar used car industry feels the pull of policy targets that require all public transport to be eco-friendly by 2030, spurring private curiosity about EVs. Late-model hybrids released from taxi fleets give price-sensitive users an entrée into electrified powertrains.
Diesel drops in relevance, hurt by tighter emissions standards and higher maintenance bills. LPG/CNG remains confined to fleet buyers. As battery prices fall and charging spreads beyond the Pearl Island, pure EVs gain momentum yet remain a premium choice because of high upfront costs.
By Vehicle Age: Young Stock Dominates Turnovers
Vehicles aged 3-5 years delivered 30.86% of the Qatar used car market share in 2025, underscoring a preference for relatively new units with factory warranty remaining. 0-2-year models are forecast to post a 9.18% CAGR, lifted by expatriates’ short assignment cycles and constrained import rules that cap the supply of older cars. Cars 6-8 years old draw budget-conscious buyers, but looming proposals prohibiting imports above eight years could crimp availability. Over-eight-year units will likely become scarce, supporting price floors yet limiting volume potential in the Qatar used car market.
By Price Band: Middle Tier Anchors Demand
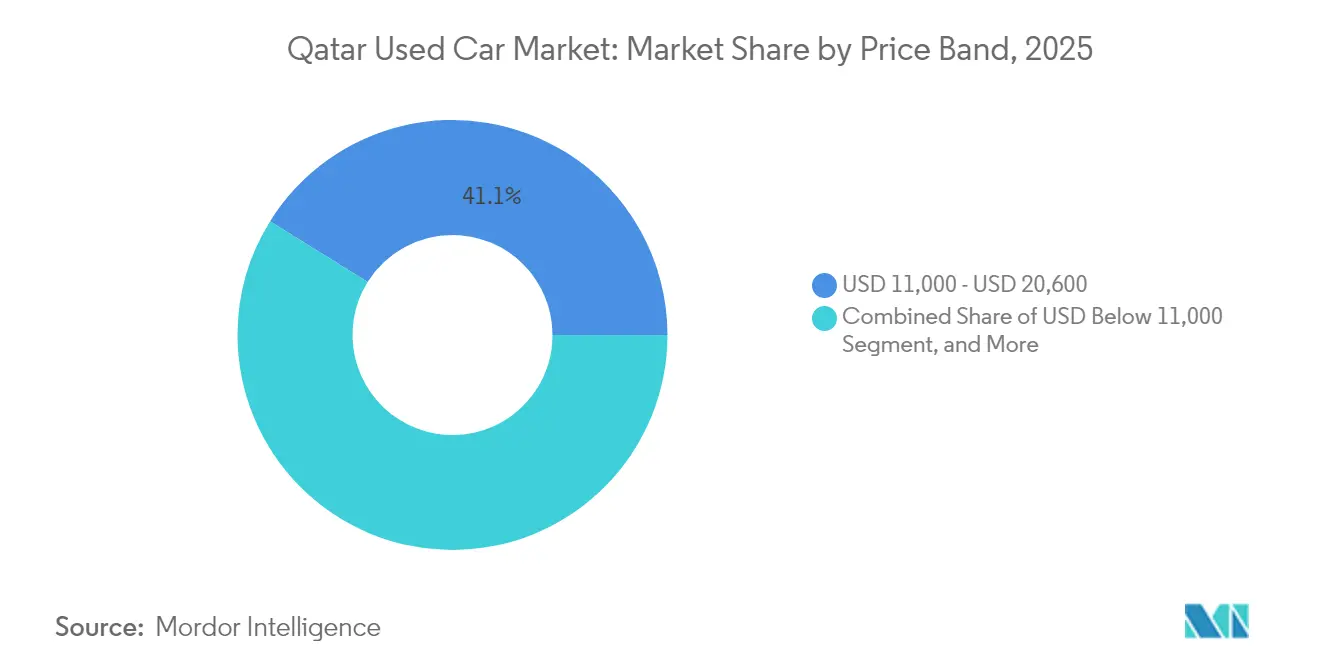
The USD 11,000-USD 20,600 range absorbed 41.12% of the Qatar used car market share in 2025, favored by mid-income households and younger professionals. Premium brackets above USD 41,000 captured affluent nationals eyeing luxury trims and are set for an 8.28% CAGR as wealth continues to pool in Doha’s high-end districts. Models under USD 11,000 face direct competition from zero-kilometer Chinese entry cars, whereas the USD 20,601-41,000 slice benefits from SUVs with enduring residual value. Financing approvals skew toward higher-ticket purchases where default risk is statistically lower.
By Sales Channel: Offline Dominates while Online Accelerates
Offline-only outlets captured the largest 55.92% Qatar used car market share in 2025, thanks to face-to-face negotiation, immediate handover, and established neighborhood service links. Dealer groups have upgraded these yards with climate-controlled showrooms and on-site inspection bays, keeping late-model SUVs and premium imports firmly priced as physical premises still anchor title transfer and registration.
Online-only marketplaces are projected to record the fastest 13.35% CAGR between 2026 and 2031, propelled by universal smartphone use, escrow payments, and AI-driven price benchmarking. Shoppers now browse on mobile, book test-drives at partner hubs, and complete paperwork digitally, creating an omnichannel loop that marries convenience with touch-and-feel assurance. Uniform inspection standards let digital sellers move vehicles nationwide with minimal reputation risk, so although offline retains the volume lead, future growth and margin expansion tilt toward platforms that master last-mile, paperwork-light delivery.
Geography Analysis
In 2025, Doha anchored 78.62% of the Qatari used car market. Its dense expat population, ubiquitous banking services, and rich dealer clusters foster high liquidity. Luxury demand also concentrates here: The Pearl Island logged 20 million vehicle entries in 2023. It now hosts the country’s fastest 180 kWh charger, cementing its role as the epicenter of premium EV adoption.
Al Rayyan, slated for a 6.60% CAGR, benefits from master-planned suburbs that combine affordable housing with new malls and schools. Families gravitate toward larger vehicles, pushing SUV turnover higher. As municipal roads connect seamlessly to Doha’s ring roads, cross-city test drives become practical, opening fresh catchment areas for dealers.
Emergent nodes such as Al Wakrah, Umm Salal, and Al Khor are from the long tail of the Qatar used car market. Population densities are lower, yet digital marketplaces neutralize distance by letting shoppers filter inventory nationwide. Regulatory consistency from centralized inspection protocols assures buyers that quality standards match Doha’s, even when the seller sits 80 km away.
Mordor Intelligence's coverage of the used car market extends across other regions including Africa, while country-specific intelligence is also available for Netherlands, Tanzania, South Africa, Portugal, Egypt, Ethiopia, Hong Kong, and Finland, each offering a view on the jurisdiction-level dynamics as applicable.
Regulatory Landscape
Qatar’s used-car trade is governed by import, technical-compliance, and consumer-protection rules administered mainly by the Ministry of Commerce and Industry (MoCI), the General Authority of Customs, and the Qatar General Organization for Standards and Metrology (QGOSM). Since January 2025, the Integrated GCC Customs Tariff introduced 12-digit vehicle codes that increase traceability in customs declarations and documentation, supporting cleaner title histories and more consistent vehicle descriptions across resale channels.
On market access and product integrity, vehicles must conform to Gulf Standard Specifications (QGOSM), and MoCI Circular No. (2) of 2025 prohibits the sale, display, or promotion of vehicles that do not meet these specifications. MoCI Circular No. (1) of 2025 permits individuals to import vehicles directly, while requiring local dealerships to provide warranty coverage, spare parts availability, and maintenance support for those units. Customs rules also shape supply: importing vehicles older than five years requires prior approvals, and temporary admission provisions allow non-GCC registered vehicles for limited periods (subject to documentation and, in some cases, bank guarantees).
Value Chain Analysis
The Qatar used-car value chain begins with sourcing (trade-ins, fleet de-fleets, and imports), moves through compliance and clearance (customs declaration, approvals for restricted cases, and standards conformity), and then into reconditioning, inspection, pricing, and retailing through offline dealers and digital platforms. Customs formalities require an electronic declaration and appropriate commercial activity coding for importers, while the 12-digit vehicle coding under the Integrated GCC Customs Tariff (activated in January 2025) supports tighter matching between vehicle paperwork and listed specifications, reducing friction in resale and financing.
Downstream, MoCI’s consumer-protection approach increases the value of certified condition reporting, warranty packaging, and service readiness at the point of sale. Under MoCI Circular No. (1) of 2025, dealerships must facilitate warranties, maintenance, and spare parts even for vehicles directly imported by individuals, which raises the importance of service networks and parts logistics in used-car transactions. QGOSM sets and monitors technical compliance to Gulf Standard Specifications, while MoCI inspection campaigns checking spare parts availability and service quality reinforce the role of compliant after-sales providers and inspection centers as gatekeepers for higher-trust inventory.
Competitive Landscape
The market structure is moderately fragmented, yet network effects are guiding consolidation. Digital leaders integrate AI-driven valuation, blockchain-secured service logs, and embedded credit scoring, helping them convert listings faster than traditional yards. Organized groups now bundle extended warranties underwritten by insurers, mitigating buyer anxiety over unforeseen repairs.
White spaces remain: dedicated electric-only remarketing, luxury consignment formats with concierge pick-up, and Sharia-first loan desks. Early movers exploiting these gaps can harvest a margin before the field crowds. Meanwhile, unorganized players pivot to niche sourcing—salvage auctions, classic imports, or low-spec commercial vans—to escape head-to-head bouts with platform giants.
Stable macro settings—anchored by the QR peg and predictable 5% import duty—encourage sustained capital investment in showrooms and reconditioning bays. Larger groups expand footprint into satellite cities, leveraging shared IT backbones to centralize inventory data while localizing customer touchpoints.
Qatar Used Car Industry Leaders
Qmotor
QatarSale
Qatar Living
Dubizzle
CarSemsar
- *Disclaimer: Major Players sorted in no particular order

Market Opportunities and Future Outlook
Policy and compliance changes are creating clearer room for organized, tech-enabled used-car models that can handle documentation, standards conformity, and after-sales support within a single customer journey. MoCI Circular No. (1) of 2025, which permits individuals to directly import vehicles while requiring dealer-backed warranties and service support, enables import-assist services, structured reconditioning, and warranty administration products that connect individual importers to compliant dealer and workshop capacity. At the same time, MoCI Circular No. (2) of 2025, which bans the sale or display of non-compliant vehicles, increases the premium for verified-spec inventory and supports demand for standardized inspections and condition grading integrated into online-to-offline retail.
Digital retail remains a practical execution channel for these opportunities because it compresses search, financing, and verification steps into fewer touchpoints. Platforms such as Q Motor (noted in-market for high traffic) and Qatar Living’s Vehicles offering show active competition to aggregate listings and attach services like rentals and automotive support. The January 2025 move to digitized, higher-granularity customs coding also improves listing accuracy and price discovery. Another near-term whitespace concerns compliant after-sales and consumables governance, with QGOSM’s June 2026 technical controls for extending tire sales providing a clearer basis for storage and quality standards and favoring sellers that can evidence compliance and bundle maintenance-ready delivery for used vehicles.
Recent Industry Developments
- June 2026: The Qatar General Organization for Standards and Metrology adopts new technical controls for tire sales extension under MoCI Decision No. 35 of 2026. Regulatory compliance focus strengthens seller operations and could shift the service and parts ecosystem for used-car dealers.
- February 2026: Qatar Living launches upgraded Qatar Living Vehicles platform within its digital ecosystem to streamline searching, buying, renting, and selling vehicles. The move strengthens control of the customer journey and intensifies competition with QMotor in the used-car ecosystem.
- January 2025: The Ministry of Commerce and Industry introduces a direct vehicle import mechanism for individuals with warranty and after-sales support mandated by dealers. The policy expands consumer protection and could influence import dynamics and warranty backed sales.


Research Methodology Framework and Report Scope
Market Definition and Coverage
For this report, the Qatar used car market is the value of completed sales of previously owned vehicles inside Qatar through online and offline channels, covering organized and unorganized sellers and measured in current USD.
Scope exclusions: The estimate excludes new vehicle sales, parts and service revenue, and insurance or financing fees that are not part of the vehicle transaction price.
Segmentation Overview
- By Vehicle Type
- Hatchbacks
- Sedans
- SUVs / MPVs
- By Vendor Type
- Organized (franchised dealers, OEM-backed platforms)
- Semi-organized (inspection-certified independents)
- Unorganized (roadside dealers, peer-to-peer)
- By Fuel Type
- Petrol
- Diesel
- Hybrid-electric
- Battery-electric
- LPG / CNG / Others
- By Sales Channel
- Online-only
- Omni-channel (online-to-offline)
- Offline-only
- By Vehicle Age
- 0-2 years
- 3-5 years
- 6-8 years
- Above 8 years
- By Price Band (USD)
- Below 11,000
- 11,000 - 20,600
- 20,601 - 41,000
- Above 41,000
- By City
- Doha
- Al Rayyan
- Al Wakrah
- Others (Umm Salal, Al Khor, Al Shamal)
Data Sources, Market Sizing, and Validation
Desk Research
Desk research was used to set the market boundary and build the base demand pool, before any interview-based adjustments were made. We reviewed public mobility and vehicle indicators such as fleet size direction, new registration momentum, and import flows that influence used supply and pricing in Qatar.
For inputs, we relied on non-paywalled sources such as Qatar Planning and Statistics Authority (population and household indicators), the Ministry of Interior traffic services (licensing and registrations where available), Qatar Customs and UN Comtrade (vehicle trade codes), and IMF and World Bank (macro series and exchange rates). We also used company filings, investor presentations, reputed press, and paid subscriptions for company financials and intelligence, plus an import or export shipment level database to cross-check trade patterns. These examples are illustrative only, and many other public and paid references were also consulted for data collection, clarification, and validation.
Primary Interviews and Surveys
Primary work centered on interviews and short surveys with used vehicle dealers, classifieds or marketplace operators, financing and inspection ecosystem participants, and service partners who see repeat transaction trends. We used these inputs to confirm typical pricing spreads by age bands, the online share of deals versus offline, and how supply tightness in specific models shifts average selling prices, then we rechecked assumptions across major cities in Qatar.
Distribution of primary research fieldwork respondents
| Company type | Respondent position |
|---|---|
| Top tier: 33% | CXOs: 13% |
| Mid tier: 49% | Functional/Unit leaders: 42% |
| Smaller Players: 18% | Managers: 45% |
Market-Sizing & Forecasting
Sizing starts from a top-down rebuild of Qatar used car transaction value using a demand pool view, where the active parc, replacement cycles, and annual turnover rates are translated into annual used transactions and then priced using observed and interview-validated ASP ranges. Once that total is formed, it is cross-checked with selective bottom-up approximations, such as dealer throughput samples, online listing to sale conversion checks, and sampled ASP times volume math for common vehicle types, so the final number stays realistic.
Key inputs used in the model include used vehicle turnover rates, the split of sales by online versus offline, vehicle age mix (newer versus older stock), price band movements, and how financing availability changes ticket size. City-level activity signals and the share of organized sellers also helped explain why the average realized price does not move in a straight line each year.
Forecasting is done through scenario analysis supported by trend smoothing, where base case assumptions for registrations, population mix, and ASP progression are aligned with primary respondents and then applied consistently across the forecast period. Where bottom-up reads were not available for a city or channel, gaps were handled by applying weighted benchmarks from the closest comparable cohort and then stress testing the impact on the total market value.
Data Validation & Update Cycle
Outputs are validated through triangulation across independent signals, and the model is checked for unusual jumps in volume, ASP, or channel share before conclusions are finalized. When a variance shows up, we revisit source data, rerun sensitivity checks, and reconnect with industry participants to confirm whether the change is structural or temporary.
Each report goes through multi-step analyst review, including logic checks on formulas, currency consistency, and year over year reasonability versus external indicators. Reports are refreshed annually, with interim updates when material events affect pricing, vehicle availability, or consumer demand, and a final pre-delivery review is completed so clients receive the latest view.
Mordor Intelligence's Qatar Used Car Market Sizing Compared With Other Published Estimates
Published market sizes for Qatar used cars do not always match because each publisher can count a different transaction scope, vehicle set, or pricing point, and they may also use different base years. Differences also come from how informal sales are treated, and whether market value is built from transaction prices or from broader automotive spending.
The table shows a meaningful spread, and in Mordor Intelligence's model the value is limited to used vehicle transaction revenue in Qatar with 2025 as the base year, which helps avoid mixing in adjacent items like financing fees, insurance commissions, or aftersales service invoices.
Benchmark comparison
| Source | Market Size | Gaps in Research Methodology |
|---|---|---|
| Mordor Intelligence | USD 623.66 M (2025) | |
| Global Consultancy A | USD 1.80 B (2026) | Uses a wider vehicle and seller coverage that can pull in light commercial activity and private transactions with less clarity on realized prices, and the shift to 2026 can lift value when ASP assumptions step up. |
| Industry Portal B | USD 2.00 B (2024) | Often inferred from general automotive turnover and high level pricing ranges, which can overstate value by mixing used transactions with broader automotive spending and by applying simplified currency timing and inflation assumptions. |
Looking across the three figures, the gap is mainly explained by what is counted as market value and how the starting year is set, rather than a disagreement that the used market is growing. By keeping the calculation traceable to turnover, channel mix, and realized pricing checks, we get a market value that can be rebuilt and stress tested with practical inputs.


Key Questions Answered in the Report
How big is the Qatar Used Car Market?
The Qatar Used Car Market size is expected to reach USD 668.64 million in 2026 and grow at a CAGR of 7.21% to reach USD 946.96 million by 2031.
What is the current size of the Qatar used car market?
The Qatar used car market size is USD 668.64 million in 2026 and is forecast to reach USD 946.96 million by 2031
Which vehicle type sells the most in Qatar’s used-car space?
SUVs lead with 49.08% share, and SUVs are the fastest climber at a 10.11% CAGR through 2031.
How fast are battery electric cars growing in the Qatar used car market?
Battery electric vehicles are expanding at a 14.52% CAGR, the quickest among all fuel types as charging points proliferate.
Why are organized dealers gaining ground over roadside sellers?
They pair digital listings with certified inspections, warranty bundles and instant Sharia-compliant financing, services that unorganized lots struggle to match.
How will new Chinese brands influence the used-car market?
Aggressive pricing and long warranties on new Chinese models narrow the cost gap with late-model used cars, pressuring dealer margins in entry-level segments.
Page last updated on:


 Your data is secure and never sold or shared.


