
Market Overview
| Study Period | 2021 - 2031 |
|---|---|
| Forecast Data Period | 2026 - 2031 |
| Base Year Market Size (2025) | USD 29.22 Billion |
| Market Size (2026) | USD 30.39 Billion |
| Market Size (2031) | USD 36.99 Billion |
| Growth Rate (2026 - 2031) | 4.01 % |
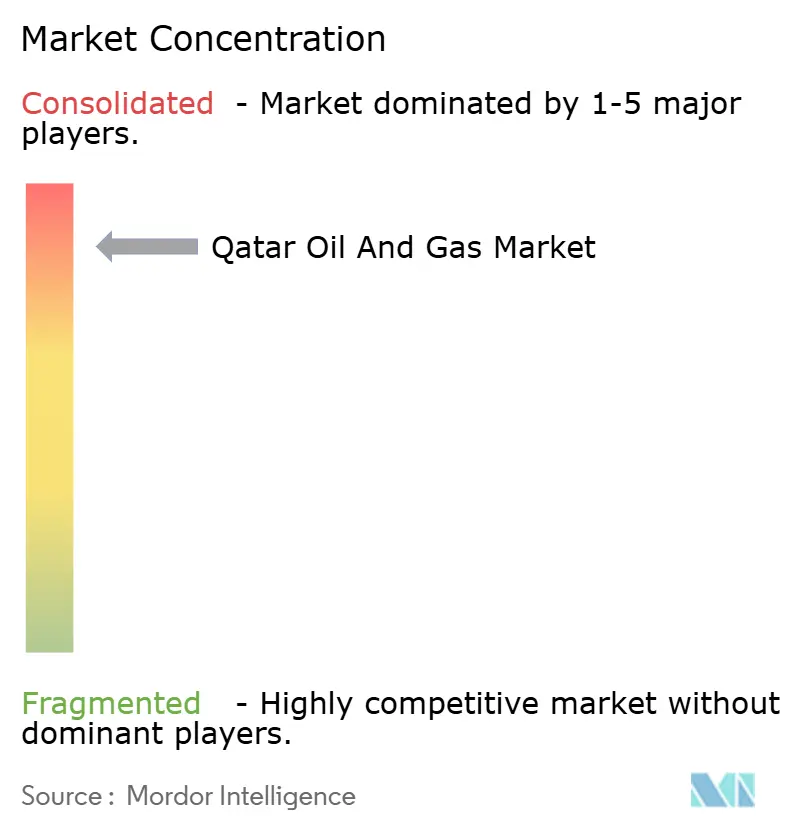
| Market Concentration | High |
Major Players *Disclaimer: Major Players sorted in no particular order Image © Mordor Intelligence. Reuse requires attribution under CC BY 4.0. | |
Qatar Oil And Gas Market Analysis by Mordor Intelligence
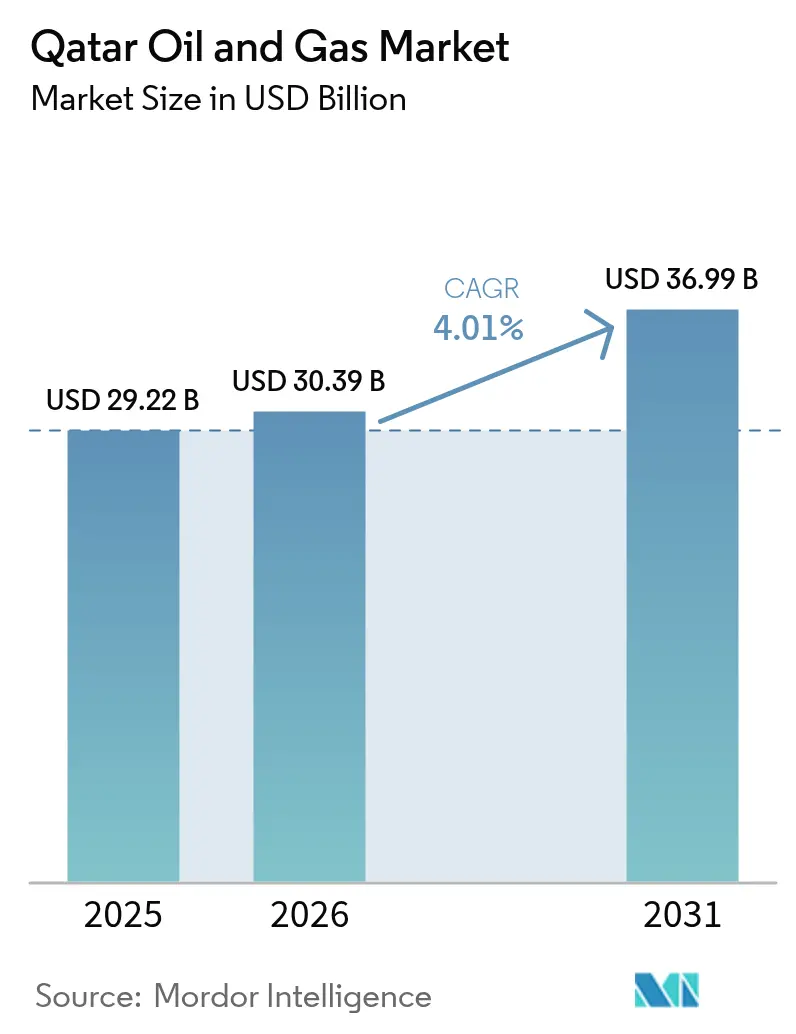
The Qatar Oil And Gas Market size in 2026 is estimated at USD 30.39 billion, growing from 2025 value of USD 29.22 billion with 2031 projections showing USD 36.99 billion, growing at 4.01% CAGR over 2026-2031.
Qatar’s ability to scale liquefied natural gas (LNG) output from 77 million tpa to 142 million tpa through its North Field East, South, and West developments secures roughly one-quarter of the projected global LNG supply by the end of the decade. Ultra-low breakeven costs, which sit below USD 3 per MMBtu, are underpinned by an integrated value chain at Ras Laffan, insulating the Qatar oil and gas market from downturn pricing cycles. Long-dated sale-and-purchase agreements—27-year pacts signed in 2024 with Sinopec, CNPC, Shell, and TotalEnergies—anchor demand security and enable aggressive capital deployment across upstream and downstream assets. Parallel investment in carbon-capture capacity, aiming to sequester 11 million t CO₂ annually by 2035, shields export volumes against tightening EU and North American ESG mandates. Meanwhile, the Qatar Free Zone LNG trading hub initiative broadens the commercial toolkit available to monetize flexible cargoes.
Key Report Takeaways
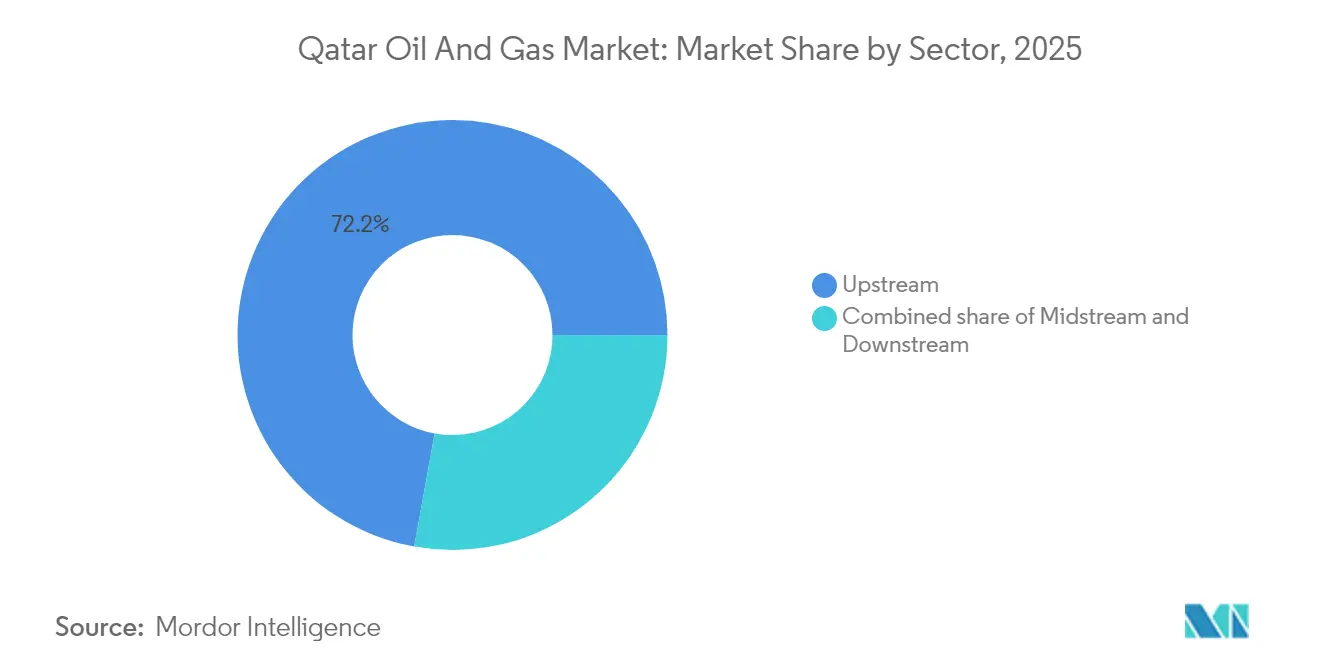
- By sector, upstream operations led with 72.15% of Qatar's oil and gas market share in 2025; downstream activities are advancing at a 6.18% CAGR through 2031.
- By location, offshore developments accounted for 78.02% of Qatar's oil and gas market size in 2025 and are projected to grow at a 5.92% CAGR through 2031.
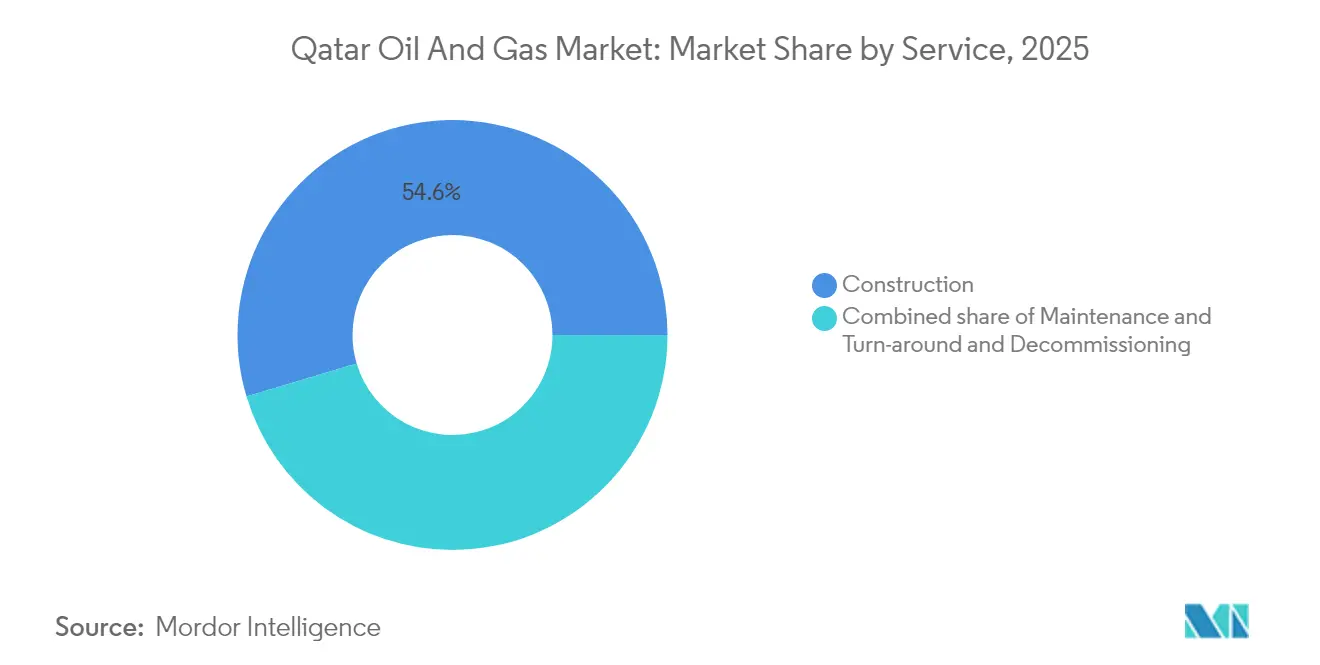
- By service, construction services commanded 54.62% of Qatar's oil and gas market share in 2025, while decommissioning services recorded the fastest growth rate of 7.01% through 2031.
Note: Market size and forecast figures in this report are generated using Mordor Intelligence’s proprietary estimation framework, updated with the latest available data and insights as of 2026.
Qatar Oil And Gas Market Trends and Insights
Drivers Impact Analysis*
| Driver | (~) % Impact on CAGR Forecast | Geographic Relevance | Impact Timeline |
|---|---|---|---|
| North Field LNG mega-expansions accelerate supply growth | +1.5% | Global, with primary impact on Asia-Pacific & Europe export corridors | Medium term (2-4 years) |
| Ultra-low breakeven cost base underpins price competitiveness | +0.8% | Global, with competitive advantage in all export markets | Long term (≥ 4 years) |
| Long-term offtake contracts with Asian & EU utilities lock in demand | +0.7% | Asia-Pacific core, spill-over to EU & emerging markets | Long term (≥ 4 years) |
| Accelerated carbon-capture build-out improves licence-to-operate | +0.4% | Global, with emphasis on ESG-sensitive EU & North American markets | Medium term (2-4 years) |
| Qatar Free-Zone push to create regional LNG trading hub | +0.3% | Regional Middle East & North Africa, extending to South Asia | Medium term (2-4 years) |
| AI-driven predictive maintenance cuts upstream downtime | +0.3% | National, with early gains in North Field & Al Shaheen operations | Short term (≤ 2 years) |
| Source: Mordor Intelligence | |||
North Field LNG Mega-Expansions Accelerate Supply Growth
The North Field East, South, and West phases increase installed liquefaction capacity by 85%, raising nameplate output to 142 million tonnes per annum (tpa) by 2030. Phased commissioning ensures step-wise volume additions that sustain revenue momentum and provide visibility for state fiscal planning. Contract awards—such as McDermott’s USD 250 million offshore package—signal a strong appetite for contracting and risk-sharing among international partners. The expansion capitalizes on a geopolitical window created by sanctions on Russian LNG and delays in Mozambique, enabling Qatar to outcompete higher-cost U.S. shale cargoes in Europe. Joint-venture participation by ExxonMobil, Shell, and TotalEnergies spreads capital burden while locking in 25-year equity LNG supplies to partner portfolios. Revenue certainty bolstered by integrated carbon-capture modules makes the expansion resilient against looming carbon-border tariffs.
Ultra-Low Breakeven Cost Base Underpins Price Competitiveness
Recoverable reserves topping 900 Tcf enable economies of scale that drop breakevens below USD 3/MMBtu—roughly half the cost of many U.S. Gulf Coast projects. A fully integrated production-to-export infrastructure within Ras Laffan eliminates third-party processing fees and reduces logistics costs. Significant well productivity reduces the number of development wells per tonne of LNG, lowering capital intensity compared to Australian or East African greenfields. During oversupply cycles, Qatar retains its margin and market share while rivals curtail their output, thereby reinforcing buyer loyalty. This structural advantage places sustained pressure on new entrants reliant on higher commodity prices to justify final investment decisions.
Long-Term Offtake Contracts with Asian & EU Utilities Lock in Demand
A slate of 27-year sale-and-purchase agreements signed in 2024 covers 14 million tonnes per annum (tpa) of new LNG volumes, dispersing customer concentration across China, France, and the United Kingdom.[1] Volume rigidity assures lenders and underpins the Qatar oil and gas market; however, contract structures offer shipping flexibility, allowing QatarEnergy to arbitrage regional price spreads. Utility counterparties enjoy security of supply as they diversify away from Russian gas, while Qatar secures premium netbacks by matching contract tenure with amortization schedules of new trains. The balanced portfolio shields state revenue from spot market volatility, facilitating stable budgetary allocations for diversification programs under the Third National Development Strategy.
Accelerated Carbon-Capture Build-Out Improves License-to-Operate
Plans to sequester 11 million tonnes of CO₂ annually by 2035 integrate capture units directly into new LNG megatrains and blue ammonia schemes. Coupling capture with liquefaction processes leverages shared utilities and reduces unit abatement costs relative to post-startup retrofits. Early adoption supports access to ESG-linked debt and green-bond proceeds raised on the London Stock Exchange in 2024. Lower carbon intensity meets EU taxonomy thresholds, future-proofing cargo access to premium Atlantic Basin markets. Over time, operational know-how can be licensed to regional peers, opening a secondary revenue stream.
Restraints Impact Analysis*
| Restraint | (~) % Impact on CAGR Forecast | Geographic Relevance | Impact Timeline |
|---|---|---|---|
| Global LNG price volatility and demand uncertainty | -0.5% | Global, with heightened exposure in spot-sensitive Asian markets | Short term (≤ 2 years) |
| Intensifying decarbonisation & ESG financing constraints | -0.4% | Global, with acute pressure from EU & North American financial markets | Long term (≥ 4 years) |
| LNG carrier new-build backlog causing shipping bottlenecks | -0.3% | Global shipping routes, with critical impact on Asia-Pacific deliveries | Medium term (2-4 years) |
| Skilled labour shortages as mega-projects peak | -0.2% | National, with concentrated impact on North Field expansion sites | Short term (≤ 2 years) |
| Source: Mordor Intelligence | |||
Global LNG Price Volatility and Demand Uncertainty
Average Asian spot prices swung more than 300% between winter 2024 peaks and summer 2025 troughs, undermining revenue predictability for any cargoes not covered by long-term contracts. Although only a minority of volumes float on spot indices, mark-to-market exposures influence sovereign earnings and can delay discretionary phases of the North Field program. Rising U.S. and UAE supply—offering shorter-term contracts—raises buyer expectations for flexible tenure, eroding Qatar’s traditional contract premium. European demand remains opaque as accelerated renewables additions shrink baseload gas requirements outside peak seasons. Financing costs widen when lenders price volatility into debt spreads, potentially pushing internal project hurdle rates above policy targets.
Intensifying Decarbonization & ESG Financing Constraints
European banks have tightened fossil-fuel lending guidelines, demanding explicit abatement pathways in project loan covenants, which inflates capital costs for new trains even when they include carbon capture. Buyers in Japan, South Korea, and Spain are increasingly stipulating carbon-neutral delivery options, forcing QatarEnergy to either source offsets or accelerate domestic capture deployment—both of which increase supply costs. Alignment with net-zero targets complicates long-term demand projections and could leave late-life assets under-recovered if policy changes accelerate.
*Our forecasts treat driver/restraint impacts as directional, not additive. The impact forecasts reflect baseline growth, mix effects, and variable interactions.
Segment Analysis
By Sector: Upstream Dominance Drives Value Creation
The upstream domain generated 72.15% of Qatar's oil and gas market share in 2025, as the North Field and Al-Shaheen projects continued to anchor the state's revenues. Within this space, the Qatar oil and gas market size for upstream activities benefited from over USD 6 billion of engineering, procurement, construction, and installation (EPCI) awards tied to Project Ru'ya. Meanwhile, downstream assets, although smaller, are expanding briskly at a 6.18% CAGR to 2031, driven by Ras Laffan's USD 6 billion ethylene cracker, which elevates Qatar into premium polymer value chains. Integrated planning links gas feedstock availability to petrochemical offtake, buffering the fiscal impact of cyclical crude prices. Continuous upstream drilling, including digital twin-guided reservoir management at Al Shaheen, optimizes lift costs and sustains production plateaus. Downstream investments diversify earnings streams, reduce exposure to fluctuations in raw commodity prices, and support job creation in advanced manufacturing, aligning with National Vision 2030.
Complementarity across segments is growing: carbon dioxide captured at LNG trains can be used to produce urea, while excess hydrogen generated during ethane cracking can be utilized in blue ammonia ventures. Upstream resource security underwrites credit ratings, which in turn lower borrowing costs for downstream expansions. Regulatory synchrony overseen by the Ministry of Energy Affairs allocates gas equally between LNG contracts and petrochemical commitments, preventing feedstock shortages that have marred other gas-rich exporters. Additionally, partnerships with Chevron Phillips Chemical transfer process know-how, accelerating Qatar's climb up the petrochemical value ladder without compromising upstream cash flow.

By Location: Offshore Operations Command Strategic Premium
Offshore projects accounted for 78.02% of Qatar's oil and gas market size in 2025 and are projected to grow at a 5.92% CAGR through 2031, as the North Field compression phases unlock deeper strata. The Qatar oil and gas market share advantage rests on vast contiguous acreage that minimizes unit development costs. Newly awarded offshore compression contracts to Saipem, worth USD 4 billion, demonstrate the capital depth being funneled into platform networks and 100 km of corrosion-resistant subsea lines. Onshore infrastructure—primarily at Ras Laffan Industrial City—concentrates utilities, export berths, and maintenance yards, creating efficiency synergies with offshore wellhead satellites. Offshore prominence also hardens barriers to entry because few global operators possess the capital and sour-gas handling expertise to tackle reservoirs of this scale.
Environmental stewardship offshore has tightened with zero-routine-flaring policies mandating reinjection or utilization of associated gas. This encourages operators to adopt integrated power-from-shore electrification to reduce Scope 1 emissions. Onshore, invested capital focuses on debottlenecking storage tanks, revamping jetty manifolds, and adding sulfur recovery, complementing offshore throughput. The offshore-onshore linkage thus operates as a virtuous loop where each side's efficiencies improve the other's cost base and risk profile.
By Service: Construction Leads, Decommissioning Accelerates
Construction services accounted for 54.62% of Qatar's oil and gas market share in 2025, as simultaneous megaprojects required high volumes of structural steel, subsea manifolds, and topside modules. Long-lead items, such as cryogenic heat exchangers, booked through 2027, signal a sustained pipeline for EPC contractors. Within the Qatar oil and gas market size calculus, decommissioning revenues are smaller but rising fastest at a 7.01% CAGR as 1990s-era jackets near the end of their life. Decommissioning activities include well pluggingmaintain, jacket removal, and pipeline flushing, an emerging niche for specialized marine spread providers. Maintenance and turnaround work maintains baseline activity as predictive analytics schedule interventions to minimize production interruptions.
Local fabrication yards—operated under the QFAB joint venture—handle topside module works, boosting indigenous capability. Meanwhile, AI-enhanced inspection drones reduce shutdown durations, adding a digital layer to traditional scaffolding and manual inspection practices. Future services demand will tilt toward brownfield optimization, not just greenfield build-outs, as Qatar transitions from capacity additions to asset stewardship.
Geography Analysis
Qatar’s compact 11,600 km² landmass enables the tight clustering of upstream wells, midstream pipelines, and downstream processing within a single coastal industrial corridor, thereby reducing haulage costs and aligning maintenance campaigns across assets. Ras Laffan’s deep-water berths lie just four sailing days from India’s west coast and under two weeks from North Asia, a voyage time advantage over U.S. Gulf Coast exporters that must transit the Panama Canal. When Houthi-related security risks disrupted Red Sea lanes during 2024–2025, Qatari cargoes were rerouted around the Cape of Good Hope without missing contractual laycans, reinforcing Qatar’s reputational reliability. The national LNG fleet, comprising 18 Q-Max vessels with a capacity of 266,000 m³, offers voyage-cost economies that outweigh canal tolls.
Geographic stability inside the Gulf Cooperation Council provides a contrast to Iraq or Iran, enabling long-term funding and smoothing joint-venture decision cycles. Regulatory predictability, offered by the Qatar Financial Centre, attracts service companies seeking a single legal hub for their regional operations. Qatar’s location at the Strait of Hormuz chokepoint affords diplomatic leverage; however, contingency plans include a feasibility review of a subsea gas pipeline to Oman, which could bypass potential strait closures. Compact geography also simplifies grid connection for planned utility-scale solar farms that will feed power to LNG trains, trimming Scope 2 emissions and freeing gas for export. Regional diversification is evident in QatarEnergy’s acquisition of a 50% stake in TotalEnergies’ 1.25 GW Basra solar project, leveraging the technical expertise gained at the North Field to expand into neighboring markets. Those outbound investments expand geopolitical goodwill and diversify earnings beyond domestic barrels and molecules. Overall, Qatar leverages its geography not merely as a point on the map, but as an integrated platform that fuses resources, logistics, diplomacy, and finance.
Regulatory Landscape
Qatar operates a centralized hydrocarbon governance model in which the State holds exclusive rights over natural resources under Law No. 3 of 2007, with QatarEnergy required to conduct and authorize petroleum operations on the State's behalf (Decree Law No. 10 of 1974). Sector policy and reserve development oversight sit with the Supreme Council for Economic Affairs and Investment, while regulatory direction is carried out through the Minister of State for Energy Affairs, who also serves as the President and CEO of QatarEnergy. This structure keeps approvals, licensing, and operational control anchored to a single national decision center.
For onshore and offshore activities, contractors and operators generally enter the market via QatarEnergy-led contractual arrangements, including joint ventures and service contracts, and must meet QatarEnergy corporate requirements in addition to applicable Qatari laws. Compliance is reinforced through QatarEnergy internal HSE governance (for example, CORP-HSE-STD-080 for managing HSE in contracts), which standardizes risk management and contractor controls across multi-package developments and brownfield work at industrial hubs such as Ras Laffan.
Competitive Landscape
QatarEnergy remains the axis around which the Qatar oil and gas market revolves, holding sovereign rights to all acreage and allocating equity slices to foreign partners in exchange for capital, technology, and offtake obligations. Despite its central role, competitive intensity has sharpened in services contracting, with USD 10 billion of awards since 2024 split among McDermott, Saipem, Hyundai Heavy Industries, Larsen & Toubro, and China Offshore Oil Engineering Company. These awards underscore a pragmatic procurement strategy that pits international yards against each other to compress bid prices and shorten schedules.
International oil companies have accepted minority stakes—often 5–12.5%—in North Field joint ventures, which provide 1 million tonnes per annum (tpa) of equity LNG for every 1.25% stake. This incentive is potent enough to offset the limited management control. ExxonMobil initiated exploratory talks in late 2024 to expand its footprint into downstream integration, underscoring the market’s appeal for super-majors seeking resilient cash flows amid global decarbonization pressures.[4] Competition has also moved into the digital domain, where ABB, Schlumberger, and Honeywell jostle for automation and predictive analytics contracts tied to facility upgrades.
White-space competition is emerging in decommissioning, carbon capture, and LNG bunkering. Early movers positioning specialized lift vessels and CO₂ sequestration technologies are likely to lock in long-term service revenues. Domestic policy, particularly the 2024 Qatarization law mandating higher local labor ratios, forces foreign companies to partner with local firms, such as Milaha Offshore Marine, reshaping the composition of bidding consortia. In parallel, capital market innovation—evident in Qatar’s USD 2.5 billion green bond—broadens the financing channels available to both state and private operators, upping the stakes for firms unprepared to meet ESG disclosure norms.
Qatar Oil And Gas Industry Leaders
-
QatarEnergy
-
ConocoPhillips Company
-
Exxon Mobil Corporation
-
TotalEnergies SE
-
Shell plc
- *Disclaimer: Major Players sorted in no particular order
Market Opportunities and Future Outlook
Near-term whitespace is visible across EPC, local fabrication, and supporting services tied to LNG and gas processing capacity additions, supported by named expansion awards and related industrial planning. In February 2026, QatarEnergy awarded the onshore EPC contract for the North Field West project to a joint venture of Technip Energies, Consolidated Contractors Company (CCC), and Gulf Asia Contractor (GAC), covering two 16 MTPA LNG mega-trains targeted for 2031 startup. The award secures scope across onshore utilities, gas treatment, storage, and export interfaces, and it extends contractor activity beyond earlier North Field phases.
Opportunity is also broadening through downstream derivative integration and domestic industrialization pathways shaped by government-linked mechanisms. In July 2026, QatarEnergy and the Ministry of Commerce and Industry signed terms of reference to create a governance mechanism for allocating hydrocarbon-derived resources to qualifying industrial investments, alongside plans to develop a new medium industries area in Mesaieed Industrial City. In parallel with Qatar's stated carbon-capture ambition of 11 million t CO2 per year by 2035, these steps support investable openings in CCUS enabling infrastructure, emissions management services, and gas-to-chemicals linkages that depend on assured feedstock allocation and industrial zoning to strengthen project bankability and execution.
Recent Industry Developments
- May 2026: QatarEnergy, the Government of Egypt, and ExxonMobil signed an MoU to study gas development and commercialization options in the Eastern Mediterranean, including pathways that use Egypt's existing gas and LNG export infrastructure. The framework broadens QatarEnergy's regional gas cooperation toolkit and links upstream resource positions to near-term monetization routes through third-party liquefaction and export systems.
- April 2026: QatarEnergy and ExxonMobil loaded the first cargo from the Golden Pass LNG project in the United States onto a QatarEnergy LNG carrier, Al-Qaiyyah. With first cargo execution following first LNG, the project moved from commissioning into delivered supply, expanding portfolio flexibility for QatarEnergy alongside its domestic Ras Laffan-centered value chain.
- September 2024: Saipem won a USD 4 billion offshore compression EPC contract covering six platforms and around 100 km of subsea lines to sustain North Field plateau output. The award reinforced long-cycle offshore infrastructure demand in Qatar and locked in a major package for topsides, subsea installation, and associated fabrication and marine logistics services.
Research Methodology Framework and Report Scope
Market Definition and Coverage
This market is defined as the value generated from oil and gas activities within Qatar across upstream, midstream, and downstream operations, including associated field and facility services that support production and processing through the year.
Scope exclusions: This sizing does not count electricity generation, general utilities, or non-hydrocarbon renewables, even when projects are owned by energy-linked entities.
Segmentation Overview
- By Sector
- Upstream
- Midstream
- Downstream
- By Location
- Onshore
- Offshore
- By Service
- Construction
- Maintenance and Turn-around
- Decommissioning
Data Sources, Market Sizing, and Validation
Desk Research
Desk research started with public energy and macro indicators to anchor realistic demand, supply, and pricing context for Qatar. We reviewed sources such as the Ministry of Energy and national statistics releases, OPEC and IEA datasets, U.S. EIA country series, UN Comtrade trade statistics, and peer reviewed technical papers covering production and processing trends.
To translate the industry picture into a model that could be checked, we also reviewed company annual reports, investor presentations, project announcements, and reputable press coverage around capacity additions and maintenance cycles. In addition, a few paid database subscriptions were used in a limited way for company financial intelligence, patent lookups, and shipment level import and export checks where public reporting was not detailed enough. These examples are indicative only, and many other sources were also used for data collection, validation, and clarification during the study.
Primary Interviews and Surveys
Primary work focused on interviews and short surveys with operator-side stakeholders, engineering and service providers, logistics and terminal participants, and industry advisors who track Qatar projects and output plans. Since this is a country market, discussions were kept Qatar-specific while still covering different asset settings (onshore and offshore). This helped confirm desk research assumptions and close gaps around service intensity, utilization, and pricing changes.
Distribution of primary research fieldwork respondents
| Company type | Respondent position |
|---|---|
| Top tier: 27% | CXOs: 14% |
| Mid tier: 59% | Functional/Unit leaders: 31% |
| Smaller Players: 14% | Managers: 55% |
Market-Sizing & Forecasting
Sizing was built using a top-down approach where national production, processing capacity, and trade flows were reconstructed into an industry value pool, then mapped to typical revenue drivers across the value chain. To keep the outputs practical, we corroborated results with selective bottom-up approximations, such as sampled volume times average realized prices, service activity proxies, and channel checks on project and maintenance spending. These were then used to adjust totals when mismatches appeared.
Inputs tracked included crude oil and natural gas production volumes, LNG export capacity and utilization, refinery and gas processing throughput, announced expansion timelines, and oil and gas price benchmarks with local differentials. These variables help separate activity base (volume), monetized share of installed capacity (utilization), and value movement (pricing), even when volumes are stable. Forecasting relied on scenario analysis supported by a multivariate regression view, where output plans, utilization, and price assumptions were stress-tested with expert feedback before the final trajectory was set. When a bottom-up proxy was missing for a niche service line, we used ratios tied to comparable project phases and then validated the approach through follow-up discussions.
Data Validation & Update Cycle
Validation was done through triangulation across independent signals, followed by structured variance checks at each step of the model so outliers were not carried into the final numbers. If the implied value per unit of output, utilization pattern, or trade-linked volumes looked inconsistent with known operating reality, the inputs were revisited and the assumptions were rechecked with fresh calls.
A multi-step internal review was also applied, where another analyst reviews the logic, math, and scope alignment before sign-off. The report is refreshed annually, and interim updates are made when material events occur, such as major capacity milestones, policy shifts, or large project deferrals. Right before delivery, a final sweep is completed to ensure the most recent public updates are reflected in the model.
Mordor Intelligence's Qatar Oil and Gas Market Size Compared With Other Published Estimates
Published market sizes for Qatar oil and gas do not always line up, even when they sound like they measure the same thing. Differences usually come from what activities are counted, what year is treated as the base, and how price and utilization assumptions are carried into the value calculation.
The table shows a spread that is largely explained by scope and value-conversion choices, plus how each source treats the timing of major LNG and processing expansions. Some figures lean on broader energy or petrochemical add-ons, while others put more weight on aggressive price paths or conservative utilization. That combination can move the value by a noticeable amount year to year.
Benchmark comparison
| Source | Market Size | Gaps in Research Methodology |
|---|---|---|
| Mordor Intelligence | USD 29.22 B (2025) | |
| Global Consultancy A | USD 38.00 B (2023) | Uses an earlier base year and appears to include a wider set of product revenue lines (such as LNG and broader downstream value capture) with less transparent treatment of utilization versus nameplate capacity. |
| Industry Publisher B | USD 50.00 B (2024) | Presents a higher total that likely folds in adjacent value pools like petrochemicals and refined products alongside oil and gas operations, and it also relies on scenario framing that can skew the central estimate if the base case is not clearly defined. |
The table points to scope expansion as the biggest reason for the gap, and in Mordor Intelligence's model the total is limited to Qatar oil and gas sector activity and supporting services, with value tied back to production, throughput, and utilization checks rather than broader energy and petrochemical revenue pools. With that structure, buyers can trace the number to a few repeatable drivers, and then adjust assumptions in a controlled way when new capacity or price changes emerge.
Key Questions Answered in the Report
What is the projected value of Qatar’s oil and gas sector by 2031?
The sector is forecast to reach USD 36.99 billion by 2031, supported by a 4.01% CAGR.
How much LNG capacity will Qatar add through the North Field projects?
Combined North Field East, South, and West phases will lift liquefaction capacity from 77 million tpa to 142 million tpa.
Which segment is expanding fastest in Qatar’s energy services space?
Decommissioning services show the highest growth at a 7.01% CAGR through 2031 as older offshore assets reach end-of-life.
Why are ultra-low breakeven costs important for Qatar?
Breakevens below USD 3/MMBtu allow profitable exports even during price downturns, protecting revenue and market share.
How is Qatar addressing environmental pressures on LNG exports?
The country plans to capture 11 million t CO₂ annually by 2035 and issued USD 2.5 billion in green bonds to finance low-carbon projects.
What legal change affects workforce composition on energy projects?
Law 12/2024 increases mandatory local employment ratios, compelling contractors to hire and train more Qatari nationals.