
Market Overview
| Study Period | 2020 - 2031 |
|---|---|
| Forecast Data Period | 2026 - 2031 |
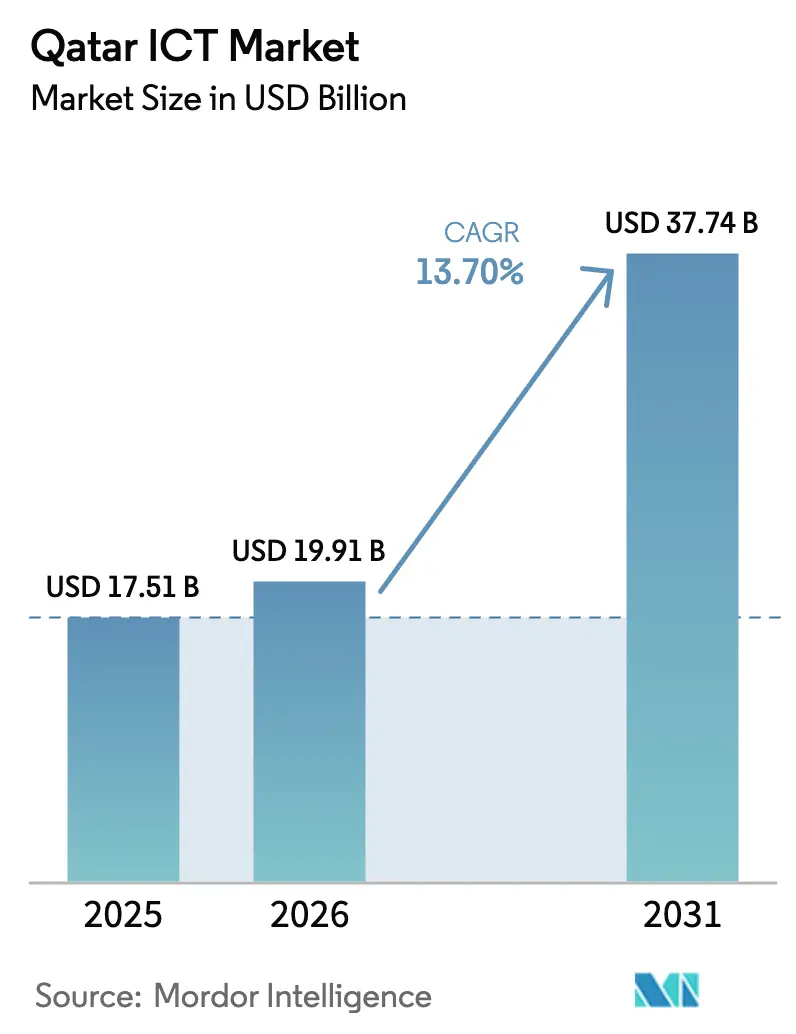
| Base Year Market Size (2025) | USD 17.51 Billion |
| Market Size (2026) | USD 19.91 Billion |
| Market Size (2031) | USD 37.74 Billion |
| Growth Rate (2026 - 2031) | 13.70% CAGR |
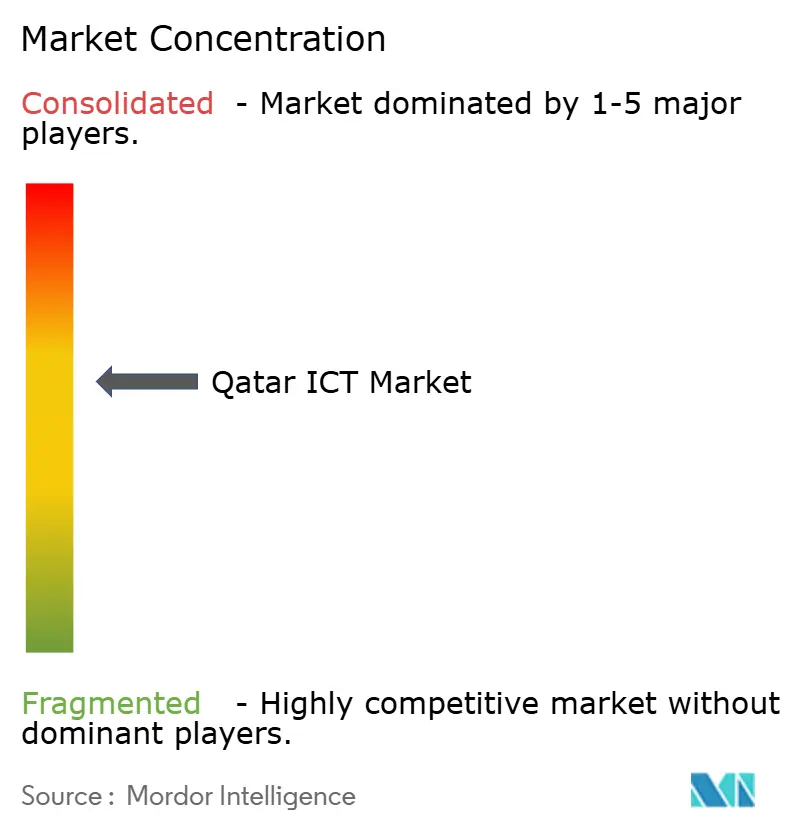
| Market Concentration | Medium |
Major Players
*Disclaimer: Major Players sorted in no particular order Image © Mordor Intelligence. Reuse requires attribution under CC BY 4.0. |
|
Qatar ICT Market Analysis by Mordor Intelligence
The Qatar ICT market size was valued at USD 17.51 billion in 2025 and estimated to grow from USD 19.91 billion in 2026 to reach USD 37.74 billion by 2031, at a CAGR of 13.7% during the forecast period (2026-2031). Rapid 5G roll-out, sovereign cloud investments, and mandatory Arabic large-language-model (LLM) development are accelerating enterprise digitization, while the National Digital Agenda 2030 channels more than USD 2.47 billion of public funds into next-generation infrastructure [1]International Trade Administration, “Qatar - Digital Economy,” trade.gov. Communication Services remain the revenue backbone as telecom operators densify networks ahead of the Asian Games 2030, yet Cloud Services post the steepest growth thanks to data-sovereignty-compliant hyperscale launches by Microsoft and regional carriers. Intensifying competition among Ooredoo, Vodafone Qatar, and global hyperscalers is spurring price innovation in managed security, edge, and GPU hosting, opening fresh opportunities for domestic software firms that localize Arabic applications. On the demand side, banking, energy, and public administration projects dominate contract value, but esports venues and smart-manufacturing pilots signal emerging pockets of high-margin spend.
Key Report Takeaways
- By product type, Communication Services led with 41.35% revenue share in 2025, while Cloud Services are projected to expand at a 21.7% CAGR through 2031.
- By enterprise size, large enterprises commanded 71.30% of the Qatar ICT market share in 2025; SMEs record the fastest 12.3% CAGR to 2031.
- By industry vertical, Government and Public Administration held 28.25% of 2025 revenue, whereas Gaming and Esports is advancing at 17.3% CAGR to 2031.
- By deployment mode, on-premises solutions represented 63.55% of 2025 spend; cloud-only deployments show a 21.4% CAGR outlook to 2031.
Note: Market size and forecast figures in this report are generated using Mordor Intelligence’s proprietary estimation framework, updated with the latest available data and insights as of 2026.
Qatar ICT Market Trends and Insights
Drivers Impact Analysis*
| Driver | (~) % Impact on CAGR Forecast | Geographic Relevance | Impact Timeline |
|---|---|---|---|
| Accelerated 5G roll-out and network densification | +2.8% | Doha, Al Rayyan, Lusail | Medium term (2-4 years) |
| Government Digital Agenda 2030 capital spending | +3.2% | National smart-city corridors | Long term (≥ 4 years) |
| Rapid cloud take-up within the BFSI sector | +2.1% | Doha Financial District | Short term (≤ 2 years) |
| Mega-events pipeline (Asian Games 2030, Expo 2033) | +1.9% | Doha metro area | Medium term (2-4 years) |
| Mandated Arabic-LLM build-out | +1.6% | Doha tech parks | Medium term (2-4 years) |
| Compulsory critical-infrastructure cyber audits | +1.4% | Energy and finance hubs | Short term (≤ 2 years) |
| Source: Mordor Intelligence | |||
Accelerated 5G roll-out and network densification
Vodafone Qatar’s 2025 agreement with Nokia is modernizing the nationwide radio and core layers to support low-latency 5G slicing for industrial IoT and 8 K streaming, aligning with the regulator’s December 2025 3G sunset that frees up spectrum for enhanced mobile broadband. Parallel trials by Ooredoo using Wi-Fi 7 over fiber deliver four-fold throughput gains, reinforcing Qatar’s ambition to provide 10 Gbps residential access and bolster enterprise edge computing . These upgrades enable smart-stadium analytics and autonomous shuttle pilots for the Asian Games 2030, reinforcing Qatar ICT market growth prospects.
Government Digital Agenda 2030 capital spending
The Third National Development Strategy allocates multi-year funds so that digital public services account for at least 90% of citizen transactions by 2030. Key programs include a five-year partnership with Scale AI covering more than 50 AI use cases, and the launch of a National Cyber Security Academy to train local talent[2]Digital Watch Observatory, “Five-year agreement to bring AI-driven improvements to Qatar,” dig.watch . Spending commitments extend to quantum-ready research and new sovereign-cloud regions, anchoring long-run demand for consulting, integration and secure hosting capacities within the Qatar ICT market.
Rapid cloud take-up within the BFSI sector
Commercial Bank and Meeza’s secure cloud platform supports instant payments and analytics, illustrating the sector’s pivot toward hybrid architectures that satisfy Qatar Central Bank compliance rules. Microsoft’s hyperscale region, operating under local data-privacy law 13-2016, now hosts core banking workloads for leading lenders, cutting disaster-recovery RPOs from hours to minutes. As financial institutions chase real-time risk management, the Qatar ICT market size attached to BFSI workloads is set to expand steadily through the forecast horizon.
Mega-events pipeline boosting ICT demand
Building on World Cup infrastructure, organizers of the Asian Games 2030 and Expo 2033 are issuing tenders for 8 K broadcast, crowd-analytics and ticketless entry systems. These projects combine edge compute, private 5G and IoT sensors, injecting multi-year capex into the Qatar ICT market while leaving a post-event smart-city legacy that underpins e-government and tourism apps.
Restraints Impact Analysis*
| Restraint | (~) % Impact on CAGR Forecast | Geographic Relevance | Impact Timeline |
|---|---|---|---|
| Acute cyber-skills shortage inflating wage bills | -1.8% | National | Long term (≥ 4 years) |
| Heavy reliance on foreign OEMs raising lifecycle TCO | -1.2% | National | Medium term (2-4 years) |
| New data-localization decree limiting cross-border SaaS uptake | -0.9% | Multinational corporates | Short term (≤ 2 years) |
| Higher water and power tariffs squeezing data-center P&L | -0.7% | Data-center clusters | Short term (≤ 2 years) |
| Source: Mordor Intelligence | |||
Acute cyber-skills shortage inflating wage bills
Despite the National Cyber Security Agency’s training academy, demand for qualified analysts outstrips local supply, forcing enterprises to import talent at wage premiums above regional norms. The situation is acute in energy and banking, where critical-infrastructure audit deadlines create time-sensitive hiring spikes. Elevated labor costs erode margins for managed security providers and could temper Qatar ICT market expansion if unaddressed.
Heavy reliance on foreign OEMs raising lifecycle TCO
Core routers, GPU clusters and storage arrays are sourced almost entirely from U.S., European and East-Asian vendors. Currency swings and extended spares lead-times inflate total cost of ownership, particularly for data-center operators locked into proprietary architectures. Government-backed localization rules now offer tariff rebates for assemblies completed in Qatar, yet supplier diversification remains a medium-term necessity for cost-efficient growth of the Qatar ICT market.
*Our forecasts treat driver/restraint impacts as directional, not additive. The impact forecasts reflect baseline growth, mix effects, and variable interactions.
Segment Analysis
By Product Type: Communication Services retain scale, cloud accelerates
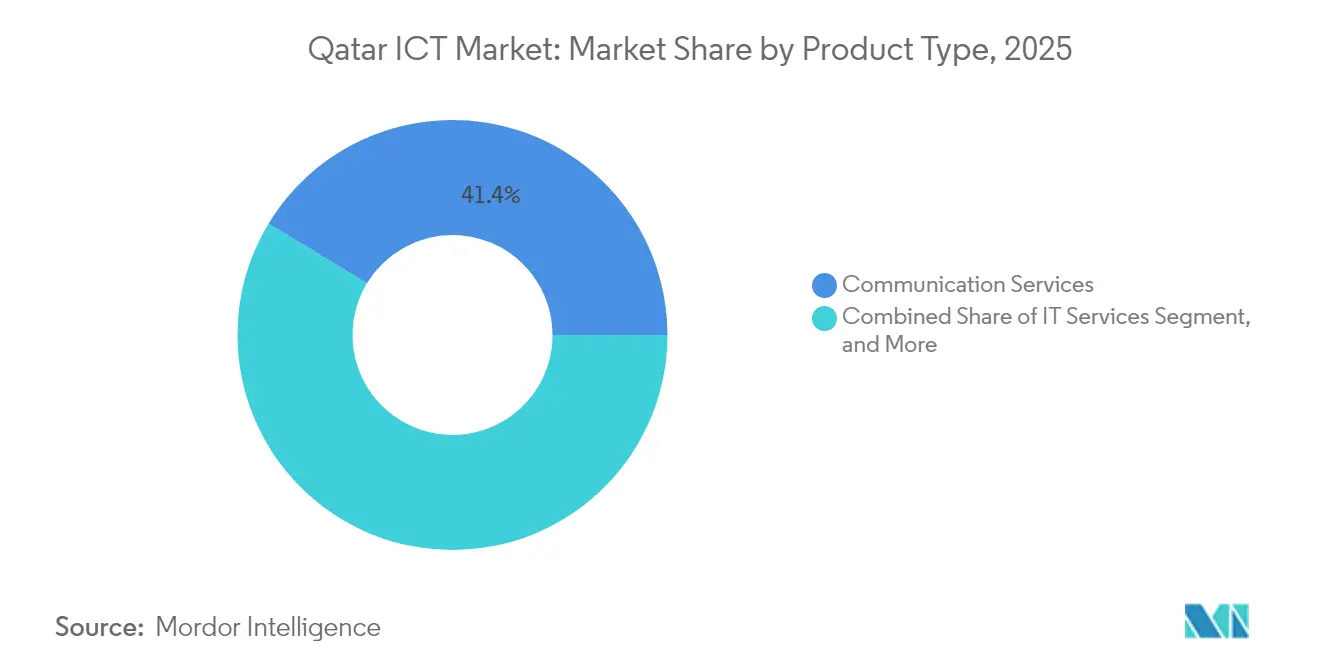
Communication Services generated the largest share of Qatar ICT market revenue at 41.35% in 2025, reflecting sustained mobile-data demand, fiber roll-outs and wholesale transit fees. The segment benefits from mandatory VoLTE migration and 5G enterprise slicing, providing steady cash flow for network operators. Conversely, Cloud Services exhibit the fastest 21.7% CAGR as hyperscale regions and local sovereign-cloud zones allow banks and ministries to comply with data-residency law 13-2016. Robust GPU demand for Arabic LLMs and AI-driven customer interaction further boosts cloud uptake. IT Hardware sales track densification cycles across mobile and data-center footprints, while Software growth is propelled by low-code platforms that local firms adapt for Arabic interfaces.
Historical spending showed Communication Services navigating margin compression through bundle innovations, whereas present momentum clearly favors cloud elasticity. Market players are increasingly combining managed security with unified communications to defend share. Local system integrators align with the sovereign-cloud push, creating cross-sell opportunities into analytics and workflow software. The sector’s shift aligns with National Digital Agenda targets that prioritize cloud-delivered public services, lifting the Qatar ICT market size for XaaS offerings more sharply than for legacy hardware.


By Enterprise Size: Large enterprises dominate, SME digitization catches up
Large enterprises controlled 71.30% of 2025 spend, fueled by mega-project budgets within government, energy and aviation. Their roadmaps encompass ERP cloud migration, zero-trust security and AI-augmented workflows worth tens of millions of USD per contract. However, SME digital programs backed by Qatar Development Bank subsidies propel a 12.3% CAGR, signaling a gradual re-balancing of the Qatar ICT market. Lower entry costs for SaaS, simplified e-invoice mandates and marketplace access entice micro-firms to adopt accounting and CRM clouds.
For incumbents, hybrid-cloud governance and localized data-lake architectures are key procurement criteria. SMEs, in contrast, prioritize pay-as-you-go platforms bundled with cybersecurity baselines, narrowing the digital divide. Channel partners offering turnkey e-commerce and payment APIs capitalize on this wave. Over time, SME digital maturity is expected to unlock indigenous app-development talent, reinforcing the government’s ambition to generate 26,000 ICT jobs and broadening the Qatar ICT market addressable base.
By Industry Vertical: Public sector leads, esports surges
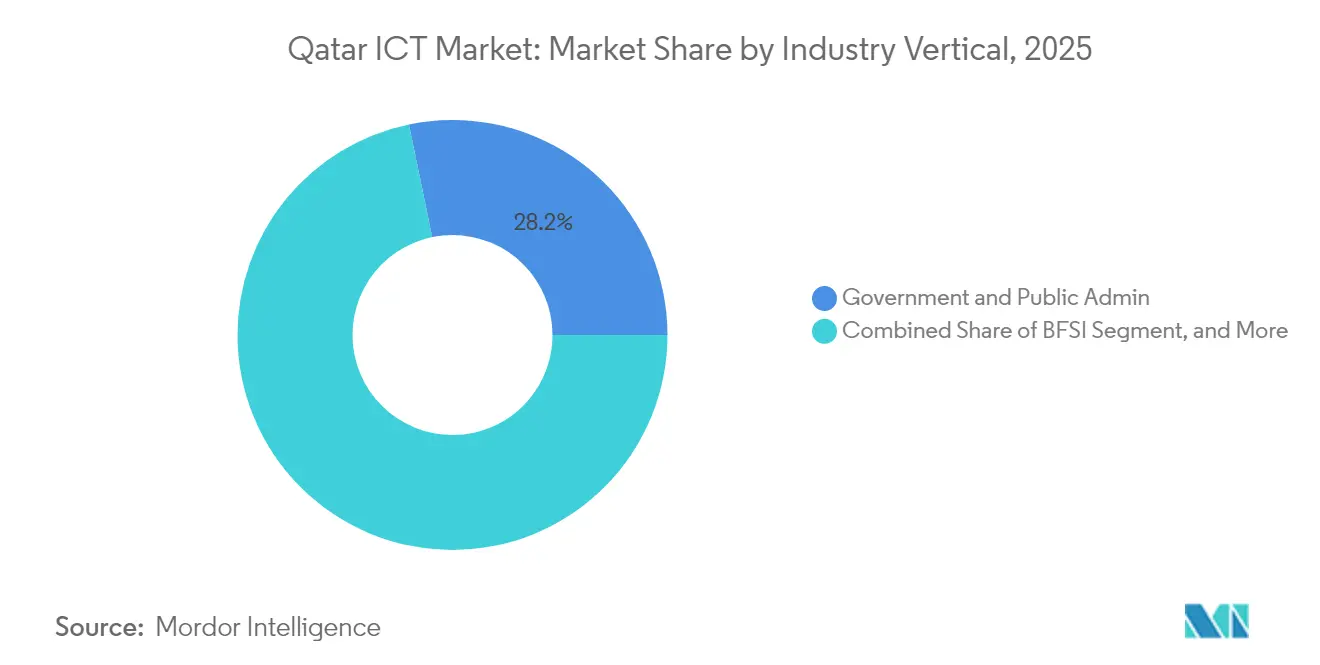
Government and Public Administration contributed 28.25% of 2025 turnover due to massive e-services re-platforming and AI chatbots that reduce citizen touch-points. Mandatory LLM training datasets amplify compute demand, sustaining public-sector outlays. In parallel, Gaming and Esports post a 17.3% CAGR as purpose-built arenas, streaming studios and regional tournaments draw sponsorships and media rights. The Qatar ICT market share commanded by public-sector buyers remains high, but esports monetization of cloud gaming, VR and influencer analytics injects new revenue paths for service providers.
Banks exploit sovereign cloud and ISO 27001 alignment to roll out instant payments and anti-fraud AI, while energy utilities deploy IoT sensors for predictive maintenance of LNG terminals. Manufacturing pilots under Factory One showcase 5G-connected robotics, signaling future diversification. Healthcare taps AI imaging tools hosted locally. This vertical mix underscores policy goals of diversifying non-hydrocarbon GDP by 4% annually, translating into broad-based demand for secure, low-latency digital infrastructure within the Qatar ICT market.
By Deployment Mode: On-premises still majority, cloud-only scales rapidly
On-premises solutions accounted for 63.55% of 2025 spend, reflecting risk aversion and data-sovereignty obligations across defense, finance and energy. Nevertheless, cloud-only environments achieve a 21.4% CAGR as hyperscale and sovereign regions achieve ISO 27001 and local privacy compliance, mitigating earlier regulatory hurdles. Hybrid deployments emerge as a middle path, combining on-prem workloads with low-latency cloud analytics and disaster recovery replicas.
Initial migrations focus on customer-facing portals and dev-test workloads; later waves encompass core ERP and data lakes. Vendors differentiate on transparent residency controls and in-country support. As more ministries receive clearance for confidential-workload hosting, the Qatar ICT market size attributable to off-premises consumption is set to rise steadily, narrowing the on-prem share by the decade’s close.
Geography Analysis
Qatar’s compact landmass enables near-universal fiber coverage, with national broadband reaching major municipalities and industrial zones. International subsea cables land directly in Doha, creating single-digit-millisecond round-trip latency to Europe and India, a decisive factor for cloud and trading workloads. The presence of LNG-powered generation ensures resilient electricity supply for Tier III+ data centers, although planned tariff revisions could weigh on operator margins.
Doha remains the nexus of the Qatar ICT market owing to the concentration of ministries, banks and headquarters. Smart districts such as Msheireb deploy integrated IoT platforms, open-access fiber and autonomous shuttles that serve as living laboratories for local tech start-ups. Lusail’s stadiums and Expo site extend digital infrastructure northwards, while Al Rayyan hosts edge nodes that offload metro traffic. The clustering effect underpins an ecosystem where telcos, hyperscalers and academia co-locate, accelerating innovation cycles.
Regionally, Qatar leverages GCC collaborations to aggregate content delivery and cross-border cloud recovery. Ooredoo’s memorandum with stc Group synchronizes network APIs across markets, giving multinationals consistent SLAs. The country’s visa-light policies and 100% foreign ownership zones attract regional headquarters of U.S. and Asian software firms, deepening the skills pool and broadening solution portfolios available in the Qatar ICT market.
Regulatory Landscape
Qatar's ICT regulation is anchored in the Communications Regulatory Authority (CRA), established by Emiri Decree No. 42 of 2014. The CRA oversees telecommunications and related ICT market conduct through instruments including the Telecommunications Law No. 34 of 2006 and its associated bylaws. Alongside this, the Ministry of Communications and Information Technology (MCIT) sets broader policy direction through programs such as the Digital Agenda 2030, while sector-specific compliance regimes, including Qatar Central Bank requirements for BFSI technology use, shape how regulated entities adopt cloud and outsourcing.
Competitive and market-structure rules are also moving through the CRA. The ICT Competition Framework review started in 2024 and progressed into public consultation during 2025. In parallel, government digital-platform standardization initiatives, such as the National Digital Authentication and Trust Services Strategy 2024-2026 led by MCIT, are influencing procurement patterns for identity, trust services, and security controls for public-sector and critical-infrastructure buyers.
Value Chain Analysis
Qatar's ICT value chain begins with global technology OEMs and hyperscalers supplying core compute, networking, and platforms, then shifts to in-country localization through data-center operators and telecom network owners. Connectivity and access layers are anchored by Ooredoo Qatar and Vodafone Qatar via nationwide fiber and 5G assets. Carrier-neutral data-center capacity is increasingly represented by Syntys (Ooredoo Group), including facilities in Qatar Free Zones after the acquisition of Q Data QFZ LLC assets. These infrastructure layers, in turn, support higher-margin services such as cloud hosting, managed security, and industry-specific solutions for BFSI, energy, and government digital services.
Further up the stack, MCIT-led government platforms, including the Government Cloud and Data Platform, National Authentication Service, and e-payment rails, provide standardized integration points that system integrators, software vendors, and managed service providers use to deliver citizen and enterprise applications. Delivery is typically shared across global SIs and local partners that handle compliance mapping, Arabic localization, and operational support. Increasingly, enterprises purchase bundled offerings that combine connectivity such as SD-WAN and private 5G with cloud, identity, and cybersecurity services.
Competitive Landscape
Market leadership is shared by Ooredoo, Vodafone Qatar and global hyperscalers that jointly shape service bundles and price points. Ooredoo’s 15% normalized net-profit jump in Q3-2024 reflects upselling of 5G-enabled managed services and GPU rentals for Arabic-LLM training [3]Ooredoo Group, “Ooredoo Group Q3 2024 – Normalized Net Profit Rises 15%,” ooredoo.com. Vodafone’s network-modernization pact with Nokia positions it for enterprise 5G slicing as it leverages its 8.1% Q1-2025 net-profit increase to fund digital-service innovation . Microsoft’s in-country region offers confidential computing and multi-zone resilience, attracting banks, airlines and ministries seeking cloud certification under national privacy law.
Strategic alliances dominate go-to-market models. Ooredoo-NVIDIA GPU clusters, Microsoft-MCIT AI sandboxes and SAP’s RISE partnerships provide turnkey stacks that de-risk transformation projects. Local ISVs focus on Arabic UX and compliance wrappers, enhancing vendor stickiness in the Qatar ICT market. White-space opportunities lie in SME cybersecurity platforms and Industry 4.0 edge appliances, segments where global players still lack localized offerings[4]Investment Opportunities in Qatar's Manufacturing Sector." April 13, 2025. https://www.invest.qa/en/sectors-and-opportunities/manufacturing..
Emergent challengers include Snoonu, which leverages a five-year Web Summit collaboration to scale logistics software, and Meeza, whose sovereign-cloud services anchor sensitive government and BFSI workloads. Barriers to entry rise as the National Cyber Security Agency tightens compliance audits, giving incumbents with mature governance frameworks a defensible edge.
Qatar ICT Industry Leaders
-
Ooredoo Q.P.S.C.
-
Vodafone Qatar P.Q.S.C.
-
Microsoft Corporation
-
Amazon Web Services
-
Oracle Corporation
- *Disclaimer: Major Players sorted in no particular order

Market Opportunities and Future Outlook
Digital-public-service modernization and trust infrastructure create opportunities for vendors that can productize compliance-ready building blocks for identity, signatures, and secure onboarding across government and regulated industries. MCIT's National Digital Authentication and Trust Services Strategy 2024-2026 provides a concrete basis for solutions spanning PKI, authentication, fraud controls, and integration toolkits that can be reused across ministries and commercial sectors. With the Digital Agenda 2030 setting targets around ICT-sector contribution to GDP and job creation, local ISVs and SIs have a clearer runway for Arabic-first workflows, sector templates, and managed compliance services, rather than relying on one-off project delivery.
Sovereign and in-country cloud capacity expansion also supports opportunities in cloud migration, security, and GPU-heavy workloads tied to Arabic AI. The evidence cited in the underlying context includes continued hyperscale presence, including Microsoft's Qatar cloud region, and local data-center scale-up plans by Ooredoo Group and Syntys. These operators have cited a 120 MW data-center target and 26 MW of live IT capacity in Qatar as of early 2026. As enterprises move beyond initial migrations, the focus shifts toward hybrid governance, data-residency controls, and managed detection and response for critical infrastructure. Telecom operators and MSSPs can bundle connectivity with security and compliant hosting in these segments.
Recent Industry Developments
- June 2026: Vodafone Qatar P.Q.S.C. launched Business WiFi Pro, a managed WiFi solution for SMBs. The launch expands Vodafone Qatar's enterprise connectivity offerings in Qatar for SMBs. It also broadens enterprise IT services supporting digitization and smart workplaces in the SMB segment.
- May 2026: Ooredoo Q.P.S.C. established Qatar’s first quantum-safe communications link in collaboration with HBKU and the Ministry of Defense. The company advanced secure communications infrastructure within the national ICT backbone. This positions Qatar as a regional leader in quantum-safe networking and supports sovereign security for government and enterprise networks.
- May 2026: Ooredoo Q.P.S.C. launched Strategic Digital and AI Transformation Programme in partnership with Microsoft. The program supports AI-enabled cloud and edge service adoption for enterprises. It accelerates AI and cloud-driven modernization across public and private sectors, aligning with the national digital agenda.


Research Methodology Framework and Report Scope
Market Definition and Coverage
For this methodology, the Qatar ICT market captures spending in Qatar on information technology and communication technology products and services that enable compute, connectivity, and related enterprise and public-sector digital operations.
Scope exclusions: Consumer electronics device sales (such as smartphones, TVs, and PCs bought for personal use) are excluded from this market value.
Segmentation Overview
-
By Product Type
-
IT Hardware
- Computer Hardware
- Networking Equipment
- Peripherals
- IT Software
-
IT Services
- Managed Services
- Business Process Services
- Business Consulting Services
- Cloud Services
- IT Infrastructure
- Communication Services
-
IT Hardware
-
By Enterprise Size
- Small and Medium-sized Enterprises
- Large Enterprises
-
By Industry Vertical
- Government and Public Administration
- BFSI
- Energy and Utilities
- Retail, E-commerce and Logistics
- Manufacturing and Industry 4.0
- Healthcare and Life Sciences
- Oil and Gas (Up-, Mid-, Down-stream)
- Gaming and Esports
- Other Verticals
-
By Deployment Mode
- On-Premises
- Cloud-only
- Hybrid
Data Sources, Market Sizing, and Validation
Desk Research
Desk research was used to set the country context and to anchor key inputs that are difficult to verify through interviews alone, such as macro spend capacity and telecom revenue pools. We relied on public datasets and regulator publications such as Qatar Communications Regulatory Authority market reports, Planning and Statistics Authority national accounts, International Telecommunication Union indicators, World Bank macro series, and WTO trade statistics (where relevant to ICT hardware flows).
To translate these reference points into market-sizing inputs, we also reviewed company annual reports and investor updates, audited financial statements, and trusted press releases tied to major ICT rollouts. In parallel, paid subscriptions were used selectively for company financials and intelligence, news and financials monitoring, patent databases, and shipment-level import and export checks to sanity-test hardware-related assumptions. The source list here is illustrative, and many other public documents and datasets were consulted for validation and clarification during the work.
Primary Interviews and Surveys
Primary work focused on confirming what buyers are actually purchasing in-country, how budgets are allocated across IT and telecom-related lines, and what pricing and renewal patterns look like for managed services and cloud-linked connectivity. Interviews included ICT service providers, systems and network integrators, distributors, and large buyers across government and key commercial sectors, and we used follow-ups to close gaps where desk sources were too broad.
For a country market like Qatar, coverage was balanced across buyer groups inside the country rather than split by global regions. We also cross-checked responses between supply-side and demand-side views so that one viewpoint did not dominate the final assumptions.
Distribution of primary research fieldwork respondents
| Company type | Respondent position | Region |
|---|---|---|
| Top tier: 32% | CXOs: 13% | |
| Mid tier: 46% | Functional/Unit leaders: 40% | |
| Smaller Players: 22% | Managers: 47% |
Market-Sizing & Forecasting
The core sizing starts from a top-down demand pool, where national ICT spending signals, enterprise digitization intensity, and regulated telecom revenue trends are used to reconstruct the addressable market for ICT in Qatar. Those totals are then corroborated with selective bottom-up approximations, including sampled supplier revenue splits, channel checks for hardware and software pass-through, and ASP multiplied by estimated volumes for common contract types. This helps correct for double counting between resellers and service providers.
Inputs used in the model include telecom service revenue and capex intensity, public-sector digitization program pace, enterprise cloud adoption and migration timing, large-project rollout cycles in sectors like energy and transport, and pricing movement for recurring managed services and connectivity bundles. For forecasting, scenario analysis was used to reflect uncertainty in project timing and procurement phasing, and then the final path was aligned with what primary respondents expect for budget growth and renewal behavior over the forecast period. When bottom-up signals were missing for niche sub-areas, we used conservative penetration assumptions and then re-tested them through follow-up calls.
Data Validation & Update Cycle
Outputs are validated through triangulation across independent signals, and the checks are kept practical so they can be repeated. We compare implied ICT spend against macro indicators and telecom revenue pools, review outliers at the sub-market level, and then rework assumptions when the numbers do not reconcile with what buyers and suppliers describe.
Before sign-off, the model and key assumptions go through multi-step analyst reviews, followed by targeted re-contact of respondents if large variances remain. Reports are refreshed annually, with interim updates triggered by material events such as major regulatory moves, large contract announcements, or step-changes in pricing. Right before delivery, a fresh analyst pass is completed so clients receive the latest updated view.
Mordor Intelligence's Qatar Ict Market Estimate Compared With Other Published Estimates
Published estimates for Qatar ICT often vary because each publisher counts a different spending perimeter and uses different ways to convert ICT budgets into market value. In practice, the biggest swings come from whether telecom services are treated as a full in-scope pillar, how cloud and managed services are priced over time, and how much hardware is counted at end-user value versus distribution value.
Consumer electronics device purchases are kept outside Mordor Intelligence's scope. This reduces inflation from retail handset and personal device cycles that are not tied to ICT services demand in Qatar.
Benchmark comparison
| Source | Market Size | Gaps in Research Methodology |
|---|---|---|
| Mordor Intelligence | USD 17.51 B (2025) | |
| Trade Journal A | USD 6.20 B (2026) | Uses an ICT spending construct that appears closer to enterprise IT budget allocations, and it may exclude large parts of telecom service revenues and infrastructure-linked services, which compresses the total versus a full ICT market view. |
| Industry Publisher B | USD 13.30 B (2023) | Covers a wide solution list, but the base year differs and the conversion from multi-year project spending into annual market value can shift totals, especially if hardware and services are counted at different value points in the chain. |
Taken together, the spread is mainly explained by what gets counted as ICT in a given year and how telecom-related lines are treated versus pure IT spend. By keeping scope rules explicit and then rechecking totals against telecom revenue signals and buyer budget patterns, our estimate stays traceable to repeatable inputs rather than to one-off project headlines.


Key Questions Answered in the Report
How large is the Qatar ICT market in 2026 and what growth is expected by 2031?
The market is valued at USD 19.91 billion in 2026 and is projected to reach USD 37.74 billion by 2031, reflecting a 13.7% CAGR.
Which segment shows the fastest growth in Qatar’s technology spending?
Cloud Services post the steepest 21.7% CAGR as sovereign and hyperscale regions satisfy data-residency rules.
Why do on-premises deployments still dominate spending?
Critical data-sovereignty mandates and sector-specific compliance keep 63.55% of 2025 budgets on-prem, though hybrid models are gaining traction.
What is driving the surge in Qatar’s gaming and esports sector?
Purpose-built venues, government sponsorship and regional tournaments lift gaming and esports ICT outlays at a 17.3% CAGR.
Page last updated on:


