
India Q-Commerce Market Size and Share
Market Overview
| Study Period | 2020 - 2031 |
|---|---|
| Forecast Data Period | 2026 - 2031 |
| Historical Data Period | 2020 - 2024 |
| Market Size (2026) | USD 3.65 Billion |
| Market Size (2031) | USD 6.64 Billion |
| Growth Rate (2026 - 2031) | 12.74 % |
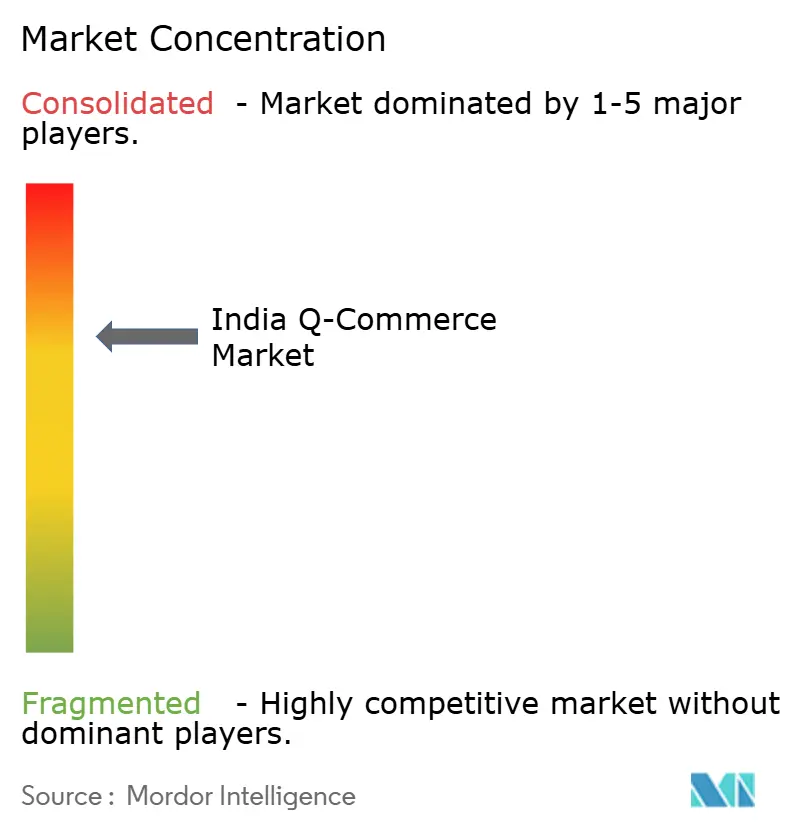
| Market Concentration | Medium |
Major Players *Disclaimer: Major Players sorted in no particular order Image © Mordor Intelligence. Reuse requires attribution under CC BY 4.0. | |
India Q-Commerce Market Analysis by Mordor Intelligence
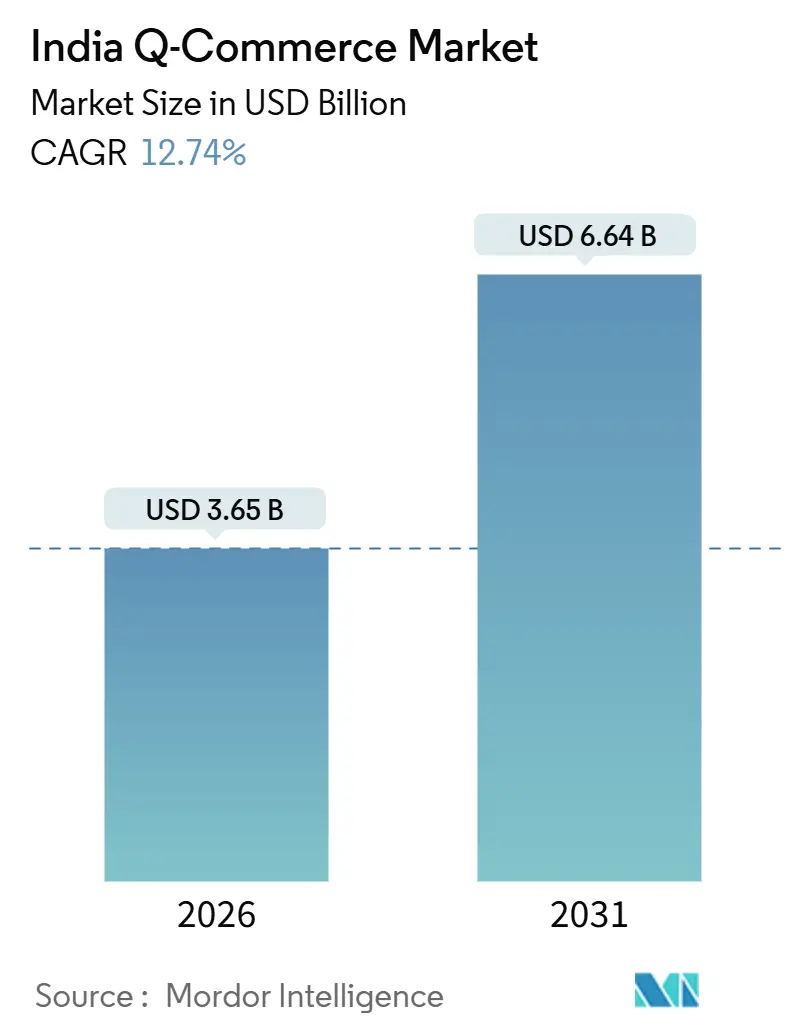
The India quick commerce market size stands at USD 3.65 billion in 2026, and it is forecast to reach USD 6.64 billion by 2031 at a 12.74% CAGR. This growth profile reflects a channel that has scaled nationwide and shifted from hyper-expansion toward profitable density in core catchments while testing expansion playbooks in secondary cities. Indian consumers increased spending on instant delivery formats through fiscal 2025, and platforms continued to strengthen category depth beyond grocery to capture larger baskets and improve contribution margins at the store level. The sector’s footprint covers more than 80 cities as of 2025, with density-led operations focused on short delivery radii and optimized assortment to sustain high on-time fulfillment rates. The format has gained a visible role within India’s wider e-retail habits, which positions the India quick commerce market as a structural part of the country’s digital shopping landscape.
Key Report Takeaways
- By product category, Grocery & Staples held 61.33% of the India quick commerce market share in 2025, while Electronics & Accessories is projected to expand at a 17.78% CAGR through 2031.
- By delivery time promise, the ≤10 minutes segment captured 62.24% of the India quick commerce market share in 2025, and the 11–30 minutes segment is projected to grow at a 15.39% CAGR through 2031.
- By city tier, Tier I Metros held 67.33% of the India quick commerce market share in 2025, and Tier II Cities are projected to expand at a 16.37% CAGR through 2031.
- By geography, West India accounted for 31.27% of the India quick commerce market share in 2025, and East India is projected to grow at a 14.44% CAGR through 2031.
Note: Market size and forecast figures in this report are generated using Mordor Intelligence’s proprietary estimation framework, updated with the latest available data and insights as of January 2026.
India Q-Commerce Market Trends and Insights
Drivers Impact Analysis*
| Driver | (~) % Impact on CAGR Forecast | Geographic Relevance | Impact Timeline |
|---|---|---|---|
| Rapid urbanization and lifestyle changes | +3.2% | Tier I Metros, expanding to Tier II cities | Medium term (2-4 years) |
| Growing demand for instant delivery | +4.1% | National, strongest in top 6 metros, rising in Tier II hubs | Short term (≤ 2 years) |
| Expansion of dark stores and micro-fulfilment centers | +2.8% | Metro cores first, scaling to Tier II clusters | Medium term (2-4 years) |
| Increasing smartphone and internet penetration | +2.3% | National, fastest adoption in Tier II/III | Long term (≥ 4 years) |
| Rising investment from e-commerce giants and start-ups | +2.6% | National, infrastructure in high-density zones | Medium term (2-4 years) |
| Source: Mordor Intelligence | |||
Rapid Urbanization and Lifestyle Changes
High population density in India’s major metropolitan areas enables shorter delivery coverage for dark stores, resulting in higher order volumes per store and more efficient, predictable inventory replenishment cycles. The concentration of affluent households in core neighborhoods lifts basket values and supports premium convenience categories for the India quick commerce market. The number of online shoppers crossed the 250 million mark by 2025, which extends the addressable base for app-driven instant delivery formats in high-penetration corridors[1]IBEF, “E-commerce Industry in India,” India Brand Equity Foundation, ibef.org. Dual-income households and time-pressed professionals sustain recurring demand for essentials, fresh foods, and ready-to-consume items that fit within micro-warehouse assortments. Tier II consumption centers are also maturing, and they provide density pockets near campuses and affluent districts that accommodate dark store clusters. This structural shift establishes dependable catchments for the India quick commerce market and underpins near-term growth visibility in major micro-markets[2]ETRetail Staff, “2025: The Year India Went Quick,” Economic Times Retail, retail.economictimes.indiatimes.com.
Growing Demand for Instant Delivery
Consumer expectations for speed have reshaped service-level norms, which makes sub-30-minute fulfillment a baseline in large metros and important Tier II cities. Platforms responded with network densification and process improvements that reduced national average delivery times across key operators. Swiggy Instamart reduced average delivery time from 17 minutes to 13 minutes during fiscal 2025 as route optimization and dark store density improved order processing cycles[3]Swiggy Limited, “Corporate Presentation,” BSE India, bseindia.com. Blinkit demonstrated extreme-speed runs under three minutes in select instances during 2025, which shows the role of near-inventory and low-latency dispatch models in the India quick commerce market. During festive 2025, instant delivery formats gained share within overall e-commerce spending as consumer adoption surged in top-city corridors with high on-time performance. This shift supports ongoing frequency and habit formation, which reinforces demand predictability for the India quick commerce market in dense urban catchments.
Expansion of Dark Stores and Micro-Fulfillment Centers
Scaled platforms expanded their dark store footprints to shorten last-mile distances and raise orders per hour throughput in busy slots. Micro-warehouses typically operate within compact formats and carry curated assortments that turn quickly within two- to three-kilometer radii. Platforms collectively expanded dense networks by mid-2025, and leaders outlined further additions through 2026 to deepen coverage and cut dispatch latency in underserved pockets. Blinkit guided toward a larger dark store count by December 2026, while Swiggy Instamart’s store base surpassed 1,100 locations across more than 100 cities, as disclosed in investor materials. Rental dynamics vary sharply across cities, which makes unit economics dependent on granular real estate markets and delivery corridor design. Dark store optimization remains a key driver of sustainable expansion for the India quick commerce market because it aligns speed with selection and cost discipline at the node level.
Increasing Smartphone and Internet Penetration
Digital reach keeps expanding and brings new shoppers into the fold of app-based retail in India. The country’s real-time payment rails support fast, low-friction checkout experiences that complement the speed of quick delivery. UPI continues to anchor digital payments, and national updates confirm its scale on transaction volumes and values in 2025[4]Press Information Bureau, “UPI Recognized as World’s Largest Real-Time Payment System,” Press Information Bureau, pib.gov.in. Meanwhile, the Open Network for Digital Commerce reached more than 616 cities by late 2025 with hundreds of thousands of onboarded merchants, which helps democratize digital commerce infrastructure across India. As device penetration and payment adoption rise, the India quick commerce market benefits from broader funnel conversion and smoother order completion in both metro and second-tier cities. These enablers add resilience to platform demand and support ongoing user acquisition in high-density zones.
Restraints Impact Analysis*
| Restraint | (~) % Impact on CAGR Forecast | Geographic Relevance | Impact Timeline |
|---|---|---|---|
| High last-mile delivery costs | -2.2% | National, acute in lower-density Tier II and Tier III cities | Short term (≤ 2 years) |
| Limited profit margins due to deep discounts | -1.9% | National, most intense in metro cities with multiple competing platforms | Medium term (2–4 years) |
| Operational challenges in Tier II and Tier III cities | -1.4% | Tier II and Tier III urban clusters, emerging suburban zones | Medium term (2–4 years) |
| Infrastructure and traffic congestion issues | -1.1% | Large metros (Delhi NCR, Mumbai, Bengaluru, Chennai) | Short to medium term (1–3 years) |
| Consumer retention and loyalty challenges | -0.9% | National, higher churn in price-sensitive urban users | Long term (3–5 years) |
| Source: Mordor Intelligence | |||
High Last-Mile Delivery Costs
Last-mile costs remain a large share of fulfillment expense because the model prioritizes speed, reliability, and tight delivery radii. Blinkit reduced delivery cost per order by 14% year-on-year to USD 0.64 (INR 55) by the fourth quarter of fiscal 2025, which highlights operational efficiency gains from network density and dispatch optimization. City-level rider availability and payout changes created friction in some markets during late 2025, which added volatility to service reliability in a few corridors. Policymakers advanced work on platform worker protections that may widen social coverage in 2026, which could alter unit-level cost structures depending on final provisions. Store throughput outside the top-city clusters can fall short of breakeven benchmarks, which pressures economics in lower-density markets where average orders per node remain constrained. These conditions weigh on near-term margins, yet operators continue to refine routing, shift planning, and assortment depth to stabilize unit economics in the India quick commerce market.
Limited Profit Margins Due to Deep Discounts
Aggressive promotions across leaders kept price sensitivity high in 2025, which made profitability harder to sustain during scale-up phases. One leading player reported widening consolidated net losses for fiscal 2025 as it invested in network expansion and promotional intensity to support the adoption of its instant delivery service. Competitive dynamics and frequent discount cycles pressured basket economics and net contribution even as gross merchandise values rose in core corridors. Market oversight has increased, and authorities stepped up actions during 2025 to ensure fair practices and to curb deceptive designs in digital commerce that undermine consumer interest. The combination of rising acquisition costs and promotional intensity demands continuous mix optimization, category expansion, and monetization through advertising to strengthen margins in the India quick commerce market. Operators continue to test private labels and subscription benefits that can lift retention and contribution per order without relying on sustained discounting.
*Our forecasts treat driver/restraint impacts as directional, not additive. The impact forecasts reflect baseline growth, mix effects, and variable interactions.
Segment Analysis
By Product Category: Essentials Anchor, Electronics Accelerate
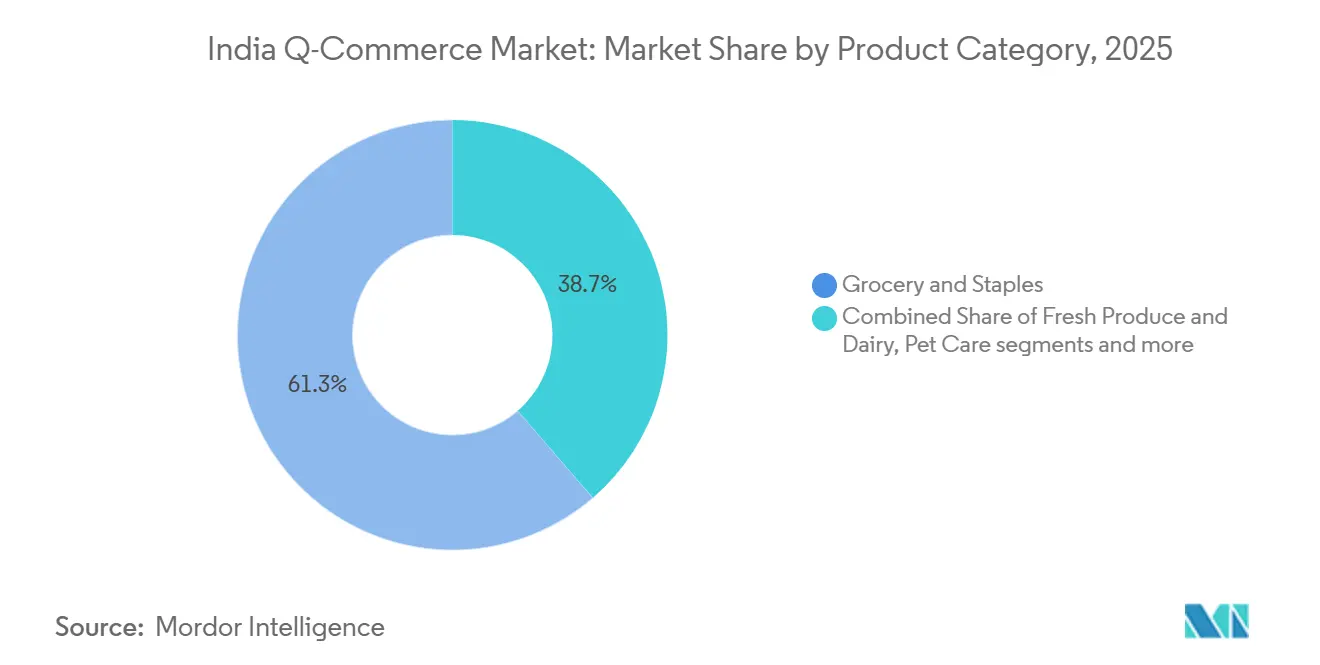
Grocery & Staples dominated the category mix with a 61.33% share in 2025, which reflects the format’s roots in daily-needs replenishment at frequent purchase intervals. Electronics & Accessories is projected to grow at a 17.78% CAGR through 2031 as platforms leverage inventory-led models and partnerships to expand beyond essentials in the India quick commerce market. Large platforms disclosed tie-ups with premium resellers and brand partners to accelerate instant delivery of high-demand launches in top-city catchments. Fresh Produce & Dairy and Snacks & Beverages support high-frequency orders and stable throughput per store because daily-use items sustain household-level recurrence for the India quick commerce market. Personal Care and over-the-counter pharmacy use cases gained traction through 2025, and leaders partnered with licensed e-pharmacies while complying with pharmacist oversight and valid prescription rules for regulated items.
Non-grocery categories, including pet care and gifting, contributed a larger slice of gross sales by late 2025 as catalogs widened in select cities with higher average order values. Flipkart disclosed that the fast expansion of Minutes increased assortment breadth and supported faster delivery promises in core metros, which pushed usage beyond essential-only baskets. As category depth increased, assortment localization at the pin code level became a core operating practice that aligns stock with neighborhood-specific demand patterns in the India quick commerce industry. Food safety authorities mandated license display and warehouse hygiene standards, which raised compliance expectations across the grocery-linked flow for instant delivery. These shifts support a broader mix while keeping quality and safety guardrails intact across increasingly complex assortments within the India quick commerce market.


By Delivery Time Promise: Sub-Ten Minutes Lead, Moderate Windows Grow
Delivery time segmentation in 2025 shows a strong consumer preference for sub-ten-minute fulfillment, which accounts for 62.24% of orders and establishes a clear speed baseline in the India quick commerce market. The 11 to 30 minutes window grows fastest at a 15.39% CAGR through 2031, which indicates customer acceptance of slightly longer timeframes that support broader assortments and improved unit economics. Platforms achieved meaningful efficiency gains through algorithmic routing and node density, which lifted on-time performance on national averages. Swiggy Instamart cut its average delivery time to 13 minutes during fiscal 2025, which illustrates steady improvements in last-mile execution for high-throughput corridors. Blinkit demonstrated isolated ultra-fast runs that show what is possible when inventory location and dispatch readiness align in tightly mapped zones.
The maturing preference for an 11 to 30-minute window suggests a practical balance between speed and breadth that supports more categories and better last-mile efficiency. This pattern integrates well with categories like electronics accessories or household supplies that can tolerate slightly longer promises while preserving convenience. Consumer protection rules require platforms to display accurate delivery timelines and provide strong grievance mechanisms, which support trust in service-level commitments for the India quick commerce market. As network design evolves, operators will continue to align service windows with category-specific expectations to stabilize costs and throughput. This approach strengthens the sustainability of the India quick commerce industry while maintaining the core expectation of fast, reliable delivery.
By City Tier: Metros Dominate, Tier II Accelerates
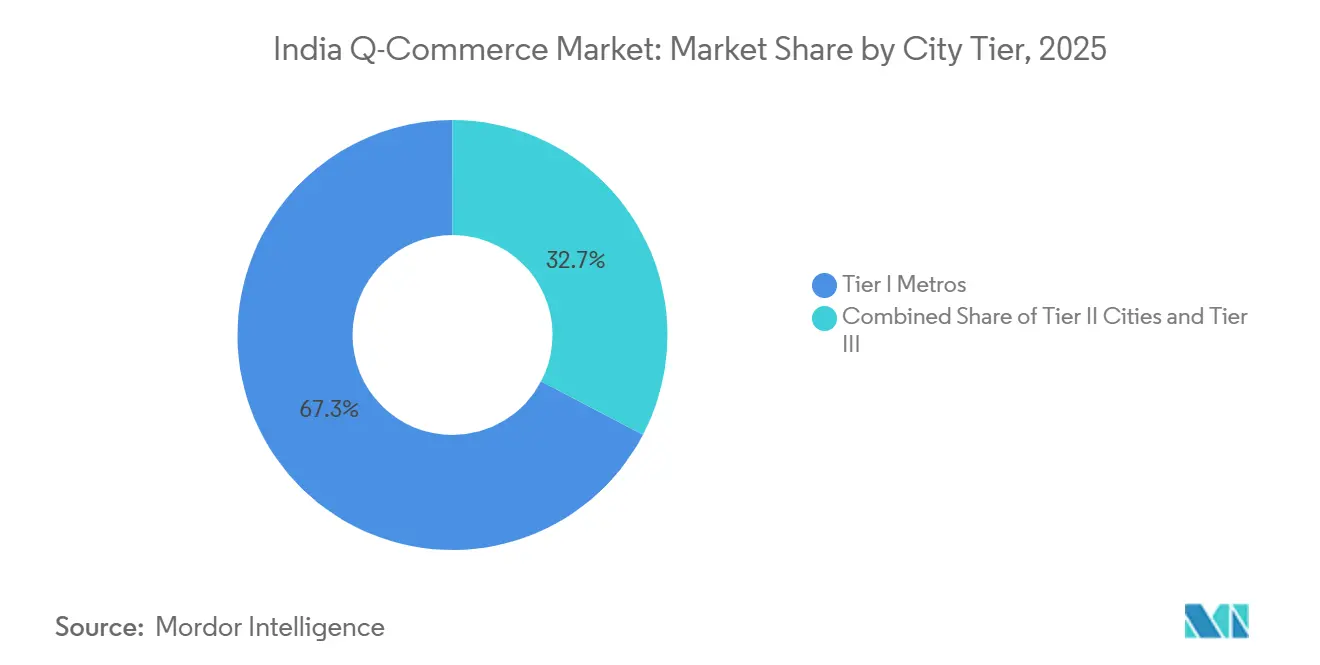
Tier I Metros held a 67.33% share in 2025, which reflects established infrastructure, strong digital payments adoption, and dense catchments that support ultra-fast delivery in the India quick commerce market. Tier II Cities record the fastest growth at 16.37% CAGR through 2031, driven by rising affluence, maturing digital adoption, and expanding dark store networks in concentrated urban pockets. Non-metro cities contribute a smaller portion of gross value relative to their share of total retail in the top 100 cities, which reflects current unit economics and delivery density constraints. Education hubs and affluent smaller cities provide encouraging outliers where catchment density supports unit-level breakeven with the right assortment. The India quick commerce market continues to add city coverage selectively, and expansions follow tested thresholds on order density and store throughput to manage profitability in new locations.
Operators disclosed broader city footprints for instant delivery in 2025, which included new Tier II entries alongside deeper metro coverage. Swiggy Instamart communicated a presence across more than 100 cities in filings and presentations, and the company added locations as network density allowed. Flipkart Minutes extended coverage and scaled its service during 2025, which integrated with existing logistics assets to serve new catchments faster in select cities. Policy initiatives focused on logistics planning and multimodal connectivity continue to improve the baseline for last-mile commerce across India. These improvements support gradual gains in coverage and unit economics for the India quick commerce market as it expands beyond the top six cities. The result is a wider footprint that remains anchored by metro density while building out sustainable pockets in the next tiers.
Geography Analysis
West India leads regional share with 31.27% in 2025, which reflects the strong contribution of Mumbai and Pune, where dense urban cores, higher incomes, and established logistics support high-throughput nodes. East India posts the fastest growth at a 14.44% CAGR through 2031, and platforms continue to expand their presence in Kolkata and other cities where digital adoption and urban density are rising. North India is anchored by Delhi NCR, which remains the single largest contributor with sophisticated logistics corridors and multiple high-density catchments. South India has sustained strong usage in Bengaluru, Hyderabad, and Chennai, and it reflects early adoption of app-based services and strong digital literacy. Central India remains underpenetrated relative to coastal regions but shows room for expansion where urbanization gains align with logistics improvements.
Intra-regional variation demands localized assortments and precise inventory planning within micro-catchments. North India’s dark stores in Delhi and Gurgaon differ from those in Lucknow or Jaipur as operators tailor more than half of SKUs to neighborhood demand signals for the India quick commerce market. West India requires differentiated category mixes across cities like Ahmedabad and Surat versus cosmopolitan Mumbai and Pune, which ensures selection efficiency at each node. East India presents seasonality and weather-related disruptions that shape network design, but platform momentum has improved with broader merchant digitization through national initiatives. These elements underscore the importance of regional nuance in the India quick commerce market, where right-size assortments support speed while maintaining sell-through.
Policy actions and compliance frameworks shape regional operating standards. Government efforts on ONDC expansion, logistics planning, and digital public infrastructure continue to ease commerce frictions and improve merchant participation across regions. Food safety directives issued in July 2025 set uniform expectations for license display, warehouse hygiene, training, and shelf-life criteria, which improve trust and product quality nationwide. Platforms align with these mandates and adjust standard operating procedures to meet regional enforcement intensity. Together, these developments support a consistent service promise in the India quick commerce market while accommodating city-specific realities. This foundation supports stable growth across priority regions through the forecast period.
Regulatory Landscape
India's quick commerce operators sit within overlapping frameworks for e-commerce conduct, food safety, labor, and foreign investment. In May 2026, the Bureau of Indian Standards (BIS) published IS 19598:2026, a voluntary self-governance standard for e-commerce, adding a formal reference point for marketplace practices and consumer-facing controls. Separately, the Food Safety and Standards Authority of India (FSSAI) compliance expectations for e-commerce food business operators (EFBOs), including hygiene, training, and safe handling, directly affect dark-store operations and last-mile handling for grocery-led baskets.
Policy and enforcement attention also increased around operating models and service promises. In January 2026, the Centre, through the Union Labour Ministry's stance reported by national business media, pushed platforms to drop 10-minute delivery branding amid worker-safety concerns, elevating scrutiny on how speed commitments translate into rider practices. In July 2026, the All India Consumer Products Distributors Federation (AICPDF) asked the Ministry of Commerce and Industry to examine whether foreign-funded e-commerce firms were running inventory-led businesses through dark stores, a flashpoint linked to India's FDI policy constraints (including Press Note 2, 2018) that permit 100% FDI in marketplace models but restrict inventory-led retailing for foreign-funded entities.
Value Chain Analysis
India's quick commerce value chain starts with brand principals and FMCG/CPG suppliers, fresh and perishable aggregators, and select category distributors feeding inventory into city-level dark stores and micro-fulfillment centers that typically serve short delivery radii (commonly cited at 2-3 km). Platforms then run store operations (receiving, put-away, picking, packing, and quality checks), followed by dispatch orchestration to a dense last-mile rider fleet. Given grocery's dominance in the mix, temperature control and food-handling processes (aligned with EFBO requirements) influence packaging, batch control, and rider training for high-frequency categories.
On the orchestration layer, platforms use app storefronts, pricing and promotion engines, and algorithmic routing alongside warehouse management and auto-replenishment logic that triggers purchase orders or inter-node transfers based on SKU thresholds. Payments and checkout are supported by India's digital public infrastructure, with UPI enabling low-friction, high-frequency transactions that fit instant delivery use cases. Business-model choices (marketplace versus inventory-led structures) shape assortment control and working-capital intensity, and the 2026 debate around foreign-funded inventory-led models via dark stores highlights how policy interpretation can affect sourcing structures, seller onboarding, and node ownership across the chain.
Competitive Landscape
Competitive intensity is high, and three platforms account for more than 90% of the consolidated market in 2025. Blinkit leads with a share near 50% after integration with its parent and an inventory-led pivot that supports private label plans, which strengthens margin opportunities in the India quick commerce market. Swiggy Instamart leverages a large food delivery user base and disclosed strong year-on-year GOV growth in fiscal 2026 while investing in dark stores and promotions to scale faster. Zepto expanded its network and diversified categories, supported by fresh funding in 2025 that sustained city-level density efforts during late 2025. The top three continue to invest in speed, assortment, and user experience, which sustains strong retention in core catchments for the India quick commerce market.
Large incumbents strengthened their presence and widened competitive pressure in 2025. Reliance Retail scaled its quick commerce reach to over 1,000 cities and 5,000 pin codes, and it used store footprints as fulfillment nodes to expand coverage and density. Flipkart Minutes broadened its service and integrated with existing logistics capabilities to compress delivery times across key categories, which raised activity in major metros. Niche players with vertical strategies, including instant grocery and fashion pilots, created category-focused options without matching the full-stack reach of the top three. Consolidation pressures became visible in late 2025 as subscale operators faced funding gaps and ceded share to leaders in metro corridors. These shifts emphasize the importance of capital depth, city-level density, and operational discipline in the India quick commerce market.
Strategic levers include private labels, advertising monetization, and subscription programs that can raise margin mix without diluting service quality. Blinkit’s plans for private label expansion follow its inventory-led transition and can complement category mixes in core cities. Advertising monetization gained traction across large platforms and can provide a recurring revenue layer to fund service reliability and innovation. Technology remains a decisive differentiator, and operators apply data science to route optimization, workforce planning, and pin code-level assortment curation. Regulatory oversight increased during 2025, and consumer authorities secured compliance declarations from leading platforms on dark pattern elimination, which reinforces fair marketplace practices in the India quick commerce market. These elements combine to shape a concentrated market with ongoing innovation and clear pathways toward sustainable unit economics.
India Q-Commerce Industry Leaders
Blinkit (Blink Commerce Private Limited)
Swiggy Limited
Zepto Marketplace Private Limited
bigbasket.com (Supermarket Grocery Supplies Pvt Ltd)
Dunzo Daily
- *Disclaimer: Major Players sorted in no particular order

Market Opportunities and Future Outlook
A large, already-built physical network creates whitespace to deepen assortment, improve utilization, and broaden city coverage without relying only on headline delivery claims. By July 2026, the ecosystem had 5,625 mapped dark stores across India, while leaders such as Blinkit operated over 2,200 dark stores, indicating room for network optimization at the node and corridor level (slotting, replenishment cadence, and throughput during peak hours). As platforms shift their consumer promise from aggressive 10-minute marketing toward wider ranges (roughly 8-30 minutes), there is an opportunity to carry more non-grocery SKUs that tolerate slightly longer service windows, supporting larger baskets and better rider utilization within the same catchments.
Opportunities also sit in enabling layers and compliance-led differentiation. Swiggy's announcement of Builders Club (April 2026) signals a move to open parts of its AI commerce stack to developers and enterprises, which can accelerate partner-led use cases such as brand launches, local assortment intelligence, and tooling for store operations and customer support. At the same time, clearer reference points such as BIS IS 19598:2026 and ongoing FSSAI EFBO expectations create room for platforms to standardize disclosures, grievance handling, dark-store hygiene, and delivery-handling SOPs across expanding footprints, helping scale into Tier II density pockets while maintaining trust and consistency in regulated categories.
Recent Industry Developments
- May 2026: Swiggy Limited reported FY26 Instamart performance with 68.8% YoY GOV growth to INR 7,881 crore and 1,143 dark stores. The density-driven expansion strengthens delivery capacity and unit economics in the quick commerce segment.
- April 2026: Swiggy Limited announced Swiggy Builders Club, an enterprise enablement program for AI-native commerce on AWS. The initiative expands ecosystem reach and accelerates deployment of commerce infrastructure across partners.
- March 2026: Blink Commerce Private Limited received INR 4.498 billion in funding from Eternal Limited. The funding supports inventory-led expansion and density in core catchments.


Research Methodology Framework and Report Scope
Market Definition and Coverage
For this study, the India q-commerce market is defined as the value of quick commerce services delivered through app or web ordering, where orders are picked locally and delivered to customers in a short time window, typically within minutes.
Scope exclusions: We exclude traditional e-commerce deliveries that follow scheduled logistics, and we also exclude offline retail sales that do not pass through a q-commerce fulfillment flow.
Segmentation Overview
- By Product Category
- Grocery & Staples
- Fresh Produce & Dairy
- Snacks & Beverages
- Personal Care & OTC Pharma
- Home & Cleaning Supplies
- Electronics & Accessories
- Pet Care
- Flowers & Gifts
- By Delivery Time Promise
- ≤ 10 Minutes
- 11–30 Minutes
- 31–60 Minutes
- By City Tier
- Tier I Metros
- Tier II Cities
- Tier III & Below
- By Region
- North India
- South India
- West India
- East India
- Central
Data Sources, Market Sizing, and Validation
Desk Research
Desk research was used to set the market boundaries, align the definition, and build the first version of the demand picture across urban India. We referred to public sources such as government publications from the Ministry of Commerce and Industry, RBI payment and digital transaction series, DPIIT updates, and MOSPI consumption and price indicators, focusing on macro shifts that affect online ordering.
We also reviewed industry and trade sources such as FSSAI and city-level licensing signals, reputed business media, plus company annual reports and investor commentary where available. For cross-checks on entity scale, we used paid subscriptions that provide company financials and structured news archives, and we referenced patent databases to track fulfillment and last mile process innovation themes. The sources mentioned here are illustrative, and we also used other public documents and datasets for collection, validation, and research clarification.
Primary Interviews and Surveys
Primary work focused on validating what desk sources could not reliably show, mainly category mix, typical order economics, and fulfillment intensity across cities. We spoke with operators, brand and supplier stakeholders, and logistics and real estate participants to check assumptions on dark store coverage, delivery radius, and serviceable demand across both major and emerging metros.
Because this is an India-specific market, respondents were prioritized across city tiers and customer cohorts, and then the inputs were reconciled against observed promotion patterns and seasonal demand swings before finalizing the model.
Distribution of primary research fieldwork respondents
| Company type | Respondent position |
|---|---|
| Top tier: 37% | CXOs: 13% |
| Mid tier: 43% | Functional/Unit leaders: 28% |
| Smaller Players: 20% | Managers: 59% |
Market-Sizing & Forecasting
Market sizing was built using a top-down approach where urban online demand is reconstructed from the addressable shopper base, order frequency, average order value (AOV), and the share of orders that shift to sub-30 minute fulfillment. Once the headline value was formed, we corroborated it with selective bottom-up checks using sampled city-level dark store density, typical service radius, and a sanity roll-up of implied throughput per store, which helped flag and adjust outliers.
Key inputs tracked and refreshed include active user adoption in leading cities, order frequency by category, AOV movement during high-promotion months, delivery fee and platform fee progression, and the mix shift from grocery into adjacent general merchandise. Forecasting used scenario analysis, where base, high, and low cases were built around how quickly new city clusters get profitable coverage and how fast AOV normalizes after heavy discounting, and then expert feedback was used to select the most realistic path. Where bottom-up visibility was limited for smaller cities, gaps were handled using penetration assumptions tied to smartphone usage and digital payments adoption, followed by checks on whether the implied delivery load stayed feasible for local infrastructure.
Data Validation & Update Cycle
Validation steps were applied before sign-off so the model stayed consistent with real-world operating constraints. We checked for unusual jumps in implied orders per user, sudden AOV swings that did not match inflation and promotion cycles, and city expansion rates that conflicted with on-ground capacity build-outs, then reviewed variances in an internal analyst pass.
We also compared outputs with independent signals such as reported GOV growth discussions, expansion in dark store networks, and category mix commentary. Clarification calls were triggered when a key assumption moved materially. Reports are refreshed annually, with interim updates for material events such as regulatory changes, sharp pricing shifts, or major capacity additions. Before delivery, a final review pass is completed so clients receive the latest updated view based on the most recent information available.
Mordor Intelligence's India Q Commerce Market Size Compared With Other Published Estimates
Published numbers for India q-commerce can look far apart because the underlying metric is not always the same, and because time periods, currency conversion, and the handling of promotions are not treated consistently. Some sources report GOV or GMV, while others move to platform revenue or service value, and the year label can vary between calendar year and fiscal year.
Key gap drivers usually come down to what is counted as q-commerce, how AOV is calculated during heavy discount windows, and whether the estimate is refreshed after major price and assortment changes. When exchange rates are applied at different points in time, and when take-rate assumptions are carried forward without fresh checks, the final USD figure can drift even if the underlying order activity is similar.
Benchmark comparison
| Source | Market Size | Gaps in Research Methodology |
|---|---|---|
| Mordor Intelligence | USD 3.65 B (2026) | |
| Credit Rating and Advisory Report A | USD 7.64 B (2025) | Uses GOV in INR for a fiscal year and converts to USD, which lifts comparability versus service value because it includes the full basket value and not just platform-side economics. |
| Business and Consulting Report B | USD 7.00 B (2024) | Reports quick commerce as GOV and blends categories and city concentration effects, which can overstate value if take-rate and AOV normalization checks are not refreshed after major promotion and assortment resets. |
The spread in the table is mainly explained by metric choice and timing, since GOV based figures are naturally larger than service value models and can shift with currency and fiscal year mapping. By keeping exchange-rate timing consistent and re-checking AOV normalization after major promotion cycles during callbacks, the sizing stays tied to repeatable inputs, which is how Mordor Intelligence reduces drift between refreshes.


Key Questions Answered in the Report
What is the current size and growth outlook for the India quick commerce market?
The India quick commerce market size is USD 3.65 billion in 2026 and is projected to reach USD 6.64 billion by 2031 at a 12.74% CAGR.
Which product categories lead usage in India’s quick delivery space?
Grocery & Staples leads with 61.33% share in 2025, while Electronics & Accessories is the fastest-growing category through 2031.
Which delivery promise is most preferred by Indian consumers for quick commerce?
≤10 minutes captures 62.24% of orders in 2025, while 11–30 minutes grows fastest as platforms balance speed with broader assortment.
Which city tiers contribute most to instant delivery in India?
Tier I Metros hold a 67.33% share in 2025, and Tier II Cities post the highest growth as density pockets and logistics improve.
Which regions lead and grow fastest in India’s quick commerce?
West India leads with 31.27% share in 2025, and East India grows fastest at a 14.44% CAGR through 2031.
Page last updated on:


 Your data is secure and never sold or shared.


