
Market Overview
| Study Period | 2021 - 2031 |
|---|---|
| Market Size (2026) | USD 70.82 Billion |
| Market Size (2031) | USD 91.47 Billion |
| Growth Rate (2026 - 2031) | 5.25 % |
| Fastest Growing Market | Asia Pacific |
| Largest Market | Asia Pacific |
| Market Concentration | Medium |
Major Players *Disclaimer: Major Players sorted in no particular order Image © Mordor Intelligence. Reuse requires attribution under CC BY 4.0. | |
Pumps Market Analysis by Mordor Intelligence
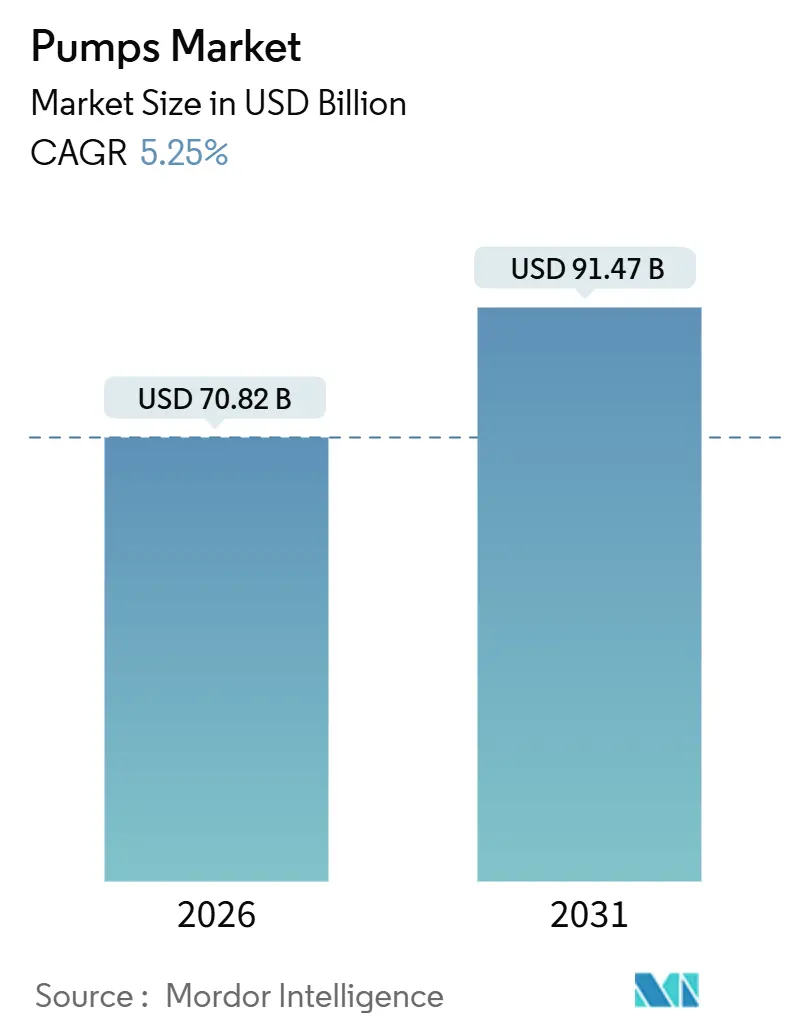
The Pumps Market size is estimated at USD 70.82 billion in 2026, and is expected to reach USD 91.47 billion by 2031, at a CAGR of 5.25% during the forecast period (2026-2031).
Sustained spending on municipal water systems, escalating CAPEX for desalination across MENA and Asia-Pacific, and regulatory pressure for tertiary wastewater treatment in Europe are anchoring unit volumes. At the same time, solar-powered systems for off-grid irrigation and the gradual adoption of magnetically driven sealless designs in bioprocessing are reshaping the competitive playbook. Chinese manufacturers continue to compress margins in standardized centrifugal lines, compelling Western incumbents to focus on engineered-to-order niches and digital service overlays. Raw-material volatility, particularly nickel-linked duplex stainless steel, remains the principal earnings headwind for mid-tier assemblers, while thermal-coal retirements in OECD countries curb circulation-pump replacements. Across these cross-currents, the pump market maintains mid-single-digit growth visibility thanks to desalination, shale midstream additions, and district cooling projects that require large, high-reliability units.
Key Report Takeaways
- By pump type, centrifugal designs captured 56.97% of 2025 revenue in the pump market share and are forecast to advance at a 6.00% CAGR through 2031.
- By drive technology, electric-motor installations accounted for 74.90% of the pump market size in 2025, while solar and other renewables delivered the highest 9.30% CAGR to 2031.
- By position, surface pumps held a 57.63% pump market share in 2025; submersible variants register the fastest 8.30% CAGR through 2031.
- By application, water and wastewater commanded 52.11% of the pump market size in 2025 and will grow at 5.85% through 2031.
- By geography, Asia-Pacific generated 53.27% of 2025 revenue and is expected to post a 5.90% CAGR, the quickest among all regions.
Note: Market size and forecast figures in this report are generated using Mordor Intelligence’s proprietary estimation framework, updated with the latest available data and insights as of January 2026.
Global Pumps Market Trends and Insights
Drivers Impact Analysis*
| Driver | (~) % Impact on CAGR Forecast | Geographic Relevance | Impact Timeline |
|---|---|---|---|
| Escalating CAPEX in Desalination Projects across MENA & APAC | 1.2% | MENA core (Saudi Arabia, UAE, Qatar), APAC (India, China coastal provinces) | Medium term (2-4 years) |
| Stringent Wastewater Reuse Mandates in Europe & North America | 0.9% | EU-27, United Kingdom, United States, Canada | Short term (≤ 2 years) |
| Rapid Expansion of Shale & Deepwater O&G Projects in US Gulf & Brazil | 0.8% | United States (Gulf of Mexico, Permian Basin), Brazil (Santos Basin pre-salt) | Long term (≥ 4 years) |
| Surging District Cooling & Heating Installations in Nordics & Middle East | 0.7% | Nordic countries (Sweden, Denmark, Finland), Middle East (UAE, Qatar, Saudi Arabia) | Medium term (2-4 years) |
| Electrification of Agricultural Irrigation (Solar Pumps) in India & Africa | 0.7% | India (Rajasthan, Gujarat, Maharashtra), Sub-Saharan Africa (Kenya, Ethiopia, Nigeria) | Long term (≥ 4 years) |
| Source: Mordor Intelligence | |||
Escalating CAPEX in Desalination Projects across MENA & APAC
Saudi Arabia’s National Water Strategy directs USD 13 billion to reverse-osmosis capacity through 2030, pulling forward demand for high-pressure centrifugal units with duplex stainless-steel internals that resist chloride stress cracking. The UAE’s Abu Dhabi Water and Electricity Authority awarded a USD 1.1 billion contract in March 2025 for the Taweelah RO-3 plant, which specifies 12 multistage centrifugal pumps rated at 1,200 m³/h each. India’s Jal Jeevan Mission earmarked INR 60,000 crore (USD 7.2 billion) in 2025-26 for coastal desalination pilots, mandating energy-recovery devices that cut lifecycle pumping costs by up to 30%. China’s 14th Five-Year Plan adds 2.9 million m³/day of desalination by 2027, with utilities pre-qualifying pump OEMs under ISO 9001 and API 610 standards. Each 100,000 m³/day module demands 8-12 feed pumps plus matching brine-circulation units, advancing near-term bookings for centrifugal lines.
Stringent Wastewater Reuse Mandates in Europe & North America
The EU’s updated Urban Wastewater Treatment Directive obliges tertiary treatment for towns above 10,000 population equivalents by December 2030, prompting 6,200 facilities to retrofit 4-6 additional variable-frequency-drive pumps per site.[1]European Commission, “Urban Wastewater Treatment Directive Revision,” europa.eu In California, the 2023 Water Resilience Portfolio targets 30% recycled-water use by 2030, releasing USD 2.8 billion for treatment-plant upgrades that incorporate booster pumps to compensate for membrane pressure drops. Pending U.S. PFAS limits will force 12,000 public systems to install new pumping stages linked to granular activated carbon trains. Utilities favor OEMs offering corrosion-resistant alloys and IE3-plus motor efficiencies, accelerating order flow in the short term.
Rapid Expansion of Shale & Deep-water O&G Projects in US Gulf & Brazil
US Gulf of Mexico output is set to reach 2.1 million bpd by 2027, raising demand for electric submersible pumps certified to 10,000 psi.[2]U.S. Energy Information Administration, “Gulf of Mexico Oil Production Forecast,” eia.gov Petrobras has allocated USD 102 billion through 2029 to pre-salt developments that each require 30-40 API 610 centrifugal pumps for crude transfer and seawater injection. Onshore, Permian midstream operators deploy multiphase pumps accommodating >90% gas-liquid ratios, with bookings up 22% year on year at Baker Hughes. Long project lead times provide visibility yet expose OEMs to commodity-price swings that can delay final investment decisions.
Surging District Cooling & Heating Installations in Nordics & Middle East
Dubai targets 1.2 million refrigeration tons of district cooling by 2030, each chiller plant using 600-1,200 kW circulation pumps sized for 3,000 m³/h flow. Sweden’s district heating penetration reached 91% of residences by 2025, prompting retrofits with variable-speed pumps that cut energy use 15-20%. Grundfos landed a EUR 18 million order in June 2025 for 240 IoT-enabled pumps across Helsinki’s 1,400-km network. Qatar’s Lusail plant employs 16 vertical in-line pumps rated at 450 kW each to serve 200,000 residents. Regulations such as EU Ecodesign and ASHRAE 90.1 are phasing out fixed-speed units, cementing growth for high-efficiency models.
Restraints Impact Analysis*
| Restraint | (~) % Impact on CAGR Forecast | Geographic Relevance | Impact Timeline |
|---|---|---|---|
| Volatility in Nickel & Stainless-Steel Prices Inflating BoM | -0.6% | Global, with acute impact in Europe and North America | Short term (≤ 2 years) |
| Proliferation of Low-cost Chinese Manufacturers Compressing Margins | -0.5% | Global, most pronounced in Asia-Pacific and Middle East municipal segments | Medium term (2-4 years) |
| Declining Thermal Power Pipeline in OECD Curtailing Circulation Pumps | -0.4% | OECD countries (Germany, UK, United States, Japan) | Long term (≥ 4 years) |
| Long Municipal Replacement Cycles (15–20 yrs) Limiting Annual Sales | -0.3% | North America, Western Europe, Japan | Long term (≥ 4 years) |
| Source: Mordor Intelligence | |||
Volatility in Nickel & Stainless-Steel Prices Inflating BoM
Nickel spot prices rose 18% in Q1 2025 before easing 9% by year-end, pushing duplex stainless-steel surcharges up 7-11% at European mills.[3]London Metal Exchange, “Nickel Price Dashboard,” lme.com A 10% nickel move raises impeller and casing costs 4-6%, squeezing equipment margins 150-200 bp among mid-tier OEMs. Flowserve recorded a USD 42 million material-inflation headwind in 2024 despite escalation clauses on long-cycle orders. Smaller Asian fabricators lacking hedging programs face deeper margin erosion because material substitution is limited in chloride-rich or sour-gas services. Bid validity periods have shortened, and some contractors insist on owner-supplied materials to mitigate exposure.
Proliferation of Low-cost Chinese Manufacturers Compressing Margins
Chinese brands, including Leo, Shimge, and CNP, now hold 15-20% of global municipal and light-industrial volume, offering API 610-equivalent units at 60-70% of Western list prices and extending 24-month payment terms. Xylem cited lost bids in Indonesia and the Philippines due to aggressive pricing in its Q3 2024 earnings call. Grundfos responded with a lower-cost line launched in 2024 that trims the bill of materials by 15-20%. While engineered-to-order petrochemical and subsea pumps remain protected by metallurgical traceability and multi-year service contracts, Chinese entrants are reinvesting profits into R&D for high-temperature, high-pressure models that could erode this buffer after 2027.
*Our forecasts treat driver/restraint impacts as directional, not additive. The impact forecasts reflect baseline growth, mix effects, and variable interactions.
Segment Analysis
By Pump Type: Centrifugal Dominance Anchors Installed Base
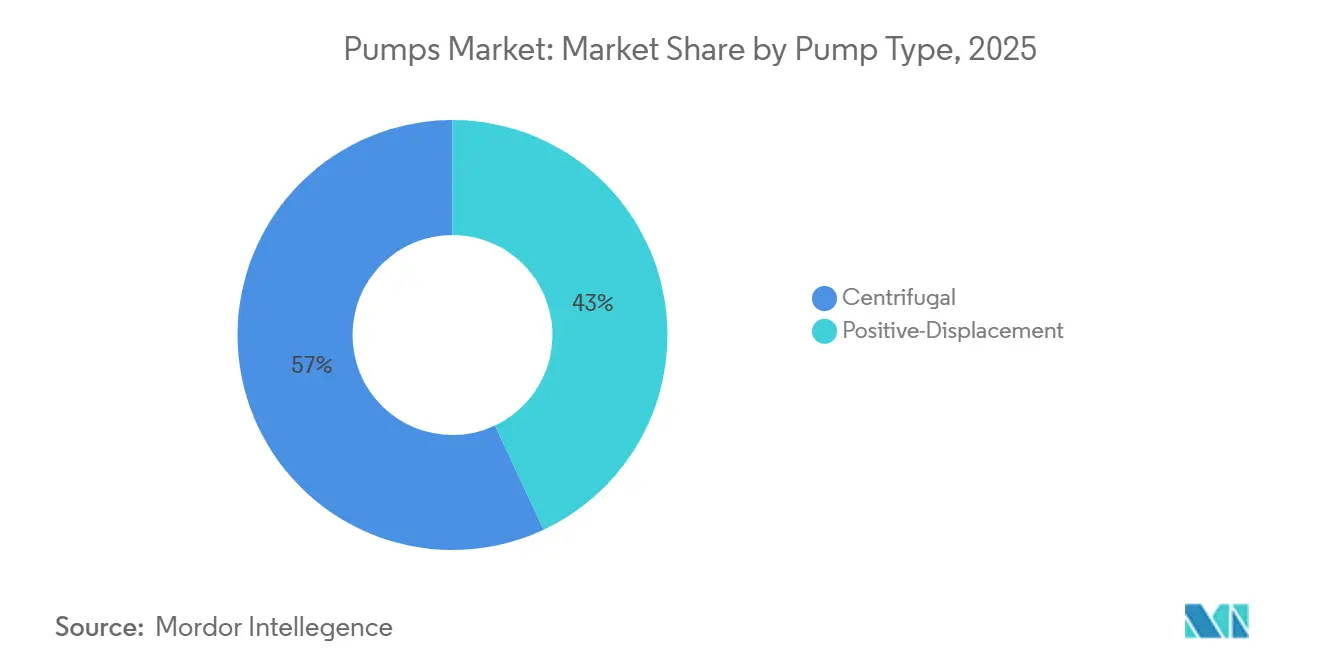
Centrifugal designs accounted for 56.97% of 2025 revenue in the pump market and will register a 6.00% forecast CAGR on the back of desalination modules, municipal upgrades, and HVAC retrofits. The Ras Al Khair facility in Saudi Arabia alone operates 18 multistage centrifugal pumps rated at 1,800 m³/h, highlighting the scale advantage centrifugal frames command in high-flow, moderate-head duty.[4]Sulzer AG, “Ras Al Khair Desalination Reference Case,” sulzer.com Their mature supply chain, standardized footprints under ANSI B73.1 and ISO 2858, and broad aftermarket network cut lifecycle costs 20-30% relative to positive-displacement alternatives. Progressive-cavity, diaphragm, and gear pumps together form the remainder of the market, finding steady but niche growth in viscous-fluid and metering applications where self-priming or shear-sensitive handling is non-negotiable.
Positive-displacement models retain firm footholds in pharmaceuticals, dairy, and heavy-oil transfer. The US FDA’s 2024 guidance on continuous biologics manufacturing is pivoting facilities toward single-use diaphragm pumps that eliminate cross-contamination risk. In Canada’s Athabasca region, screw pumps able to lift 10,000 cP crude are replacing centrifugal units that stall under high viscosity. However, centrifugal units will continue to dominate the pump market size for water, wastewater, and HVAC thanks to modular designs, lower capital intensity, and easier field maintenance.


By Drive Technology: Electric Motors Lead, Solar Surges
Electric motors powered 74.90% of installations in 2025, a share expected to erode only modestly as IE3 and IE4 efficiency mandates accelerate retrofits across Europe and North America. Variable-frequency drives integrated with induction motors can slash energy draw 20-30% by matching pump speed to real-time demand. Diesel and gas engines now mainly serve remote or emergency settings because compliance with Tier 4 Final and Stage V exhaust limits adds USD 8,000–15,000 in after-treatment costs above 56 kW.
Meanwhile, solar-driven configurations, a slender 6.50% of 2025 volume, are scaling fastest at a 9.30% CAGR. India’s PM-KUSUM subsidy has already deployed 1.8 million systems, shrinking farmer payback periods to four years. Pay-as-you-go models leveraging mobile money in Kenya, Ethiopia, and Nigeria distribute capital costs over 24–36 months, removing the upfront barrier for smallholders. At the premium end, magnetically driven sealless pumps serve life-science and fine-chemical plants where zero leakage outweighs 40-50% higher list prices; Flowserve logged a 12% jump in 2024 orders for such units. The drive-technology split consequently bifurcates: grid-tied electric motors hold entrenched positions in urban industry, solar expands off-grid acreage, and mag-drive variants protect high-value sterile-transfer niches.
By Position: Surface Pumps Prevail, Submersibles Gain in Deepwater
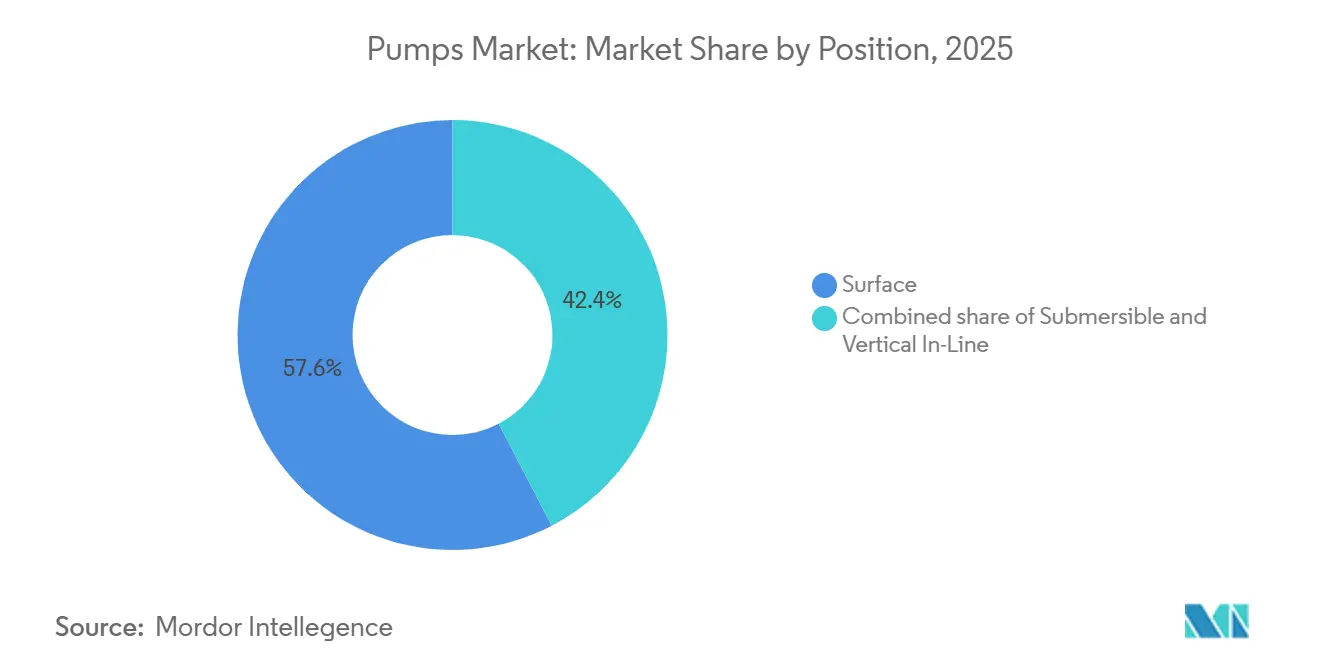
Surface-mounted pumps supplied 57.63% of 2025 shipments in the pump market, favored for ease of service and lower capex in municipal plants and HVAC loops. Horizontal split-case pumps dominate water-utility trunk lines because technicians can replace impellers without disturbing pipework, limiting outages to six hours. End-suction models account for most building-services installations under 30 kW, where compact footprints outweigh marginal efficiency gains.
Submersible units, 28.07% of 2025 demand, will clip along at an 8.30% CAGR to 2031 as deepwater projects in Brazil and the US Gulf of Mexico mature and municipal lift stations prioritize noise abatement. Petrobras plans to install 240 electric submersible pumps rated for 10,000 psi downhole duty through 2029. Xylem’s clog-resistant sewage models are extending the mean time between services to 36 months in urban lift stations. Vertical in-line units retain utility where floor space is constrained, yet coal retirements in OECD regions are thinning their installed base in thermal power settings. The position split, therefore, reflects a balance between maintenance access, energy efficiency, and duty depth, with submersibles climbing where suction-lift losses or acoustic limits dominate decision criteria.
By Application: Water and Wastewater Anchor Demand
Water and wastewater projects delivered 52.11% of 2025 revenue in the pump market and will advance at a 5.85% CAGR, reflecting aging mains in North America and mandated tertiary treatment across Europe. The American Water Works Association pegs US utility capex needs at USD 1 trillion by 2040, of which pumps comprise roughly 10%. Each reverse-osmosis train added under the EU desalination push necessitates eight or more 60-bar feed pumps, ensuring steady centrifugal order flow. Chemical and petrochemical sites, by contrast, are seeing delayed FIDs due to ethylene oversupply in China and the Middle East, limiting upside to a 4.90% CAGR.
HVAC and building services represent 11.20% of 2025 turnover and are rising at 5.10% on district cooling in Dubai, Doha, and Riyadh, plus heat-pump retrofits across Scandinavia. Oil and gas covers 9.80% of sales; growth tilts toward subsea artificial lift and shale midstream while onshore drilling retreats in North America. Mining, food and beverage, and life-science customers each carve out smaller but healthy niches, the latter benefiting from sealless designs that avoid batch contamination in biologics plants.
Geography Analysis
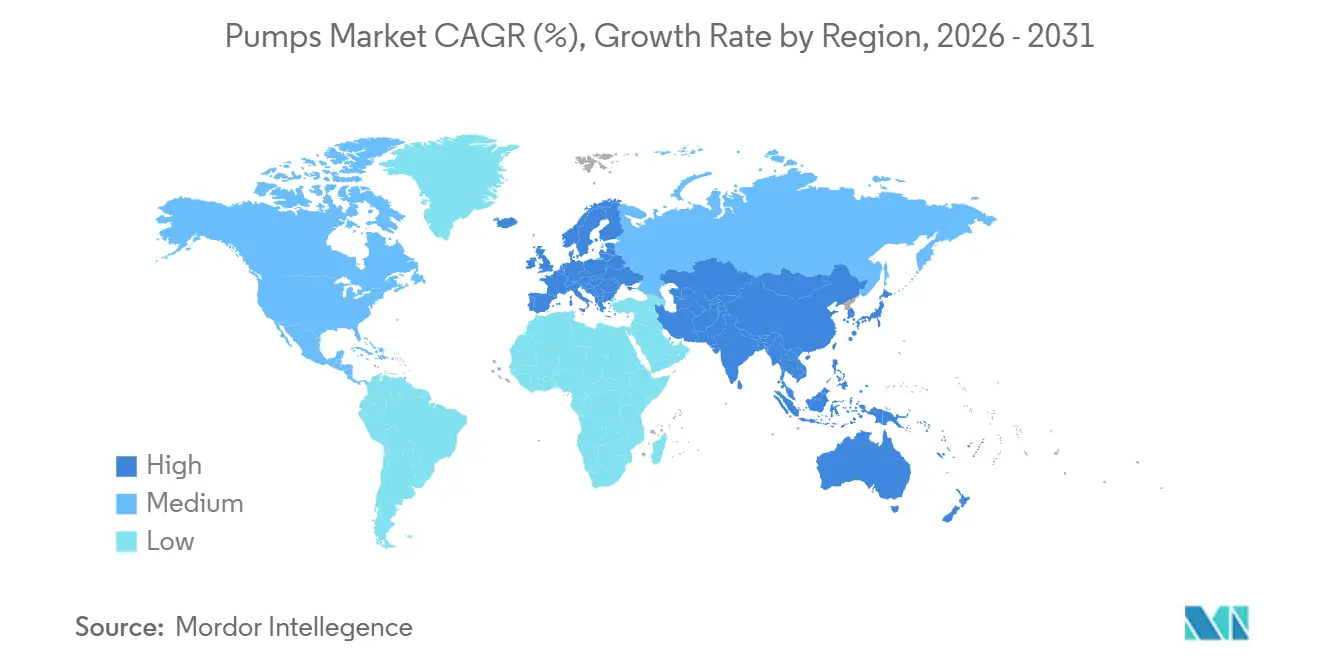
Asia-Pacific commanded 53.27% of the 2025 global revenue in the pump market and is projected to grow at a 5.90% CAGR to 2031. India’s Jal Jeevan Mission alone needs 2.5–3 million submersible borehole pumps plus 800,000 boosters for elevated storage, while PM-KUSUM underwrites solar sets for 3.5 million smallholders. China adds nearly 3 million m³/day of desalination by 2027 in Tianjin, Qingdao, and Dalian. Southeast Asian manufacturing growth at 8.3% is spurring industrial-process demand in Vietnam and Thailand.
Europe accounted for 21.40% of 2025 revenue and advances at a 4.70% CAGR. Tertiary-treatment retrofits under the Urban Wastewater Directive affect 6,200 plants, while decarbonizing district heating across Sweden and Denmark stimulates variable-speed pump upgrades. Coal retirements eliminate some boiler-feed replacements, yet Thames Water’s USD 5.5 billion Tideway Tunnel requires 36 large units by 2027.
North America held 14.60% of 2025 turnover, forecast to expand at 4.90%. Deepwater development, notably Shell’s Whale project and BP’s Mad Dog 2, locks in submersible orders, while California’s recycled-water mandate drives tertiary-treatment retrofits. Canada’s heavy-oil segment relies on progressive-cavity pumps, balancing lost thermal-coal circulation demand.
South America delivered 6.30% of 2025 sales and grew at 5.60% on Brazil’s pre-salt projects and Chilean copper mine expansions. Middle East and Africa, 4.43% of 2025 value, outpace at 6.10% CAGR thanks to desalination CAPEX and solar-pump rollouts in Kenya, Ethiopia, and Nigeria.

Regulatory Landscape
Energy-efficiency regulation remains a primary compliance driver for pump OEMs serving building services and municipal water systems. In the United States, the Department of Energy (DOE) published a final rule on May 20, 2024 establishing new energy conservation standards for circulator pumps, effective August 5, 2024, with manufacturer compliance required by May 22, 2028. The timeline influences product redesign and certification planning under 10 CFR Part 431.
In Europe, the Ecodesign framework continues to set minimum efficiency requirements for rotodynamic water pumps through the Minimum Efficiency Index (MEI) under Regulation (EU) 547/2012, administered by the European Commission. These efficiency floors, together with market surveillance and procurement specifications tied to Ecodesign performance, support wider adoption of high-efficiency hydraulics, IE3/IE4-class motor pairings, and variable-speed operation in regulated applications.
Competitive Landscape
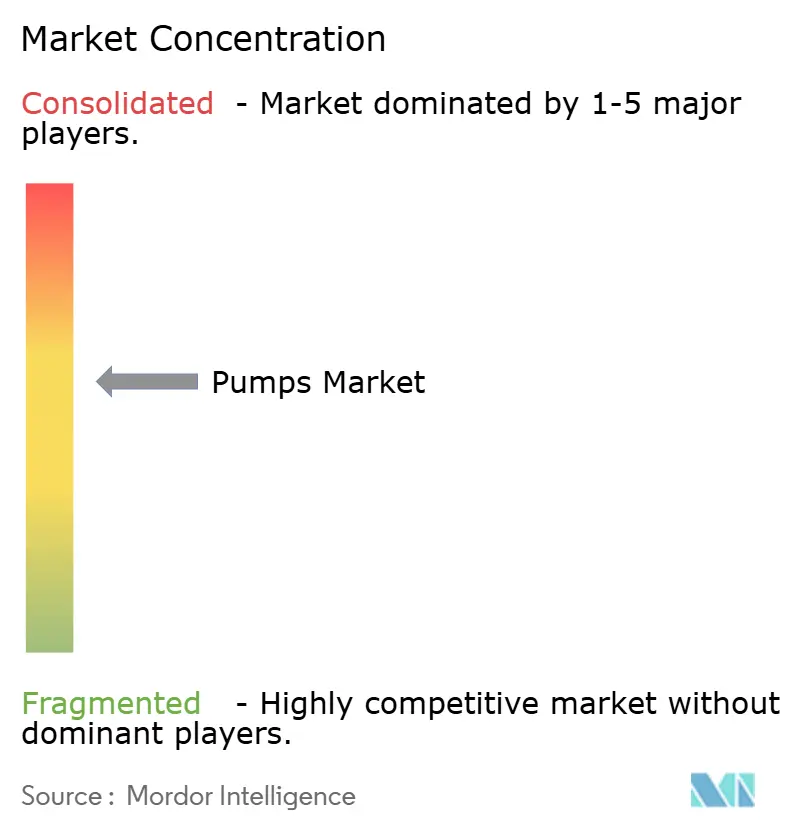
The top five suppliers, Flowserve, Grundfos, Xylem, KSB, and Sulzer, collectively command roughly 30–35% of global revenue, evidencing moderate fragmentation in the pump market. Western leaders are migrating toward engineered-to-order niches requiring exotic metallurgy, API 610 compliance, and digital performance guarantees. Flowserve reported a 12% year-on-year rise in magnetically driven pump orders for bioprocessing in its 2024 filings. Chinese challengers such as Leo Group, Shimge, and CNP have grabbed up to 20% share in municipal and light-industrial tenders by pricing 20–30% below Western lists and matching warranty periods. To defend margins, Grundfos introduced a value-priced line in 2024 and invested EUR 250 million in a 120,000 m² Indian plant that will produce 1.2 million units annually by 2026.
Digitalization is now table stakes. Grundfos iSOLUTIONS counts 180,000 connected pumps transmitting real-time data to the cloud, lowering unplanned downtime by 25–30%. Xylem Vue monitors 1.2 million metering endpoints, feeding analytics that stretch asset life 15–20%. Smaller regional fabricators struggle to finance comparable platforms and may seek partnerships or consolidation. Value-chain newcomers include African pay-as-you-go solar financiers unbundling hardware from service and additive-manufacturing startups printing titanium impellers that trim lead time 60%.
In this landscape, hybrid solar-diesel packages for remote mining, digital twins for predictive maintenance in district heating, and modular desalination skids for island utilities represent white-space opportunities. Conversely, standardized water-distribution pumps face commodity pricing, with Chinese imports achieving 95% on-time delivery. Over the medium term, expect M&A centered on software or material science capabilities rather than pure capacity.
Pumps Industry Leaders
Flowserve Corporation
Grundfos Holding A/S
KSB SE & Co. KGaA
Sulzer Ltd.
Xylem Inc.
- *Disclaimer: Major Players sorted in no particular order

Market Opportunities and Future Outlook
Regionalized manufacturing capacity additions and portfolio moves in water treatment point to whitespace around faster delivery, packaged solutions, and engineered compliance for municipal and industrial water users. In June 2026, Grundfos broke ground on a production expansion at its Brookshire, Texas campus to lift capacity for water utility and commercial pump systems (with an estimated 75,000 units of annual capacity). In June 2026, KSB advanced a modernization and capacity increase program for its Eta production facility in Frankenthal, Germany (investment exceeding EUR 70 million, and a stated increase from 54,000 to 65,000 units annually by 2030). These projects support shorter lead times for standardized centrifugal lines and free capacity for desalination, district energy, and industrial retrofits.
Technology and specification shifts also create monetization paths beyond first-sale equipment, including VFD retrofit packages, connected monitoring, and predictive maintenance for critical fleets where uptime and energy consumption drive buying decisions. The installed base in district cooling and heating, alongside regulatory pressure for pump and circulator efficiency in the EU and the United States, supports bundled upgrades combining high-efficiency hydraulics, variable-speed drives, and condition monitoring. Investments and acquisitions in water treatment, such as Grundfos adding pharmaceutical and commercial-industrial treatment capabilities via MECO and the Culligan commercial and industrial business, broaden addressable demand for complete treatment skids and high-purity applications where controlled leakage risk, validated materials, and stable flow control are required.
Recent Industry Developments
- July 2026: Grundfos completed the acquisition of Culligan's Commercial and Industrial business in Italy, France, and the UK, expanding its water treatment solutions footprint in key European end markets. The deal strengthens Grundfos in packaged treatment and service-led offerings where pumping, controls, and water quality equipment are purchased together.
- June 2026: Flowserve completed its acquisition of the Trillium Flow Technologies Valves Division for USD 490 million, widening its valve portfolio across conventional and emerging applications. The combined offering supports larger, integrated project scopes where pumps, valves, and flow-control services are specified and maintained as a single system.
- October 2025: KSB entered a cooperation agreement with HERMETIC-Pumpen GmbH focused on canned motor pumps for the global nuclear market. The partnership combines complementary know-how in hermetically sealed designs, supporting access to higher-specification projects that prioritize leakage-free operation and long service intervals.


Research Methodology Framework and Report Scope
Market Definition and Coverage
For this study, the pumps market is defined as the value of complete pump units sold for moving liquids in industrial, municipal, agricultural, building-services, and energy use. We treat the market as first-sale revenues and focus on pump equipment demand rather than downstream service activity.
Scope exclusions: Aftermarket spare parts, pump rentals, and very small niche devices (such as medical infusion and microfluidic pumps, plus low-power HVAC circulators) are excluded from the core market totals.
Segmentation Overview
- By Pump Type
- Centrifugal
- Positive-Displacement
- By Drive Technology
- Electric Motor
- Diesel/Gas Engine
- Solar/Renewable
- Magnetically-Driven/Sealless
- By Position
- Surface
- Submersible
- Vertical In-Line
- By Application
- Water and Wastewater
- Chemical and Petrochemical
- HVAC and Building Services
- Oil and Gas (Upstream, Midstream, Downstream)
- Food and Beverage
- Mining and Metals
- Power Generation (Thermal, Nuclear, Renewables)
- Pharmaceuticals and Biotech
- Others
- By Geography
- North America
- United States
- Canada
- Mexico
- Europe
- United Kingdom
- Germany
- France
- Spain
- NORDIC Countries
- Russia
- Turkey
- Rest of Europe
- Asia-Pacific
- China
- India
- Japan
- South Korea
- Malaysia
- Thailand
- Indonesia
- Vietnam
- Australia
- Rest of Asia-Pacific
- South America
- Brazil
- Argentina
- Colombia
- Rest of South America
- Middle East and Africa
- Saudi Arabia
- United Arab Emirates
- South Africa
- Egypt
- Nigeria
- Qatar
- Rest of Middle East and Africa
- North America
Data Sources, Market Sizing, and Validation
Desk Research
Desk research starts with public anchors that help us set realistic demand signals for pumps and the industries that buy them. We reviewed sources such as USGS water-use and industrial indicators, US Energy Information Administration activity data, International Energy Agency energy and industry series, World Bank and OECD macro and construction indicators, and UN Comtrade trade flows for pump-related categories. These inputs help show direction and scale for end markets where pumping systems are installed.
We also used public company filings and investor materials to understand product mixes, regional exposure, and pricing commentary, which helps when setting ASP movement and margin checks. In a few places, we referenced paid subscriptions for company financials and intelligence, shipment-level import/export views, and patent databases to validate technology shifts and demand timing. The desk sources listed here are illustrative, and many other public and paid references were used for data collection, cross-checks, and clarification.
Primary Interviews and Surveys
Primary work was used to pressure-test the desk assumptions, especially around buying cycles, channel inventory effects, and how pricing is being reset across regions. We spoke with a mix of manufacturers, distributors, EPC stakeholders, and end users across APAC, EMEA, and the Americas. Then we used those discussions to align volumes, replacement demand, and typical ASP ranges by pump class.
Distribution of primary research fieldwork respondents
| Company type | Respondent position | Region |
|---|---|---|
| Top tier: 28% | CXOs: 15% | APAC: 45% |
| Mid tier: 56% | Functional/Unit leaders: 33% | EMEA: 37% |
| Smaller Players: 16% | Managers: 52% | Americas: 18% |
Market-Sizing & Forecasting
Sizing is built by using a top-down approach where end-market activity and investment signals are translated into pump demand pools, and then filtered through realistic replacement cycles and project timing. In practice, we map variables such as municipal water and wastewater capex, industrial production trends, oil and gas and power project activity, construction and building-services intensity, and pump import/export movement to estimate unit demand direction by region.
Once that structure is in place, the values are corroborated with selective bottom-up approximations, such as sampled supplier revenue splits, distributor channel checks, and ASP times volume logic for key pump families. Where direct volume visibility is limited, gaps are handled by using proxy indicators (for example, sector capex and installed base replacement) and then correcting the output with primary feedback on utilization and order books. For the forecast, scenario analysis is used around key drivers like energy prices, infrastructure funding pace, and industrial spending, and the final path is chosen after the driver assumptions are reviewed with interview inputs.
Data Validation & Update Cycle
Validation is done through multiple checks so the totals stay consistent with real-world signals. We compare the model outputs with independent indicators like trade direction, capex cycles, and publicly discussed pricing moves, and then investigate spikes that do not match the expected seasonality or project cadence. A second analyst review is completed before sign-off, and clarifications are re-confirmed with select respondents when variances stay unresolved.
The report is refreshed on an annual cycle, and interim revisions are triggered when material events change demand or pricing assumptions. Before delivery, a final freshness pass is completed so the view reflects the latest available public data and any confirmed market shifts.
Mordor Intelligence's Pumps Market Size Compared Against Other Published Estimates
Published market sizes for pumps do not always match because update timing, currency conversion date, and price build assumptions can shift the final value even when the topic sounds the same. Differences also show up when one study uses a single base year snapshot, while another continuously adjusts for project delays, inventory cycles, and sector-specific replacement behavior.
In this study, the market is kept tied to first-sale pump equipment revenues, and the pricing path is checked against repeated interview inputs and public commentary before the final totals are locked for the base year. The spread in the table is mainly explained by scope boundaries like including or excluding small niche pump categories, plus how aggressively ASP expansion is applied across regions and industries, and these choices are then amplified by each publisher's refresh cadence and FX timing.
Benchmark comparison
| Source | Market Size | Gaps in Research Methodology |
|---|---|---|
| Mordor Intelligence | USD 70.82 B (2026) | |
| Global Consultancy A | USD 61.88 B (2025) | Uses a different base year and a broader stated segmentation without clear exclusions, which can pull in adjacent pump uses and shift totals. The estimate also appears more sensitive to a single-year revenue snapshot and may apply a smoother ASP curve that dampens near-term price resets. |
| Industry Publisher B | USD 62.33 B (2025) | Base year and forecast window differ, and the product and application scope is not clearly separated from niche devices, which can change what is counted as a pump sale. Currency timing and the assumed pace of infrastructure and industrial capex can also move the 2025 value up or down. |
Overall, the range is not surprising because base year selection and what gets counted as equipment revenue versus adjacent categories are doing most of the work. By locking the scope to complete pump units, validating the price path with repeated checks, and refreshing assumptions close to the base year close, the final number stays traceable to clear variables and repeatable steps, a discipline applied by Mordor Intelligence.


Key Questions Answered in the Report
What is the current global pump market size?
The pump market size reached USD 70.82 billion in 2026.
How fast is the pump market expected to grow?
Revenue is forecast to rise at a 5.25% CAGR, pushing value to USD 91.47 billion by 2031.
Which region leads demand for pumps?
Asia-Pacific generated 53.27% of 2025 revenue thanks to desalination build-outs and industrial expansion.
What pump type holds the largest market share?
Centrifugal models accounted for 56.97% of 2025 revenue.
Why are solar-powered pumps growing quickly?
Subsidies such as India’s PM-KUSUM and mobile-money financing in Africa cut ownership costs, fueling a 9.30% CAGR for solar drives.
Page last updated on:


 Your data is secure and never sold or shared.


