
Public Wi-Fi Market Size and Share
Market Overview
| Study Period | 2020 - 2031 |
|---|---|
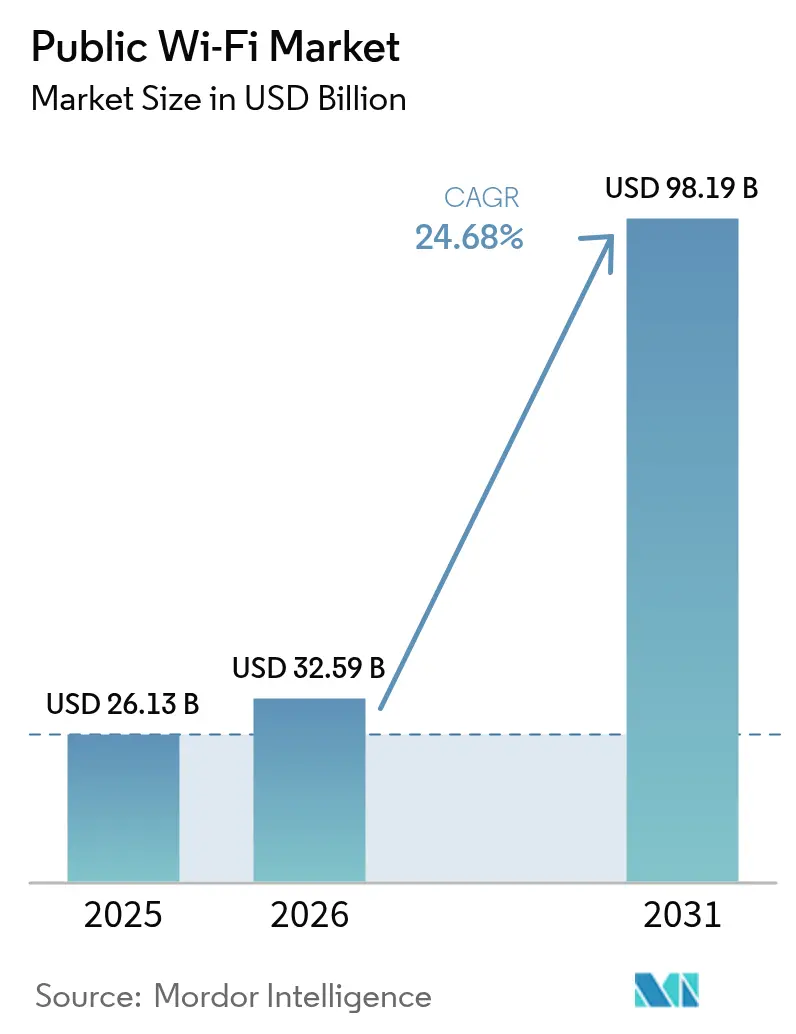
| Market Size (2026) | USD 32.59 Billion |
| Market Size (2031) | USD 98.19 Billion |
| Growth Rate (2026 - 2031) | 24.68 % |
| Fastest Growing Market | Asia Pacific |
| Largest Market | North America |
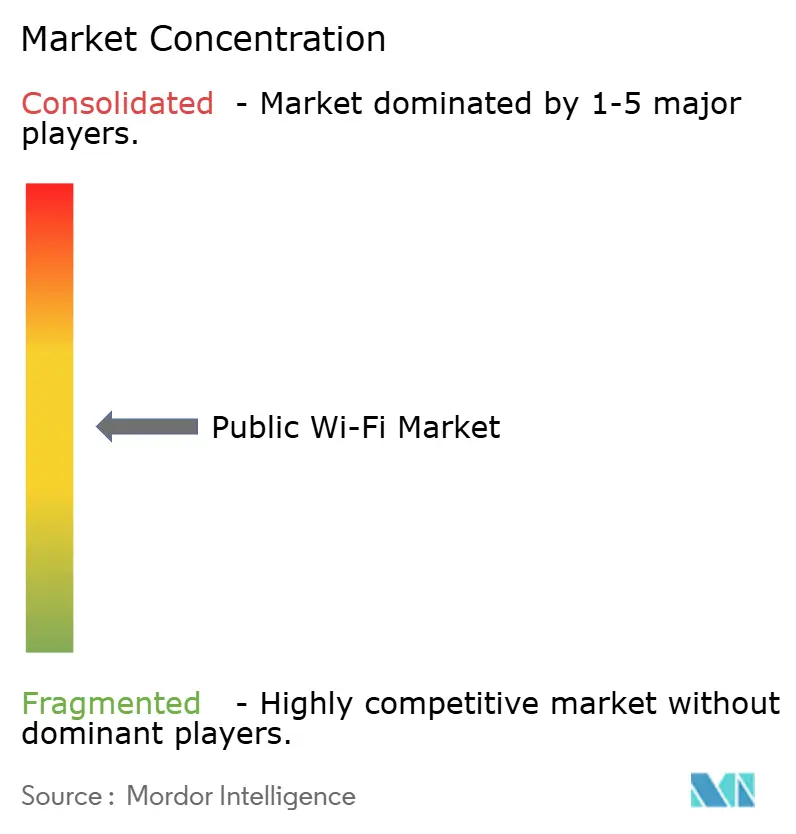
| Market Concentration | Medium |
Major Players *Disclaimer: Major Players sorted in no particular order Image © Mordor Intelligence. Reuse requires attribution under CC BY 4.0. | |
Public Wi-Fi Market Analysis by Mordor Intelligence
Public Wi-Fi Market size in 2026 is estimated at USD 32.59 billion, growing from 2025 value of USD 26.13 billion with 2031 projections showing USD 98.19 billion, growing at 24.68% CAGR over 2026-2031. Accelerated smart-city funding, rapid adoption of Wi-Fi 6E and Wi-Fi 7, and AI-native cloud management platforms are reshaping the total cost of ownership, while open roaming standards expand monetization avenues in high-density venues. Hardware refresh cycles, subscription-based Wi-Fi-as-a-Service (WaaS), and edge analytics are combining to keep the public Wi-Fi market in double-digit growth territory. Government‐backed broadband programs and private-sector enterprise upgrades are aligning in a virtuous demand loop that encourages vendors to integrate AI automation directly into access points, controllers, and analytics layers. Energy-efficiency directives and 6 GHz spectrum licensing hurdles remain headwinds; yet, the ongoing CAPEX-to-OPEX migration is insulating network planners from large upfront investments and sustaining confidence in long-term deployment roadmaps.
Key Report Takeaways
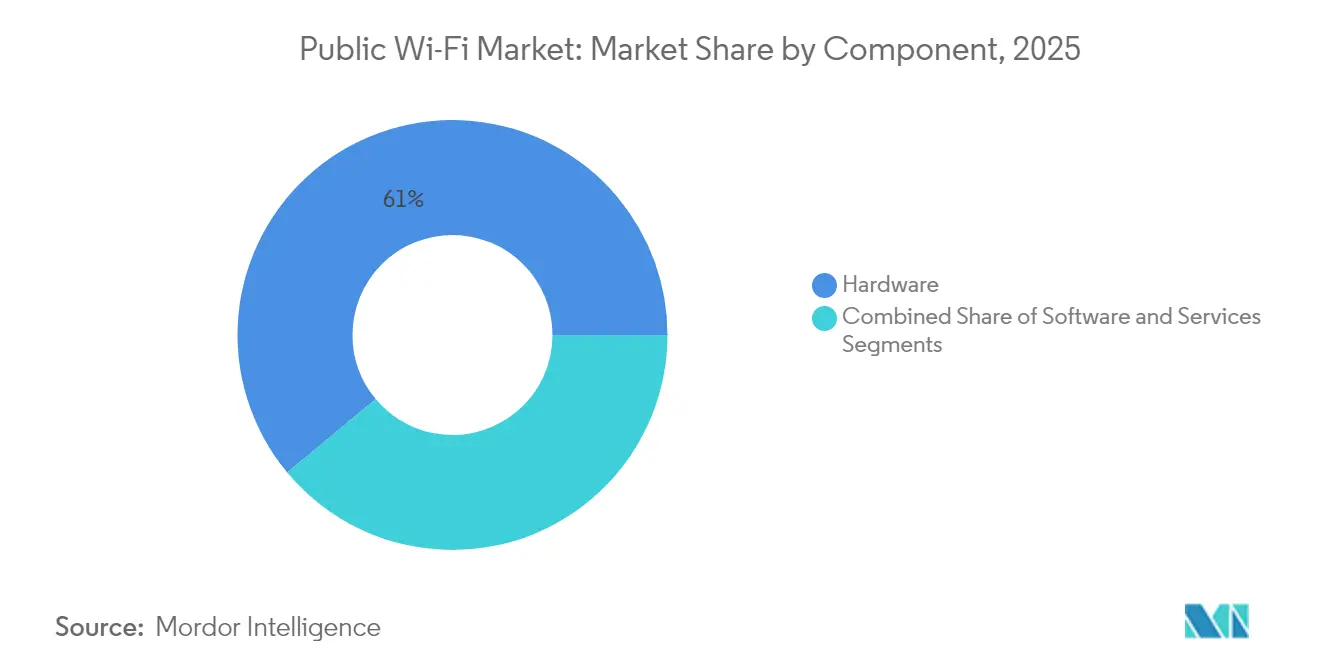
- By component, hardware led the 2025 revenue of the public Wi-Fi market, with 61.05%, while software is expected to advance at a 26.1% CAGR through 2031.
- By deployment model, cloud-managed platforms captured 60.10% share of the public Wi-Fi market in 2025; hybrid architectures are rising fastest at 26.3% CAGR.
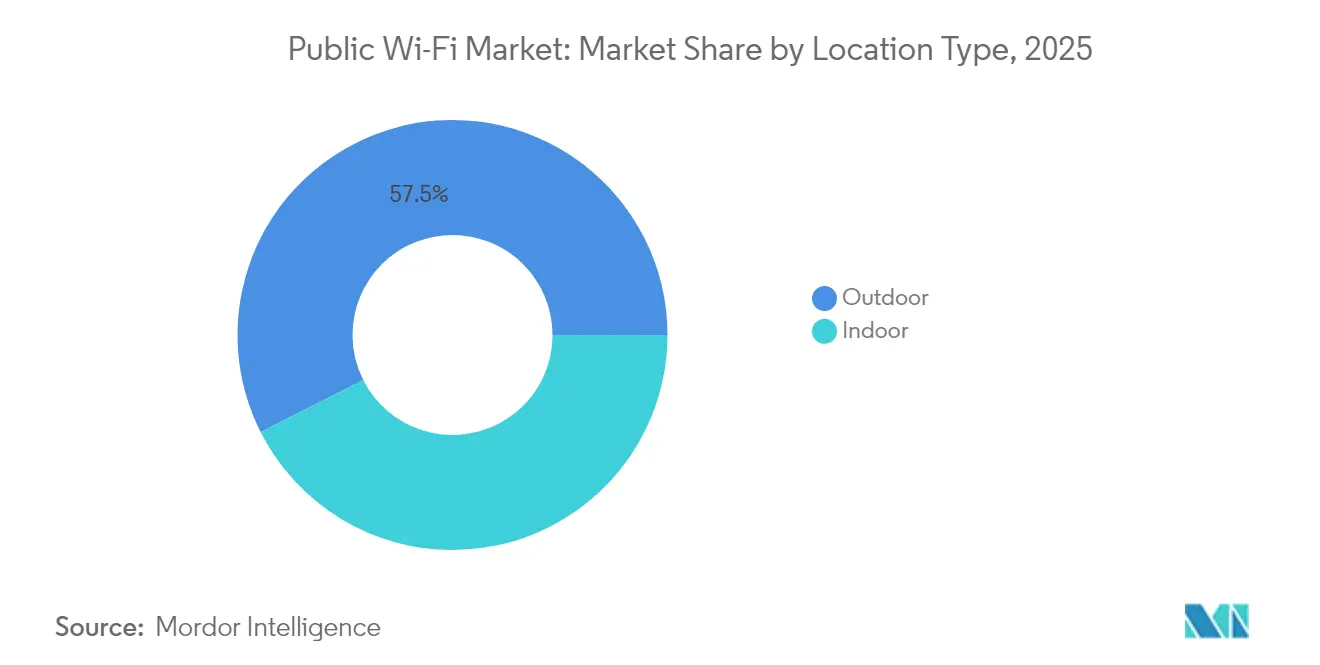
- By location type, outdoor installations accounted for 57.45% of the public Wi-Fi market's 2025 revenue and are expected to expand at a 25.6% CAGR, driven by smart-city projects.
- By end-user vertical, telecom and IT accounted for 28.30% of the 2025 public Wi-Fi market; transportation and logistics are expected to lead the field with a 27.2% CAGR to 2031.
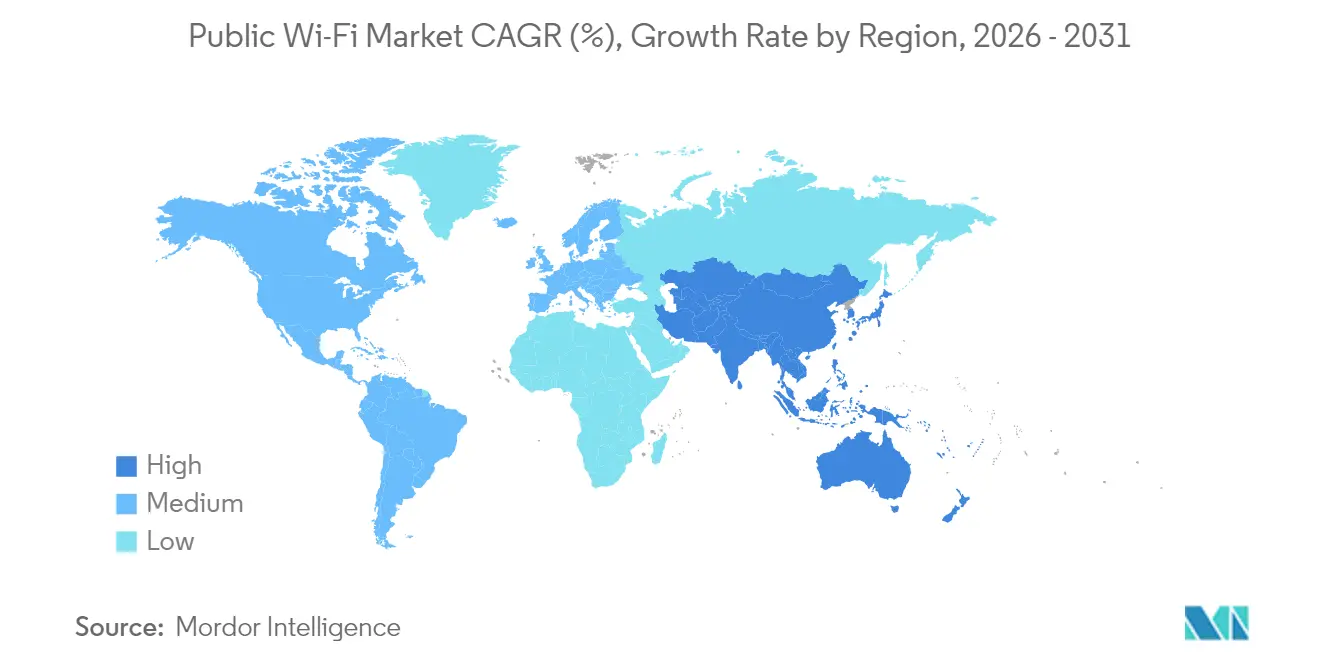
- By geography, North America led the 2025 public Wi-Fi market with 37.90% of the revenue, while the Asia Pacific is expected to grow at a 26.2% CAGR through 2031.
Note: Market size and forecast figures in this report are generated using Mordor Intelligence’s proprietary estimation framework, updated with the latest available data and insights as of 2026.
Market Trends and Insights
Drivers Impact Analysis of Public Wi-Fi Market*
| Driver | (~) % Impact on CAGR Forecast | Geographic Relevance | Impact Timeline |
|---|---|---|---|
| Smart city-funded public Wi-Fi rollouts | +4.2% | Global (early gains in North America, China, India) | Medium term (2-4 years) |
| Exploding connected-device traffic driving network offload | +6.8% | Global | Short term (≤ 2 years) |
| Wi-Fi 6E-7 upgrades and AI automation boosting network ROI | +5.1% | North America and the EU with spill-over to Asia Pacific | Medium term (2-4 years) |
| Subscription-based Wi-Fi-as-a-Service trimming CAPEX | +3.9% | Global (early adoption in North America and Europe) | Long term (≥ 4 years) |
| OpenRoaming adoption unlocking seamless monetization | +2.7% | Developed markets | Long term (≥ 4 years) |
| Edge analytics-ads revenue streams via user telemetry | +2.4% | Asia Pacific core with spill-over to MEA | Long term (≥ 4 years) |
| Source: Mordor Intelligence | |||
Smart City-Funded Public Wi-Fi Rollouts
National and municipal governments are underwriting large-scale Wi-Fi buildouts that guarantee multi-year demand for hardware and services. The USD 42.45 billion BEAD program is allocating awards of USD 1.355 billion to Louisiana and USD 416.6 million to Nevada, earmarking public Wi-Fi as the primary connectivity layer.[1]Sarah Bolton, “BEAD Program State Approvals 2024,” Broadband Now, broadbandnow.com Comparable commitments are emerging in the Philippines and Spain, ensuring a pipeline of enterprise-grade access points with energy-efficient designs that meet EU directives. RFP cycles of 3-5 years generate predictable revenues for vendors, while local content rules and power budget caps influence the development of SKU roadmaps. Collectively, these publicly funded projects enhance demand visibility and stabilize the public Wi-Fi market, counterbalancing the otherwise cyclical patterns of private-sector spending.
Exploding Connected-Device Traffic Driving Network Offload
Average enterprise sites now support 15-20 connected devices per employee, and public venues routinely top 1,000 simultaneous users per access point at peak.[2]Cisco Systems, “Catalyst 9176 Access Point,” cisco.com Offloading that traffic from congested cellular networks has become strategic rather than optional, positioning Wi-Fi 6E’s 6 GHz spectrum as an immediate capacity upgrade. Service-provider plans reveal 81% intend to enable OpenRoaming by 2025, recognizing that friction-free onboarding will be essential when offload revenues well. As Wi-Fi 7 chipsets mature, operators expect deterministic latency and wider channels to keep pace with real-time applications that otherwise hammer 5G macro networks.
Wi-Fi 6E-7 Upgrades and AI Automation Boosting Network ROI
Next-generation access points integrate AI engines that automate channel selection, power levels, and client steering, reducing manual intervention by up to 70%. Early adopters report 40-60% improvements in throughput-per-watt metrics, alleviating energy budget concerns while reducing help desk tickets. HPE Aruba’s Wi-Fi 7 730-series and Juniper’s AP47 family reinforce the trend by embedding machine learning and supplying actionable telemetry to cloud dashboards. The result is a virtuous cycle: elevated performance extends upgrade intervals and justifies premium ASPs, which in turn finance further AI research and development.
Subscription-Based Wi-Fi-as-a-Service Trimming CAPEX
WaaS shifts network spend from lumpy capital cycles to predictable OPEX streams that bundle hardware, software, and support. Cisco’s unified licensing and Aruba Central’s usage-based tiers are achieving 60-70% reductions in first-year cash outlay versus traditional models. SMBs value built-in lifecycle refresh and remote management included in monthly fees, while multi-site enterprises prefer rapid turn-up and common policy enforcement. The public Wi-Fi market is embracing the shift because hardware lifecycles align with contract terms, ensuring continuous innovation without requiring large, one-time budget approvals.
Restraints Impact Analysis of Public Wi-Fi Market*
| Restraint | (~) % Impact on CAGR Forecast | Geographic Relevance | Impact Timeline |
|---|---|---|---|
| Persistent cyber-security and privacy vulnerabilities | -3.2% | Global | Short term (≤ 2 years) |
| 5G unlimited-data plans cannibalizing hotspot usage | -2.8% | North America and EU extending to Asia Pacific | Medium term (2-4 years) |
| Licensing costs for outdoor 6 GHz spectrum | -1.9% | Global with regulatory variation | Long term (≥ 4 years) |
| Energy-efficiency mandates limiting AP power budgets | -1.4% | EU and North America expanding globally | Medium term (2-4 years) |
| Source: Mordor Intelligence | |||
Persistent Cyber-Security and Privacy Vulnerabilities
Rising WPA3 exploits and stricter privacy mandates add layers of complexity to compliance. GDPR, HIPAA, and PCI-DSS frameworks require explicit consent, audit trails, and encryption across all authentication flows, compelling network operators to adopt zero-trust postures and implement frequent patching cycles.[3]European Union, “General Data Protection Regulation,” gdpr.eu Healthcare and finance remain cautious, delaying rollout timelines or segmenting guest traffic to isolate regulated data. Security overlays inflate TCO and cut into approval cycles, tempering the otherwise strong adoption momentum in the public Wi-Fi market.
5G Unlimited-Data Plans Cannibalizing Hotspot Usage
North American carriers now bundle 100 GB or more of mobile hotspot allowance into premium unlimited tiers, enticing casual users to stay on cellular networks. Where indoor 5G coverage or mmWave deployments meet throughput needs, public Wi-Fi session revenues decline, prompting venue owners to reevaluate their monetization models. The shift is uneven: video streaming, bulk downloads, and IoT backhaul still favor Wi-Fi economics, while retail browsing and social feeds are shifting to cellular. Venue operators must craft differentiated engagement layers, such as loyalty apps or location-based promotions, to defend footfall analytics revenue.
*Our forecasts treat driver/restraint impacts as directional, not additive. The impact forecasts reflect baseline growth, mix effects, and variable interactions.
Public Wi-Fi Market Segment Analysis
By Component:
Hardware Foundation Supports Software InnovationHardware maintained a 61.05% share in 2025, driven by access-point refresh cycles that stabilize the public Wi-Fi market size for physical infrastructure. Access points alone accounted for the largest slice of revenue, and WLAN controller consolidation reflected the shift to cloud-based dashboards. Wi-Fi 7 rollouts, energy-efficiency mandates, and compliance renewals under Europe’s Radio Equipment Directive reinforce continuous demand for hardware and protect vendor margins. Indoor power constraints and outdoor weatherization continue to influence SKU variants, prompting vendors to incorporate adaptive power management into their ASIC designs.
Software is expanding at a 26.1% CAGR through 2031, fueled by AI-native cloud platforms that unify configuration, assurance, and monetization analytics. Consumption billing models scale with network growth, and the public Wi-Fi market share allocated to cloud management is therefore set to widen even as controllers decluster. Centralized dashboards simplify zero-touch provisioning for MSPs, enable advanced roaming analytics, and satisfy cross-vertical compliance logging requirements. Combined, hardware reliability and software intelligence form a mutually reinforcing value loop that sustains product differentiation for incumbents and dissuades price-only challengers.


By Deployment Model:
Cloud Management Drives Hybrid AdoptionCloud-managed architectures accounted for 60.10% of 2025 revenue, maintaining a significant market share in the public Wi-Fi market, where SaaS-delivered control planes dominate. Enterprises welcome centralized troubleshooting and AI-guided optimization that lifts uptime without site visits. Certification milestones, such as SOC 2 and ISO 27001, alleviate data-sovereignty concerns, enabling regulated industries to migrate guest SSID policies and non-PII analytics to public clouds while keeping sensitive workloads on-premises.
Hybrid adoption is growing at a 26.3% CAGR as organizations integrate local gateways under a global dashboard. This approach enables hospitals or banks to keep patient and transaction payloads local while benefiting from cloud-scale telemetry for guest portals and marketing analytics. On-premises dominance persists only in defense and ultra-low-latency automation, where air-gapped security or deterministic jitter takes precedence over cloud convenience. Together, these dynamics ensure deployment flexibility remains a core buying criterion across the public Wi-Fi market.
By Location Type:
Outdoor Deployments Lead Infrastructure ModernizationOutdoor venues represented 57.45% of 2025 revenue, and their 25.6% CAGR cements their lead in the public Wi-Fi market. Smart-city corridors, airports, and transport hubs require ruggedized hardware with extended temperature and ingress ratings, as well as support for 6 GHz spectrum. Municipal tenders specify solar-ready mounting kits that meet energy-efficiency targets without requiring trenching for power, thereby simultaneously broadening the addressable acreage for access-point vendors.
Indoor growth remains anchored in retail, hospitality, and enterprise campuses where advanced location services and application quality of service extract deeper operational value from the same RF fabric. Integration with point-of-sale, staff communications, and shopper analytics drives incremental ASP for indoor gear, allowing vendors to package turnkey vertical solutions. The dual-track growth of indoor and outdoor environments keeps R&D diverse, spawning innovations in antenna and ASIC technologies that cross-pollinate both environments and reinforce the public Wi-Fi market share of vendors with comprehensive indoor-outdoor lineups.
By End-User Vertical:
Transportation Growth Outpaces Traditional LeadersTelecom and IT operators accounted for 28.30% of 2025 revenue, bolstering the public Wi-Fi market size by offloading mobile traffic and integrating Wi-Fi into customer experience campaigns. Retail followed, leveraging Wi-Fi analytics for omnichannel personalization. Government rollouts expand digital inclusion and civic services, while education upgrades loosen BYOD constraints via segmented SSIDs and identity-based policies.
Transportation and logistics are projected to post the fastest vertical CAGR of 27.2% from 2021 to 2031. Modernized airports, rail hubs, and fleet depots require uninterrupted handoff and high throughput for e-gates, e-manifests, and passenger engagement apps. Access points with integrated IoT radios handle baggage tracking and predictive maintenance sensors, cutting downtime and costs. As airline, transit, and logistics operators link Wi-Fi analytics to operational KPIs, spending migrates from pilot projects to multi-site production networks, enlarging the public Wi-Fi market share devoted to this vertical.
Geography Analysis
North America Public Wi-Fi Market
North America accounted for 37.90% of 2025 revenue, driven by BEAD allocations, enterprise migrations to Wi-Fi 6E, and early Wi-Fi 7 trials in stadiums and universities. U.S. cities are piloting open roaming to harmonize private and municipal networks, while Canada aims to close public Wi-Fi gaps in rural and Indigenous areas. Mexico’s maquiladora manufacturing corridors are adopting WaaS to overcome CAPEX hurdles, thereby generating incremental revenue for the regional public Wi-Fi market.
APAC Public Wi-Fi Market
The Asia Pacific is expected to accelerate at a 26.2% CAGR through 2031. China bundles public Wi-Fi into nationwide smart-city blueprints, achieving economies of scale that push unit ASPs lower and spur adoption in tier-two cities. India’s Digital India Wi-Fi hotspots expand rural connectivity and stimulate e-commerce, reinforcing demand for cloud-managed dashboards that can operate on variable backhaul. Singapore, Malaysia, and Thailand modernize transport and tourism infrastructure, adopting Wi-Fi 7 to enable autonomous shuttles and augmented-reality visitor guides.
Europe Public Wi-Fi Market
Europe sustains demand through privacy-centric innovation. Germany and the United Kingdom lead in enterprise cloud migration, France and Italy expand city-center tourist Wi-Fi, and Spain rolls municipal networks into smart-city sensor grids. Compliance with GDPR and the Energy Efficiency Directive drives exporter vendors to integrate data minimization and low-power hardware designs. Collectively, these initiatives are expected to preserve steady growth for the public Wi-Fi market despite macroeconomic headwinds.

Regulatory Landscape
Public Wi-Fi deployments operate under spectrum policy, universal-service funding rules, and cybersecurity and privacy compliance obligations. In the United States, an FCC Order on Reconsideration published in January 2026 reversed the July 2024 interpretation that allowed E-Rate support for off-premises Wi-Fi hotspots and related services, tightening how public and community hotspot programs can be funded through E-Rate under section 254.
In emerging markets, governments are formalizing public Wi-Fi architectures and minimum technical controls to standardize deployments. India continues to develop its unbundled PM-WANI approach (PDO/PDOA/app/central registry), and in April 2026 TRAI issued a consultation on proliferating public Wi-Fi networks that examined ecosystem interventions, while Kenya enforced its Government Public Wi-fi Standard (ICTA.2.1.005:2025) from August 2025 across Ministries, Agencies, and Counties, referencing security practices aligned with WPA3 and ISO/IEC 27001:2022. Across these programs, compliance anchors such as GDPR, HIPAA, and PCI-DSS shape authentication, consent, logging, and encryption requirements in public-facing WLANs.
Value Chain Analysis
The public Wi-Fi value chain begins with semiconductor and RF components feeding networking OEMs that manufacture indoor and ruggedized outdoor access points, hotspot gateways, and switching and controller infrastructure. Standards and interoperability bodies, including the Wi-Fi Alliance (Wi-Fi 7 certification) and the Wireless Broadband Alliance (OpenRoaming), shape silicon feature sets, access point roadmaps, and authentication interoperability. Specifications for adjacent functions, including broadband network gateways (BNGs) and policy control (for example, Broadband Forum guidance), also affect how venue Wi-Fi connects to ISP core networks.
Downstream, systems integrators, managed service providers, venue owners (airports, stadiums, campuses, municipalities), and telecom operators deploy and operate networks, increasingly using cloud-managed platforms for orchestration, assurance, and analytics monetization. India’s PM-WANI framework illustrates role unbundling where Public Data Offices and Public Data Office Aggregators can participate alongside authentication and application providers, expanding the installer and reseller layer. Backhaul availability, standardized onboarding and identity across heterogeneous venues, and recurring compliance work (security hardening, privacy, and audit trails) remain key friction points across the chain, supporting ongoing software and services attachment tied to hardware refresh cycles.
Competitive Landscape
The competitive field remains moderately fragmented yet tilts toward vendors with broad hardware portfolios and AI-native cloud dashboards. Cisco extends its leadership with the Catalyst 9176/9178 access points, which embed machine learning engines and offer unified licensing, resulting in a 40% reduction in total cost of ownership. HPE Aruba leverages its acquisition of Athonet to converge private 5G and Wi-Fi under a single management fabric.[4]HPE, “HPE Completes Acquisition of Athonet,” hpe.com Juniper’s Mist AI and AP47 series apply AI-driven assurance to optimize user experience and reduce mean time to resolution.
Extreme Networks, TP-Link, Cambium, and Purple WiFi compete through niche strengths such as small-business cloud management, power-efficient outdoor gear, or privacy-preserving analytics. Regional players in China and India tailor solutions to local compliance and price points, challenging global incumbents in cost-sensitive tenders. Differentiation is increasingly based on end-to-end visibility, automated root-cause analysis, and open roaming support attributes that resonate across the public Wi-Fi market, regardless of geography or vertical.
Public Wi-Fi Industry Leaders
Cisco Systems Inc.
Hewlett Packard Enterprise Company
Huawei Technologies Co., Ltd.
CommScope Holding Company Inc.
Extreme Networks Inc.
- *Disclaimer: Major Players sorted in no particular order
Public Wi-Fi Market Companies Covered in this Report
- Cisco Systems Inc.
- Hewlett Packard Enterprise Company
- Huawei Technologies Co., Ltd.
- CommScope Holding Company Inc.
- Extreme Networks Inc.
- Juniper Networks Inc.
- Ubiquiti Inc.
- TP-Link Technologies Co., Ltd.
- D-Link Corporation
- Cambium Networks Corporation
- EnGenius Technologies Inc.
- Fon Wireless Limited
- GoZone WiFi LLC
- Purple WiFi Ltd.
- Cloud4Wi Inc.
- Boingo Wireless Inc.
- Aptilo Networks AB
- Tanaza S.p.A.
- Aerohive Networks Inc.
- Hughes Systique Corporation

Market Opportunities and Future Outlook
A visible whitespace is the quality-led upgrade cycle in municipal and transit Wi-Fi, where budgets shift from basic hotspot expansion to higher-capacity, lower-touch operations using Wi-Fi 7 and AI-assisted assurance. Seoul Metropolitan Government launched a KRW 2.4 billion program in April 2026 to replace 2,020 legacy public Wi-Fi units with Wi-Fi 7 infrastructure, and Seongnam City reported expansion to 3,721 public Wi-Fi units across 2,294 locations in April 2026 to reduce coverage blind spots. Together, these actions point to procurement demand for ruggedized outdoor access points, 6 GHz-capable radios, and cloud management.
Large, public-service-led builds also create whitespace for vendors that bundle Wi-Fi with managed operations, identity, and security controls at scale. Mexico's CFE announced a USD 600 million public Wi-Fi project covering all 32 states, prioritizing tele-schools and medical facilities, reinforcing demand for standardized onboarding, resilient backhaul integration, and centralized policy management. On the platform side, OpenRoaming commercialization demonstrated at WGC Americas 2026 in Dallas and WBA's February 2026 AI/ML guidance for intelligent Wi-Fi highlight an opportunity for platform providers to package seamless roaming, automated troubleshooting, and policy-driven analytics as paid software layers over access point deployments, especially in high-density venues where user experience and cybersecurity posture affect adoption and monetization.
Recent Industry Developments in Public Wi-Fi Market
- July 2026: Cisco highlighted Wi-Fi innovations for high-density venues, including the Catalyst 9179F fourth-generation Wi-Fi antenna and stadium network modernization at Levi's Stadium. The update reinforces the market shift toward Wi-Fi 7-class capabilities, venue-grade RF engineering, and experience-centric operations in large public and semi-public locations.
- June 2026: Huawei announced a Wi-Fi 7 patent licensing royalty rate of USD 0.5 per unit for Wi-Fi 7-compliant consumer-grade devices. A published licensing framework clarifies IP cost inputs for device OEMs and helps downstream access point and client ecosystems plan Wi-Fi 7 rollouts with more predictable bill-of-materials assumptions.
- October 2025: Cisco announced general availability of the Catalyst 9176 and 9178 Wi-Fi 7 access points with AI-native optimization and unified licensing. The launch accelerated enterprise and venue refresh cycles by packaging performance, security, and subscription licensing into a single upgrade path that supports Wi-Fi-as-a-Service adoption.


Public Wi-Fi Market Report Scope and Research Methodology
Market Definition and Coverage
For this methodology, the public Wi-Fi market is counted as the value of equipment, software, and services used to deliver Wi-Fi access to end users in public and semi-public venues, including authentication, access management, and ongoing operations.
Scope exclusions: Private home Wi-Fi and purely private enterprise WLANs that are not intended for guest or public access are not counted.
Segments Covered in This Report
- By Component
- Hardware
- Access Points
- WLAN Controllers
- Wireless Hotspot Gateways
- Software
- Services
- Hardware
- By Deployment Model
- Cloud Managed
- On-Premises
- Hybrid
- By Location Type
- Indoor
- Outdoor
- By End-User Vertical
- Telecom and IT
- Retail and E-Commerce
- Travel and Hospitality
- Transportation and Logistics
- Government and Public Sector
- Education
- Healthcare
- Other End-User Verticals
- By Geography
- North America
- United States
- Canada
- Mexico
- South America
- Brazil
- Argentina
- Rest of South America
- Europe
- Germany
- United Kingdom
- France
- Italy
- Spain
- Rest of Europe
- Asia Pacific
- China
- Japan
- India
- South Korea
- South-East Asia
- Rest of Asia Pacific
- Middle East
- Saudi Arabia
- United Arab Emirates
- Turkey
- Rest of Middle East
- Africa
- South Africa
- Nigeria
- Rest of Africa
- North America
Data Sources, Market Sizing, and Validation
Desk Research
Desk research helped set the market boundaries and build a consistent set of input assumptions before any forecasting. We relied mostly on public, non-paywalled sources such as ITU connectivity statistics, OECD broadband and telecom indicators, FCC releases for spectrum and broadband programs, and Wi-Fi Alliance materials for standard adoption signals (for example, Wi-Fi 6E and Wi-Fi 7 readiness).
We also reviewed operator and venue owner disclosures through annual reports, investor decks, and earnings transcripts to understand rollout priorities, monetization models, and refresh cycles for access points and controllers. To tighten the math around pricing and volumes, we used paid subscriptions for company financials and intelligence, import-export shipment level data, and patent databases where relevant, then cross-checked them against reputable press reporting on large public hotspot projects. These desk sources are not exhaustive, and we used additional public references to validate numbers and clarify open questions.
Primary Interviews and Surveys
Primary work focused on confirming how public Wi-Fi budgets are allocated across hardware, software licenses, and managed services, and how those allocations change by venue density and security needs. We spoke with hotspot operators, system integrators, venue IT teams, and connectivity solution providers across major regions so gaps in secondary data could be filled and key assumptions could be pressure tested before finalizing the model.
Distribution of primary research fieldwork respondents
| Company type | Respondent position | Region |
|---|---|---|
| Top tier: 29% | CXOs: 13% | APAC: 42% |
| Mid tier: 57% | Functional/Unit leaders: 36% | EMEA: 36% |
| Smaller Players: 14% | Managers: 51% | Americas: 22% |
Market-Sizing & Forecasting
Sizing started with a top-down build that reconstructs spending from public hotspot footprint growth and venue deployment intensity, then applies category splits to convert that demand pool into market value. To keep the totals grounded, we also created selective bottom-up approximations using sampled pricing by access point class, expected lifecycle replacement timing, and channel checks on managed service attach rates, with adjustments when the two views diverged.
A few key inputs used in the model include installed base and new hotspot additions, average equipment refresh cycles, the mix shift toward cloud-managed deployments, indoor versus outdoor venue density, and typical service subscription duration tied to support and security needs. Where direct counts were missing, gaps were handled through conservative penetration ranges by venue type, followed by validation from interviews.
For forecasting, we used scenario analysis supported by short trend fits on the main drivers, and the final outlook was aligned to expert consensus on adoption timing for newer Wi-Fi standards, public space digitization programs, and expected pricing progression for hardware and managed services.
Data Validation & Update Cycle
Model outputs were checked against independent signals such as connectivity program announcements, reported hotspot rollouts by operators and municipalities, and implied spending per site derived from public bids and contract disclosures. Outliers were flagged, assumptions were revisited, and results were reviewed in multiple analyst steps before sign-off, with re-contact triggered when a key assumption changed materially.
Reports are refreshed annually, and interim updates are made when major events materially shift pricing, deployment pace, or regulation. Before delivery, an analyst performs a fresh pass on the latest public information so clients receive an updated view instead of an older snapshot.
Mordor Intelligence's Public Wi Fi Market Size Versus Other Published Estimates
Published market sizes for public Wi-Fi can differ quite a bit, and it usually comes down to what is counted, how prices are averaged, and how fast underlying assumptions are refreshed. In this market, small boundary choices around what qualifies as public access, plus different views on managed services versus equipment revenue, can move the total by billions.
Venue rollout counts, hotspot footprint disclosures, and contract signals from public tenders are the checks that keep Mordor Intelligence's estimate tied to real deployment activity, rather than relying only on broad wireless spending proxies. The biggest spread typically shows up when a study blends private enterprise WLAN upgrades into the totals or assumes a faster shift to premium standards without validating the timing through operators and venue owners.
Benchmark comparison
| Source | Market Size | Gaps in Research Methodology |
|---|---|---|
| Mordor Intelligence | USD 32.59 B (2026) | |
| Trade Journal A | USD 5.49 B (2025) | Uses a narrower definition that leans toward paid hotspot service revenue, and it appears to exclude most hardware and implementation spending at venues, which compresses the total market value. |
| Industry Research Portal B | USD 6.08 B (2025) | Looks closer to a Wi-Fi hotspot subset and is likely anchored on a limited set of hotspot providers, with less clarity on how cloud management software and managed operations are valued across venue types. |
The comparison shows that the main difference is scope, because some sources track a hotspot service subset, while this study totals the broader stack that venues buy and run to provide public access. By keeping the inclusion rules consistent and cross-checking rollout, pricing, and attach rate assumptions, the resulting size stays traceable to repeatable inputs that can be updated as deployments change.


Key Questions Answered in the Report
How large is the public Wi-Fi market in 2026?
Shipments reached 1.32 billion units in 2026, and the figure is forecast to rise to 3.98 billion units by 2031.
What CAGR is forecast for the public Wi-Fi market to 2031?
The market is projected to grow at 24.68% CAGR through 2031.
Which component segment leads current shipments?
Hardware accounts for 61.05% of 2025 shipments, led by access-point refresh cycles.
Which deployment model is expanding fastest?
Hybrid cloud-managed architectures are advancing at 26.3% CAGR as enterprises balance security with flexibility.
Which vertical shows the highest growth momentum?
Transportation and logistics is pacing the field at 27.2% CAGR, driven by airport and fleet connectivity projects.
What regional market is growing fastest?
Asia Pacific is posting a 26.2% CAGR through 2031, propelled by smart-city initiatives in China, India, and Southeast Asia.
Page last updated on:


 Your data is secure and never sold or shared.


