
Protein Purification And Isolation Market Size and Share
Market Overview
| Study Period | 2020 - 2031 |
|---|---|
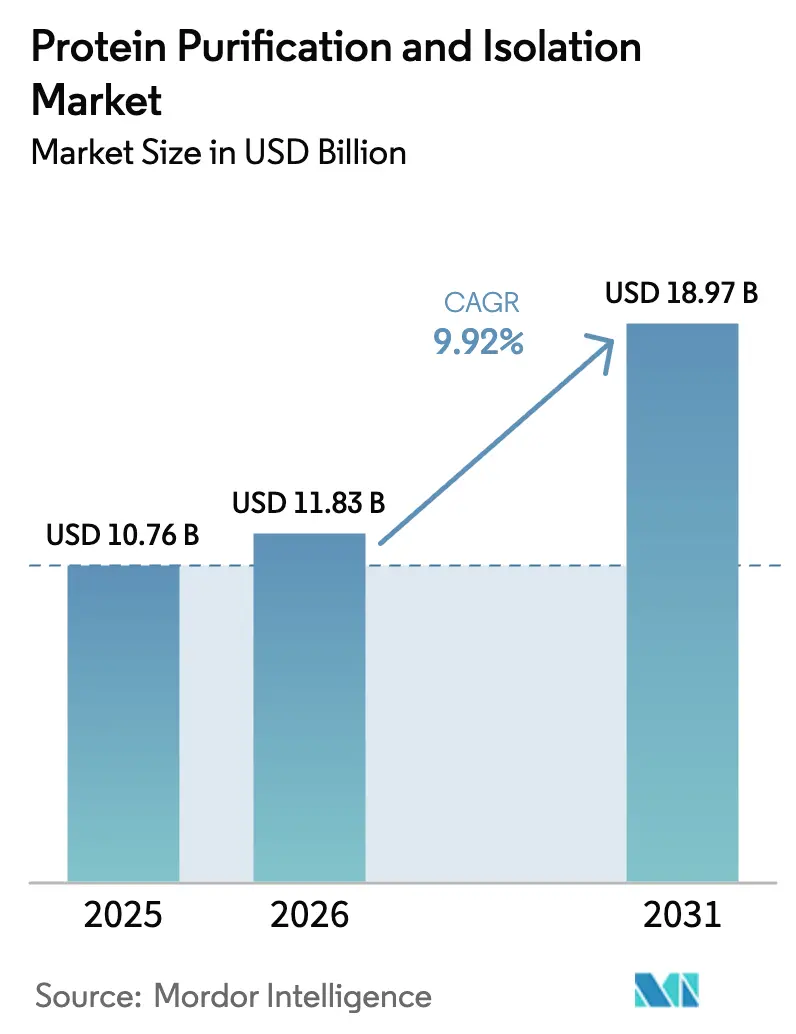
| Market Size (2026) | USD 11.83 Billion |
| Market Size (2031) | USD 18.97 Billion |
| Growth Rate (2026 - 2031) | 9.92 % |
| Fastest Growing Market | Asia-Pacific |
| Largest Market | North America |
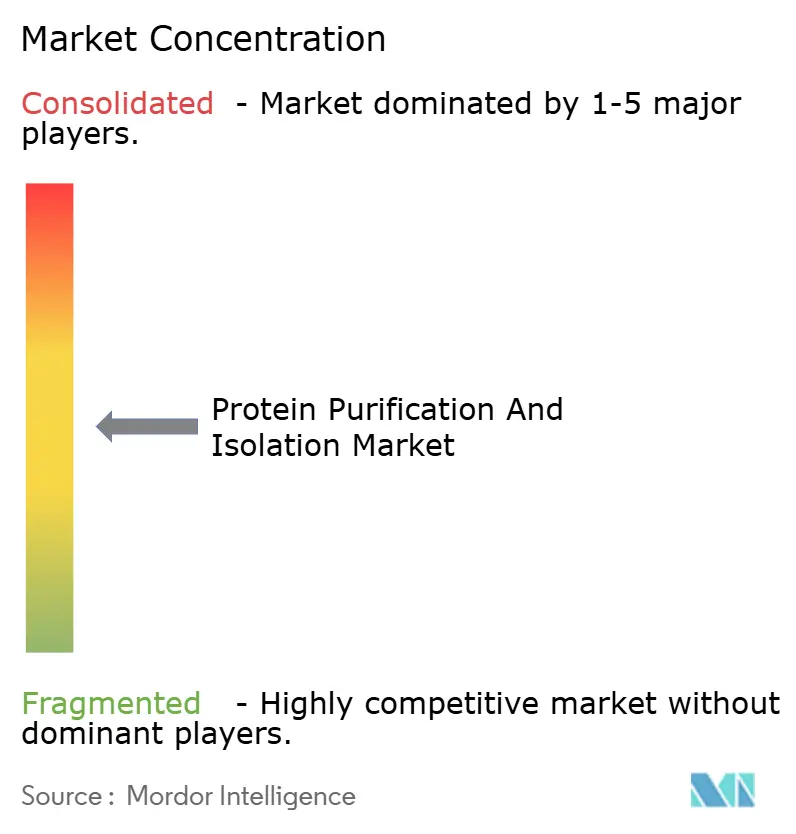
| Market Concentration | Medium |
Major Players *Disclaimer: Major Players sorted in no particular order Image © Mordor Intelligence. Reuse requires attribution under CC BY 4.0. | |
Protein Purification And Isolation Market Analysis by Mordor Intelligence
Protein Purification And Isolation market size in 2026 is estimated at USD 11.83 billion, growing from 2025 value of USD 10.76 billion with 2031 projections showing USD 18.97 billion, growing at 9.92% CAGR over 2026-2031. Continuous biologics pipeline expansion, accelerating cell- and gene-therapy commercialization, and rapid integration of artificial intelligence into downstream processing jointly underpin this trajectory. Intensifying competition among contract development and manufacturing organizations (CDMOs), rising deployment of single-use consumables that curb cross-contamination, and government-backed structural proteomics initiatives further enrich demand. Vendors that align equipment portfolios with continuous processing and data-driven automation gain an edge as quality-by-design approaches become the regulatory norm. At the same time, cost‐efficient manufacturing hubs in Asia-Pacific are changing global capacity allocation, prompting multinational suppliers to localize production footprints and after-sales service.
Key Report Takeaways
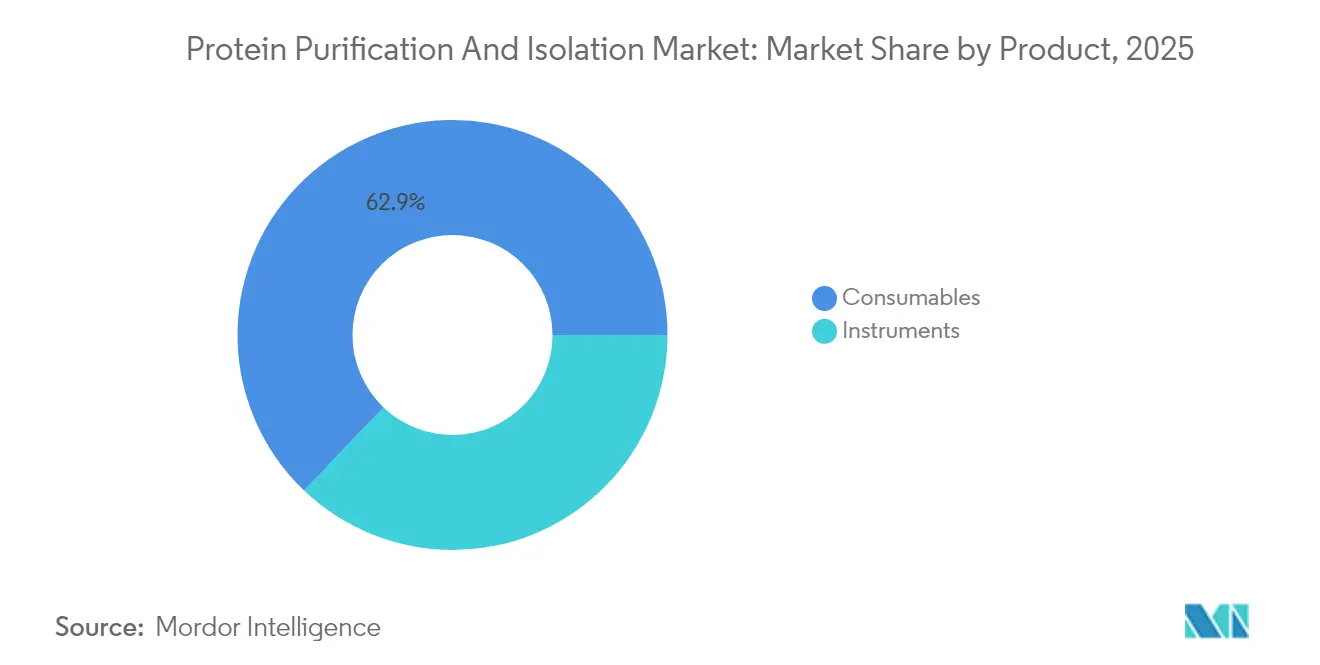
- By product, consumables led with 62.88% revenue share in 2025, while instruments recorded the highest projected CAGR at 11.37% through 2031.
- By technology, chromatography held 32.10% of the protein purification and isolation market share in 2025; ultrafiltration and diafiltration are projected to expand at an 10.90% CAGR to 2031.
- By end-user, academic and research institutes accounted for 42.55% of the protein purification and isolation market size in 2025, whereas CROs/CMOs show the fastest outlook at a 10.75% CAGR.
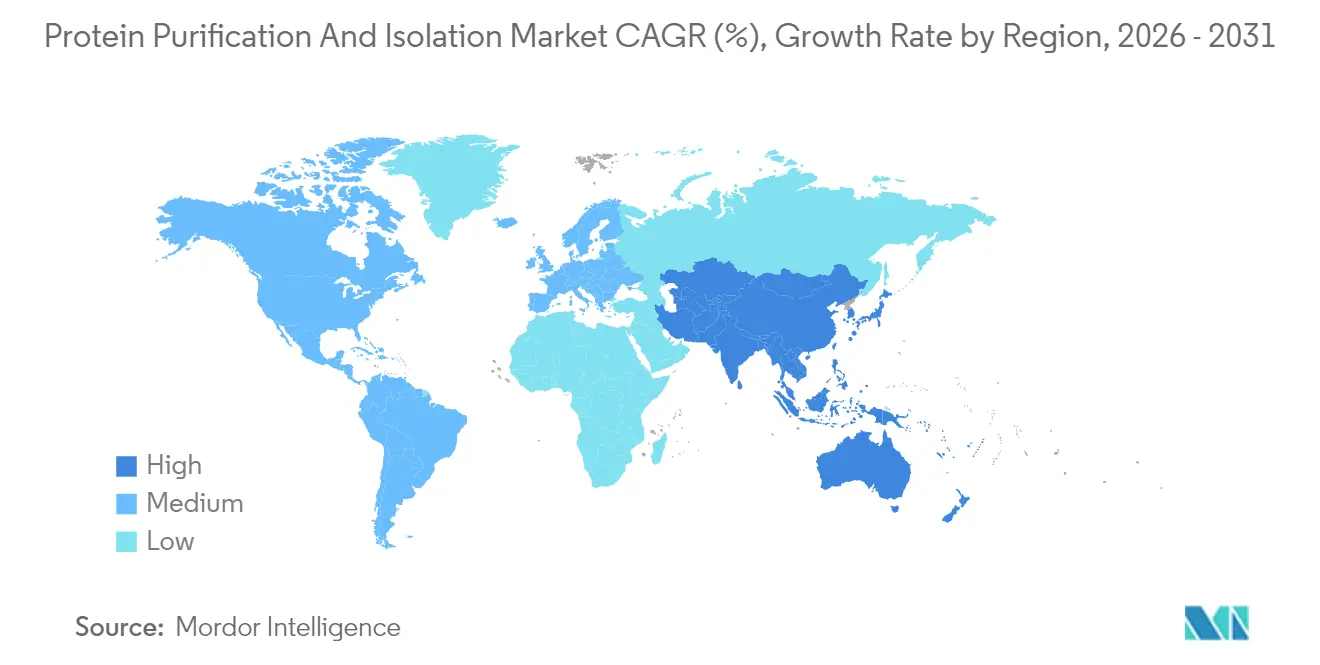
- By geography, North America commanded 41.95% of 2025 revenue, but Asia-Pacific is forecast to accelerate at an 11.66% CAGR through 2031.
Note: Market size and forecast figures in this report are generated using Mordor Intelligence’s proprietary estimation framework, updated with the latest available data and insights as of 2026.
Market Trends and Insights
Drivers Impact Analysis of Protein Purification And Isolation Market*
| Driver | (~) % Impact on CAGR Forecast | Geographic Relevance | Impact Timeline |
|---|---|---|---|
| Expansion of Monoclonal Antibody and Recombinant Biologics Pipeline | +2.1% | Global, with concentration in North America & EU | Medium term (2-4 years) |
| Surge in Cell- & Gene-Therapy Manufacturing Capacity Investments | +1.8% | North America & EU core, expanding to APAC | Long term (≥ 4 years) |
| Growing Demand for High-Throughput, Single-Use Purification Systems | +1.5% | Global | Short term (≤ 2 years) |
| Government Funding for Structural Proteomics Consortia | +1.2% | North America & EU primarily | Medium term (2-4 years) |
| Adoption of Continuous/Chromatographic Intensification Platforms | +0.9% | Developed markets initially, spillover to emerging | Long term (≥ 4 years) |
| AI-Guided Resin and Buffer Selection Software Integration | +0.7% | Global, with early adoption in developed markets | Medium term (2-4 years) |
| Source: Mordor Intelligence | |||
Expansion of Monoclonal Antibody and Recombinant Biologics Pipeline
Monoclonal antibody volumes continue to rise at roughly 8% annually, driving demand for Protein A affinity chromatography skids that dominate IgG capture workflows.[1]Source: BioProcess International, “The Secret Life of Protein A,” bioprocessintl.com Fujifilm’s USD 1.2 billion facility in North Carolina adds 160,000 L of bioreactor capacity devoted to antibody production, a scale-up that necessitates proportional downstream investments. The pipeline now spans antibody–drug conjugates and bispecific formats, each introducing unique selectivity challenges that boost demand for high-capacity resins. Standardization of modular skids across sites helps global manufacturers accelerate validation and cut procurement cost. Consequently, suppliers with deep process-development expertise and global support teams capture larger slices of the protein purification and isolation market.
Surge in Cell- & Gene-Therapy Manufacturing Capacity Investments
Biopharma’s pivot toward genetic medicines is reshaping purification needs because viral vectors and plasmid DNA have larger molecular footprints and stricter contamination limits than conventional proteins. Asahi Kasei’s Bionova Scientific opened a Texas site to supply plasmid DNA solutions tailored for these modalities. Manufacturers often lock in three- to five-year capex plans that include chromatography columns designed for large-pore resins and membrane-based harvest technologies. Regulators impose heightened scrutiny on adventitious-agent control, accelerating uptake of sterile, single-use flow paths. As a result, the protein purification and isolation market gains durable revenue streams from both first-of-kind therapies and follow-on capacity expansions.
Growing Demand for High-Throughput, Single-Use Purification Systems
Thermo Fisher’s DynaDrive 5 L single-use bioreactor, launched in April 2025, delivers 27% productivity gains and scales seamlessly to 5,000 L, underscoring how disposables now serve both process-development labs and commercial suites. CDMOs that routinely juggle multi-client portfolios prefer these systems, boosting repeat purchase volumes for bags, filters, and ready-to-use columns. Disposable designs also facilitate regulatory compliance because dedicated flow paths slash the risk of product carryover.
Government Funding for Structural Proteomics Consortia
The National Science Foundation allocated USD 40 million in 2024 toward protein-design research, catalyzing academic demand for high-resolution chromatography and electrophoresis hardware. Grant recipients often purchase standardized purification kits that simplify collaboration across multicenter consortia. Domestic procurement clauses embedded in many public awards boost local suppliers and reduce lead-time uncertainty. Such public–private initiatives feed a steady pipeline of early-stage projects that ultimately transition into commercial therapeutics, thereby reinforcing long-term demand for sophisticated separation platforms.
Restraints Impact Analysis of Protein Purification And Isolation Market*
| Restraint | (~) % Impact on CAGR Forecast | Geographic Relevance | Impact Timeline |
|---|---|---|---|
| Capital-Intensive Downstream Hardware and Facility Retro-Fits | -1.3% | Global, more pronounced in emerging markets | Short term (≤ 2 years) |
| Scarcity of Advanced Purification Talent in Emerging Clusters | -0.8% | APAC emerging markets, Latin America | Medium term (2-4 years) |
| Batch-To-Batch Variability of Affinity Resins Limiting Re-Use | -0.6% | Global | Medium term (2-4 years) |
| Environmental Burden of Single-Use Plastics in Bioprocessing | -0.4% | EU & North America primarily | Long term (≥ 4 years) |
| Source: Mordor Intelligence | |||
Capital-Intensive Downstream Hardware and Facility Retro-Fits
Modern chromatography skids often cost USD 0.5–2 million each, and converting a stainless-steel suite into a single-use environment adds incremental infrastructure bills. Small biotechnology firms and manufacturers in cost-sensitive regions frequently delay upgrades, risking capacity bottlenecks. Currency volatility elevates landed cost of imported equipment, while limited access to long-term financing prolongs payback horizons. Consequently, some companies outsource production to well-capitalized CDMOs, shifting equipment demand from buyers to service providers inside the protein purification and isolation market.
Scarcity of Advanced Purification Talent in Emerging Clusters
Rapid greenfield construction in Asia-Pacific and Latin America outpaces workforce development. Continuous chromatography and AI-enabled platforms require interdisciplinary skills that combine classical biochemistry with programming literacy. Experienced practitioners command premiums and gravitate toward mature hubs, leaving greenfield sites dependent on expatriate staff or lengthy training. Talent scarcity slows technology adoption and raises operating costs, indirectly tempering near-term segment growth in the protein purification and isolation market.
*Our forecasts treat driver/restraint impacts as directional, not additive. The impact forecasts reflect baseline growth, mix effects, and variable interactions.
Protein Purification And Isolation Market Segment Analysis
By Product:
Consumables Dominance Driven by Single-Use AdoptionConsumables captured 62.88% of the protein purification and isolation market in 2025 as disposable filters, membranes, ready-to-use columns, and buffer kits became standard for cGMP suites. Kits and reagents sit at the heart of this lead because standardized formulations simplify validation across multi-site networks. Demand is reinforced by global harmonization of microbial-residue limits that favor sterile, pre-gamma-irradiated flow paths. The recurring nature of consumable purchases translates into stable revenue that underwrites supplier R&D.
The instruments segment, though smaller, is set to log an 11.37% CAGR as manufacturers modernize with AI-enabled chromatography systems and inline formulation skids. Capital investment cycles mirror facility build-outs such as Samsung Biologics’ multi-plant expansion in South Korea, which lifts baseline equipment shipments. Vendors linking hardware with digital twins and predictive-maintenance dashboards stand to enlarge their slice of the protein purification and isolation market size for instrumentation.


By Technology:
Chromatography Leadership Challenged by Membrane InnovationChromatography maintained 32.10% market control in 2025, underpinned by Protein A columns that remain the benchmark for antibody capture. Ion-exchange and mixed-mode formats expand applicability across fusion proteins, enzymes, and plasma-derived products. However, ultrafiltration and diafiltration are speeding ahead at an 10.90% CAGR through novel polymer chemistries that cut buffer consumption and cycle time. Early adopters report cost reductions per gram of protein that swing financial models in favor of membrane-centric trains.
Hybrid platforms that pair flow-through chromatography with high-flux ultrafiltration create flexible trains optimized for titer variability, a growing concern as upstream titers climb. Electrophoresis retains a niche for analytical confirmation, while emerging high-resolution precipitation kits support rapid screening. This diversification helps technology providers broaden revenue opportunities across the protein purification and isolation market.
By End-User:
Academic Dominance Yields to Commercial ManufacturingAcademic and research institutes accounted for 42.55% of 2025 revenue, leveraging grant funds such as the NSF award to upgrade core facilities. Universities serve as training grounds, generating operator pipelines that feed pharmaceutical employers. They also pilot early-stage modalities like nanoparticle vaccines, which demand agile purification setups.
CROs and CMOs are poised for the fastest climb at a 10.75% CAGR, mirroring pharma’s trend of outsourcing late-stage development and commercial supply. These organizations aggregate multi-client demand, making them bulk purchasers of columns, sensors, and resins. Their stringent contract turnarounds intensify demand for single-use suites and high-throughput automation, reinforcing the commercial pull within the protein purification and isolation market.

Geography Analysis
North America Protein Purification and Isolation Market
North America held 41.95% of global revenue in 2025, supported by seasoned regulators, deep capital markets, and marquee CDMOs. NSF’s USD 40 million protein-design program amplifies academic orders for high-specification chromatographs, reinforcing regional dominance. Novo Nordisk’s USD 4.1 billion expansion in North Carolina confirms the region’s ability to attract mega-projects despite cost-of-labor premiums. Manufacturers operating under FDA oversight often set global purification benchmarks, giving North American suppliers export leverage.
APAC Protein Purification and Isolation Market
Asia-Pacific is projected to clock an 11.66% CAGR, making it the quickest climber within the protein purification and isolation market. Samsung Biologics’ 360,000 L of capacity across three plants, with a fourth underway, showcases regional scaling power. MilliporeSigma and Cytiva have mirrored customer moves by establishing local resin-packing and equipment-service footprints to curb supply-chain risk. Policy frameworks in China and India further catalyze domestic build-outs, although geopolitical tensions such as the prospective US BioSecure Act could reshape future supply routes.
EMEA and South America Protein Purification and Isolation Market
Europe maintains mature clusters in Germany, Switzerland, and the United Kingdom, underpinned by harmonized regulatory statutes that simplify cross-border equipment validation. Environmental stewardship regulations motivate adoption of continuous processing and low-buffer technologies, opening opportunities for green-chemistry-oriented suppliers. Elsewhere, the Middle East, Africa, and South America register rising interest, particularly where governments fund vaccine sovereignty projects, but inadequate cold-chain and water infrastructure still impede wide-scale uptake.

Regulatory Landscape
Protein purification and isolation workflows for therapeutics are managed under cGMP expectations set by major regulators such as the US FDA and the European Medicines Agency, where purification-process validation and demonstrated control of impurities remain central to release and comparability packages. WHO GMP guidance for biological products, along with WHO guidance on monoclonal antibody production and quality control, reinforces risk-based controls and lifecycle management across downstream processing, shaping how resins, membranes, and single-use assemblies are qualified and documented.
Quality-by-design is supported through harmonized frameworks, including ICH Q8 (pharmaceutical development), Q9 (quality risk management), Q10 (pharmaceutical quality system), and Q11 (drug substance development and manufacture). Standards such as ISO 20399:2022 for ancillary materials used in cell and gene therapy further structure qualification of critical materials for advanced therapy manufacturing, intersecting with wider use of single-use flow paths and tighter expectations around supplier quality and traceability.
Competitive Landscape
The protein purification and isolation market is moderately fragmented, with global conglomerates and specialist firms competing on integrated platforms rather than isolated hardware. Thermo Fisher Scientific, and Merck KGaA leverage end-to-end portfolios that span columns, resins, single-use assemblies, and digital analytics. Platform breadth plus global service centers enables quick client onboarding and aftermarket revenue.
Mergers and acquisitions concentrate capabilities. Ecolab’s USD 3.7 billion purchase of Purolite gave it a high-margin resin franchise.[3]Source: BioProcess International, “For Resins, Supply Chain Resilience Is Key,” bioprocessintl.com Thermo Fisher’s USD 4.1 billion filtration acquisition pushed it deeper into buffer management. These moves signal a race toward solution bundles that reduce customers’ supplier counts and simplify regulatory audits.
Niche innovators exploit white spaces in cell- and gene-therapy purification, offering high-throughput viral-vector kits or AI-enabled process software. Although small in revenue, they often command premium pricing thanks to specialized know-how. Larger vendors eye partnerships or bolt-on buys to fill capability gaps, a dynamic that is likely to persist as the protein purification and isolation market adopts increasingly complex therapeutic formats.
Protein Purification And Isolation Industry Leaders
Thermo Fischer Scientific Inc.
Merck KGaA
QIAGEN
Bio-Rad Laboratories, Inc.
Promega Corporation
- *Disclaimer: Major Players sorted in no particular order
Protein Purification And Isolation Market Companies Covered in this Report
- Thermo Fisher Scientific
- Merck KGaA (MilliporeSigma)
- Danaher Corporation (Cytiva & Pall)
- Sartorius
- Agilent Technologies
- Bio-Rad Laboratories
- QIAGEN
- Promega
- Norgen Biotek
- Abcam
- Purolite (Ecolab)
- Repligen
- 3M Purification Inc.
- Waters Corporation
- Shimadzu
- Revvity Inc. (formerly PerkinElmer)
- Tosoh
- GenScript Biotech
- Takara Bio
- Chromatrap (Porvair Sciences)
Read Analysis of Protein Purification And Isolation Companies

Market Opportunities and Future Outlook
The main opportunity is a practical gap between large biomanufacturing build-outs and downstream capacity readiness, where customers seek faster, more standardized purification deployment along with stronger supply assurance. In April 2025, Thermo Fisher Scientific committed USD 2 billion over four years to expand US manufacturing and R&D capacity, which aligns with demand for domestically supported consumables, resins, and integrated downstream solutions as production footprints continue to localize.
Portfolio consolidation and capability stacking among major suppliers also support demand for platforms that reduce validation burden and compress tech-transfer timelines, especially for antibody capture and emerging modalities. Merck KGaA's June 2026 announced acquisition of Bio-Techne (USD 11.3 billion) and the April 2026 closing of its acquisition of JSR Life Sciences' chromatography business (including Protein A resin offerings) reflect continued investment in downstream critical components. In parallel, Bio-Rad's June 30, 2025 acquisition of Stilla Technologies points to ongoing emphasis on high-performance analytical and workflow capabilities that can be paired with purification and in-process control requirements.
Recent Industry Developments in Protein Purification And Isolation Market
- June 2026: Thermo Fisher Scientific unveiled the Orbitrap Tribrid Apex and Orbitrap Excedion mass spectrometers at ASMS 2026, featuring AI-enabled software for advanced protein characterization and proteomics. The launch expands high-end analytics capabilities for proteomics workflows and supports data-driven insights across downstream processing. It strengthens Thermo Fisher’s downstream capabilities in bioprocess analytics by integrating with purification data tools and streamlining workflow data capture.
- April 2026: Merck KGaA completed the acquisition of JSR Life Sciences' chromatography business, adding Amsphere Protein A resins and downstream purification capabilities to its MilliporeSigma portfolio. The expansion reinforces downstream purification capability and broadens the resin portfolio for customer projects. It strengthens Merck’s end-to-end purification platform and supports a wider range of protein purification pipeline offerings.
- April 2026: Thermo Fisher Scientific launched the Gibco CHOvantage GS Cell Line Development Kit, enabling protein titers of 7 g/L or higher in fed-batch cultures to support biologics development. The kit supports higher-titer production and helps compress biologics development timelines. It expands Thermo Fisher’s cell line development offerings for purification workflows and improves alignment with downstream processing needs.


Protein Purification And Isolation Market Report Scope and Research Methodology
Market Definition and Coverage
For this methodology, the protein purification and isolation market covers revenues from products and tools used to separate, isolate, and clean up proteins from complex samples for downstream research, diagnostics, and bioprocessing workflows.
Scope exclusions: We exclude upstream sample collection and growth media, routine lab plastics that are not specific to purification workflows, and services that are not directly tied to purification and isolation steps.
Segments Covered in This Report
- By Product
- Instruments
- Consumables
- Kits
- Reagents and Buffers
- Columns and Cartridges
- Other Products
- By Technology
- Precipitation
- Ultrafiltration and Diafiltration
- Chromatography
- Ion-Exchange
- Size-Exclusion
- Reverse-Phase
- Others
- Electrophoresis
- Gel Electrophoresis
- Capillary Electrophoresis
- Isoelectric Focusing
- Western Blotting and Immunoprecipitation
- Other Technologies
- By End-User
- Academic and Research Institutes
- Pharmaceutical and Biopharmaceutical Companies
- Contract Research and Manufacturing Organizations (CROs/CMOs)
- Hospitals and Diagnostic Labs
- Other End Users
- By Geography
- North America
- United States
- Canada
- Mexico
- Europe
- Germany
- United Kingdom
- France
- Italy
- Spain
- Rest of Europe
- Asia-Pacific
- China
- Japan
- India
- Australia
- South Korea
- Rest of Asia-Pacific
- Middle East and Africa
- GCC
- South Africa
- Rest of Middle East and Africa
- South America
- Brazil
- Argentina
- Rest of South America
- North America
Data Sources, Market Sizing, and Validation
Desk Research
Desk research started with public science and health sources to set the demand context for protein work and downstream processing needs. We used sources such as NIH and NCBI resources, US FDA databases for biologics-related approvals, OECD health data, and statistics from groups like WHO to frame activity levels in life science and biopharma.
We then used company filings, investor decks, and reputable press coverage to understand product mix shifts (for example, consumables versus durable instruments), price direction, and capacity expansion plans. Patent databases were also checked to identify where newer chromatography media, membrane formats, and automation-related claims are appearing. For normalization and cross-checks, paid subscriptions covering company financials and another covering patent records were used where needed. The desk sources listed here are illustrative, and we also referenced other public materials for collection, validation, and issue resolution.
Primary Interviews and Surveys
Primary work focused on interviews and short surveys with people who use, specify, or sell purification and isolation products, including bioprocess teams, lab managers, procurement roles, and channel-side experts. Because this is a global market, we balanced discussions across major life science hubs so adoption, pricing, and replenishment cycles were not over-weighted to a single geography. Inputs from these conversations were used to close practical data gaps, such as typical replacement rates for consumables, and to sanity-check the sizing build-up before finalization.
Distribution of primary research fieldwork respondents
| Company type | Respondent position | Region |
|---|---|---|
| Top tier: 39% | CXOs: 12% | APAC: 47% |
| Mid tier: 44% | Functional/Unit leaders: 37% | EMEA: 35% |
| Smaller Players: 17% | Managers: 51% | Americas: 18% |
Market-Sizing & Forecasting
Sizing began with a top-down and bottom-up model logic. The top-down build reconstructs the demand pool from life science and bioprocess activity, then converts it into product spending using observed usage and replacement patterns. We anchored the model on signals such as biopharma R&D intensity, biologics and biosimilars pipeline momentum, expansion in CDMO manufacturing capacity, and the shift toward single-use and higher-throughput downstream workflows.
Those totals were then corroborated with selective bottom-up approximations, where sampled average selling prices were multiplied by plausible shipment and replenishment volumes for key categories, followed by channel-side reasonableness checks. Where data was thin, we used conservative penetration assumptions, then revisited them with interview feedback until the outputs aligned with observable demand signals.
For forecasting, we used scenario analysis since growth is driven by a set of measurable variables that can shift quickly, such as biologics production scaling, lab funding cycles, and technology substitution across purification steps. Assumptions for price progression, consumables pull-through, and adoption timing were adjusted with expert inputs, and a short list of alternative cases was maintained to test sensitivity of the final trajectory.
Data Validation & Update Cycle
Validation was performed through multiple checks so the model did not rely on any single source or assumption. We compared outputs against independent signals, including public R&D and biomanufacturing indicators, category-level revenue disclosures, and interview-based ranges for usage and replenishment. When large variances appeared, we rechecked inputs and triggered follow-up calls to confirm whether the mismatch was driven by scope, pricing, or timing.
Before sign-off, the workbook and logic are reviewed in steps by another analyst, and exceptions are documented so the final numbers remain traceable. Reports refresh annually, with interim updates when material events occur that can change demand or pricing. Just before delivery, a final pass is completed so clients receive the latest updated view.
Mordor Intelligence's Protein Purification and Isolation Market Size Measured Against Other Published Estimates
Published market values for protein purification and isolation do not always match because different authors choose different product boundaries, time bases, and pricing assumptions. In practice, the biggest differences often come from whether consumables pull-through is counted fully, how chromatography-intensive workflows are treated, and how currency timing is applied to global revenues.
The benchmark table shows a spread around the 2026 number. In Mordor Intelligence's model, the total includes instruments plus consumables used in purification workflows, with consumables replenishment rates validated through interviews and cross-checks against public demand signals.
Benchmark comparison
| Source | Market Size | Gaps in Research Methodology |
|---|---|---|
| Mordor Intelligence | USD 11.83 B (2026) | |
| Industry Consultancy A | USD 10.48 B (2024) | Uses an earlier base year and applies broad growth rates without clearly reconciling consumables replenishment versus installed instrument base, which can compress the starting value. |
| Trade Release B | USD 7.80 B (2024) | Narrows the spend pool using simplified category mapping and lighter validation on bioprocess demand drivers, which can leave out parts of chromatography and membrane-related recurring revenues. |
Taken together, the gap is mainly explained by base-year selection and how recurring consumables are treated versus durable systems. Our approach keeps each assumption linked to observable activity indicators and practical usage checks, which makes the final market value easier to replicate and review over time.


Key Questions Answered in the Report
What is the current size of the protein purification and isolation market?
The market is valued at USD 11.83 billion in 2026 and is forecast to reach USD 18.97 billion by 2031.
Which product category dominates revenue?
Consumables lead with 62.88% of 2025 revenue thanks to widespread single-use adoption.
Which technology segment is growing the fastest?
Ultrafiltration and diafiltration are projected to register an 10.90% CAGR through 2031.
Why is Asia-Pacific the fastest-growing region?
Large-scale CDMO expansions, cost-efficient labor, and supportive government incentives push the region to an 11.66% CAGR.
What challenges hinder technology adoption in emerging clusters?
High capital costs for advanced hardware and shortages of skilled purification talent slow deployment.
Page last updated on:


 Your data is secure and never sold or shared.


